CalDB 4.5.5 Public Release Notes
Public Release Date: 13 DEC 2012
SDP Installation Date: 2012-12-13T16:00:00 (UTC)
I. INTRODUCTION
CalDB 4.5.5 is an upgrade to the Chandra CalDB, which includes the following items:
- ACIS T_GAIN Epoch 51
- ACIS Time-dependent QEU
- HRC-I Gain Map/PI Background Spec Update 2012-09-27
- HRC-S QE version N0012
- Cycle 15 PIMMS Effective Areas
- (Yet another) Correction to ACIS Group E BKGRND headers
- CTI/DET_GAIN header changes for -110C ERs
For the CIAO 4.5 / CalDB 4.5.5 release notes see How CalDB 4.5.5 Affects Your Analysis.
II. SUMMARY OF CHANGES
A. ACIS T_GAIN Epoch 51
| Location: | $CALDB/data/chandra/acis/t_gain/ |
| Filenames: | acisD2012-05-01t_gainN0005.fits acisD2012-05-01t_gainN0006.fits acisD2012-08-01t_gainN0002.fits acisD2012-08-01t_gain_biN0002.fits |
The periodic ACIS T_GAIN correction upgrade for Aug - Oct 2012 has been released. The corrections are at nominal/expected levels of less than 2% of the energy value. This upgrade as usual affects observation data taken over Epoch 51 and 50, and so would update PHAs for OBS_IDs taken since 01 May 2012. Users with such datasets are encouraged to revalidate their analysis results after reprocessing their data with the upgraded CalDB files. For specific details of the new calibrations in this release, see the technical details section below.
See the why page for more information.
PIPELINES/TOOLS AFFECTED:
DS and CIAO level 1 (re)processing tool acis_process_events.
Also: CIAO reprocessing script chandra_repro for ACIS data with DATE-OBS after (UTC) 2012-05-01T00:00:00.
THREADS AFFECTED:
Reprocessing Data to Create a New L2 Events File
B. ACIS Time-dependent QEU
| Location: | $CALDB/data/chandra/acis/qeu/ |
| Filenames: | acisD2000-01-29qeuN0007.fits acisD2000-01-29qeuN0005B.fits acisD2002-02-01qeuN0007.fits acisD2002-02-01qeuN0005B.fits acisD2004-02-01qeuN0007.fits acisD2004-02-01qeuN0005B.fits acisD2006-02-01qeuN0007.fits acisD2006-02-01qeuN0005B.fits acisD2008-02-01qeuN0007.fits acisD2008-02-01qeuN0005B.fits acisD2010-02-01qeuN0007.fits acisD2010-02-01qeuN0005B.fits |
The ACIS calibration team has developed a time-varying calibration of the quantum efficiency uniformity (QEU), wherein the QEU calibration is broken into six time-displaced datasets. The physical cause is loss of progressively more events with time due to grade migration, a CTI effect. The new calibration comes from subdividing the External Calibration Source (ECS) monitoring measurements over groups of eight T_GAIN epochs from Jan 2000 through mid-2012. The results indicate a time-degradation of 1% in the ACIS-I QE over the life of the mission, while for ACIS-S3 the QE loss is 3%. (For the case of GRADED S3 data, the QE loss is 4% over the full mission timeline.) For specific details of the QEU calibrations in this release, see the technical details section below.
NOTE ALSO: The QEU modifications with time are much more subtle than the ACIS OBF Contamination effect (CONTAM) for photon energies less than 1.0 keV.
PIPELINES/TOOLS AFFECTED:
NOTE: The following tools are effected only for ACIS Observations by the new QEUs:
THREADS AFFECTED:
Imaging:
- Compute Net Counts, Rate, or Flux for Point Sources
- Estimate Source Counts in an Image
- Single Chip ACIS Exposure Map and Exposure-corrected Image
- Multiple Chip ACIS Exposure Map and Exposure-corrected Image
Imaging Spectroscopy:
- Extract Spectrum and Response Files for a Pointlike Source
- Extract Spectrum and Response Files for an Extended Source
- Extract Spectrum and Response Files for a Field of Sources
Grating Spectroscopy:
C. HRC-I Gain Map/PI Background Spec Update 2012-09-27
| Location: | $CALDB/data/chandra/hrc/gmap/ |
| Filename: | hrciD2012-09-27sampgainN0001.fits |
| Location: | $CALDB/data/chandra/hrc/pibgspec |
| Filename: | hrciD2012-09-27pibgspecN0001.fits |
The annual update to the HRC-I time-dependent gain and the corresponding PI Background Spectrum are now available.
See the HRC-I Gain Maps why page for more information.
PIPELINES/TOOLS AFFECTED:
GMAP only: hrc_process_events
THREADS AFFECTED:
For the GMAP: Reprocessing Data to Create a New Level=2 Event File
For the PIBGSPEC: The HRC-I Background Spectra Files
D. HRC-S QE version N0012
| Location: | $CALDB/data/chandra/hrc/qe/ |
| Filenames: | hrcsD2012-03-29qeN0012.fits |
The HRC-S HV change, which programmatically dates from 2012-03-29, was done to recover some of the QE lost over time. Naturally this requires an update to the HRC-S QE calibration for observations taken after that date. Analysis was done of two calibration sources to estimate the count rate increase, whence to adjust the existing QE vs Energy for the three detector plates. The outcome is a 4.5-6% increase in the QE, extending linearly with wavelength from low λ (4.5%) to high λ (6%).
See the HRC-S QE/QEU why page for more information.
PIPELINES/TOOLS AFFECTED:
NOTE: The new HRC-S QE affects only recent HRC-S Observations when using the following CIAO tools:
THREADS AFFECTED:
Imaging:
- Compute Net Counts, Rate, or Flux for Point Sources
- Estimate Source Counts in an Image
- HRC-S Exposure Map and Exposure-Corrected Image
Grating Spectroscopy:
E. Cycle 15 PIMMS Effective Areas
| Location: | $CALDB/data/chandra/pimms/acis/ |
| Filenames: | acisiD2012-11-26pimmsN0015.fits acisihetg0D2012-11-26pimmsN0015.fits acisiletg0D2012-11-26pimmsN0015.fits acissD2012-11-26pimmsN0015.fits acissheg1D2012-11-27pimmsN0015.fits acisshegmeg1D2012-11-27pimmsN0015.fits acisshetg0D2012-11-27pimmsN0015.fits acissleg1D2012-11-26pimmsN0015.fits acissletg0D2012-11-26pimmsN0015.fits acissmeg1D2012-11-27pimmsN0015.fits |
| Location: | $CALDB/data/chandra/pimms/hrc/ |
| Filenames: | hrciD2012-11-26pimmsN0015.fits hrciletg0D2012-11-26pimmsN0015.fits hrcsD2012-11-26pimmsN0015.fits hrcsleg1D2012-11-27pimmsN0015.fits hrcsleghiD2012-11-27pimmsN0015.fits hrcsletg0D2012-11-27pimmsN0015.fits |
The CYCLE 15 PIMMS Effective Area files have been added to the CalDB in version 4.5.5. These files have no use whatever to CIAO users, and are only read by the DS8.5.1 operating system in populating the online PIMMS effective area viewer and count rate calculator.
The PIMMS Cycle 15 effective areas are plotted at Cycle 15 PIMMS Effective Areas, and background information is available at this link. Additionally, see the CXC PIMMS Effective Area Viewer and the PIMMS Count Rate Calculator for the cycle 15 updates.
PIPELINES/TOOLS AFFECTED:
NONE!
THREADS AFFECTED:
NONE!
F. (Yet another) Correction to ACIS Group E BKGRND headers
| Location: | $CALDB/data/chandra/bkgrnd/ |
| Filenames: | acis0iD2005-09-01bkgrnd_ctiN0004.fits acis1iD2005-09-01bkgrnd_ctiN0004.fits acis2iD2005-09-01bkgrnd_ctiN0004.fits acis2sD2005-09-01bkgrnd_ctiN0004.fits acis2sD2005-09-01bkgrndN0004.fits acis3iD2005-09-01bkgrnd_ctiN0004.fits acis3sD2005-09-01bkgrnd_ctiN0004.fits acis3sD2005-09-01bkgrndN0004.fits acis5sD2005-09-01bkgrnd_ctiN0004.fits acis5sD2005-09-01bkgrndN0004.fits acis6iD2005-09-01bkgrnd_ctiN0004.fits acis6sD2005-09-01bkgrnd_ctiN0004.fits acis6sD2005-09-01bkgrndN0004.fits acis7iD2005-09-01bkgrnd_ctiN0004.fits acis7sD2005-09-01bkgrnd_ctiN0004.fits acis7sD2005-09-01bkgrndN0004.fits acis8sD2005-09-01bkgrnd_ctiN0004.fits acis8sD2005-09-01bkgrndN0004.fits |
The above files have been updated (again!) this time to correct the value of TFORM14, the datatype of the STATUS column. The reason for this is that versions N0003 of all the above files, released with CalDB 4.5.3 in October 2012, have the wrong TFORM14 value ("4B" instead of "32X") which causes status filtering to fail.
Hence, a new ACIS BKGRND download file for CalDB 4.5.5 has been generated, which includes the above files corrected for that error. The new ciao-install setup on the CIAO 4.5 web page will detect whether you have upgraded CalDB to 4.5.5 yet, and download these new files automatically for you.
G. CTI/DET_GAIN header changes for -110C ERs
| Location: | $CALDB/data/chandra/acis/cti/ |
| Filename: | acisD2000-01-29ctiN0006.fits |
| Location: | $CALDB/data/chandra/acis/det_gain/ |
| Filename: | acisD2000-01-29gainN0005.fits |
We have found that there is one -110C CTI-correction monitoring Engineering Run observation (62006) that does not process correctly with CalDB 4.5.4 in Repro 4. This issue is fixed in CalDB 4.5.5 with header changes to the above files, so that they will NOT be selected by default for 62006. Science users are completely unaffected by this change.
PIPELINES/TOOLS AFFECTED:
acis_process_events for -110C OBS_MODE=SECONDARY OBS_IDs only (not science observations).
THREADS AFFECTED:
None.
III. TECHNICAL DETAILS
A. ACIS T_GAIN Epoch 51
The ACIS time-dependent gain corrections (T_GAIN) have recently been updated for current changes from the previous T_GAIN epoch, specifically Epoch 51, which was August through October 2012. With the addition of these new corrections, derived from ACIS External Cal Source (ECS) data taken during radiation zone passes, the CalDB files extending from May 01 2012 through July 2012 (i.e. Epoch 50) have been finalized, and new non-interpolating T_GAIN files are now implemented for Epoch 51.
The magnitudes (in eV) of the new gain corrections, versus photon energy, are given in Figs. 1-3 below. The corrections are of the usual order in magnitude, specifically less than 2.0% of the photon energy value. Fig. 1 below gives the corrections for the ACIS-I aimpoint on chip ACIS-3, for the CTI-corrected case, which is the only one applicable to FI chips. Figure 2 gives the corrections for the ACIS-S aimpoint on ACIS-7, for the case where the BI chips are CTI-corrected. Finally Fig. 3 gives the corrections for ACIS-7 for NON-CTI-corrected BI chips. These would be relevant to GRADED DATAMODE observations with ACIS-S, for example.
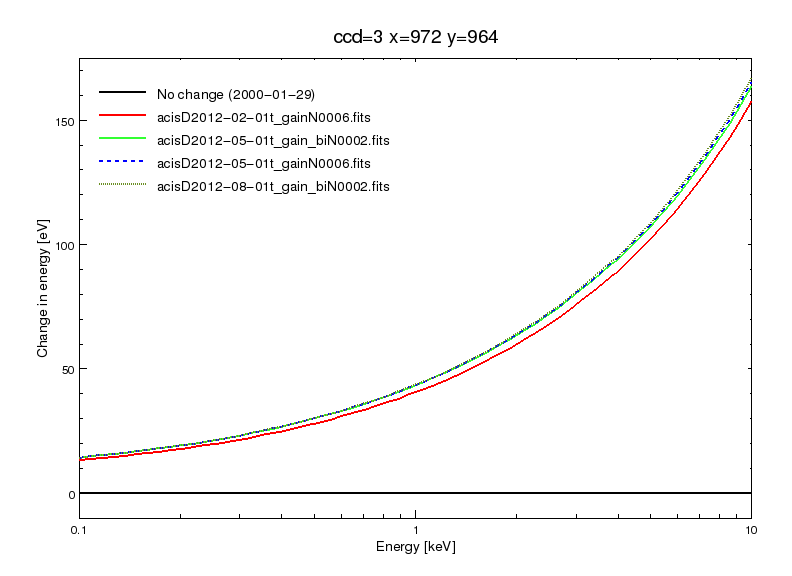
Fig. 1: ACIS-I3 aimpoint T_GAIN corrections in eV versus
photon energy.
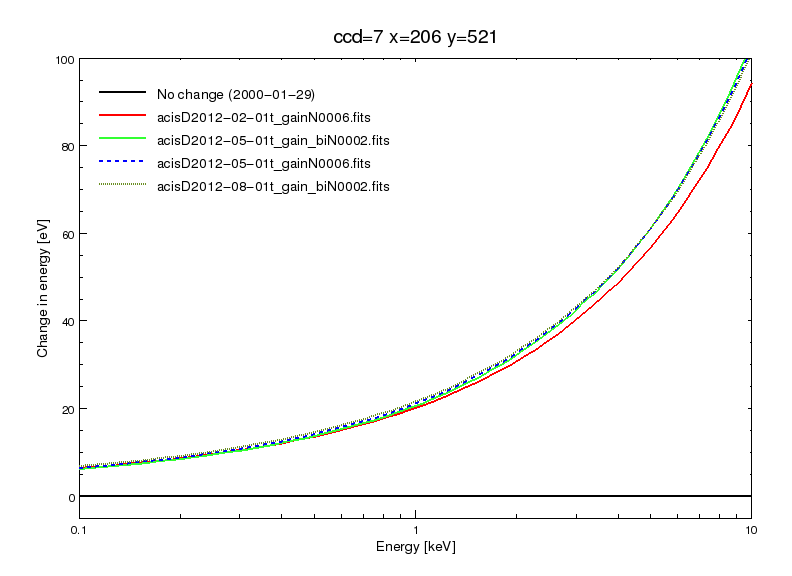
Fig. 2: ACIS-S3 CTI-corrected aimpoint T_GAIN corrections in eV versus
photon energy.

Fig. 3: ACIS-S3 non-CTI-corrected aimpoint T_GAIN corrections in
eV versus photon energy.
B. ACIS Time-dependent QEU
The time-dependent QEU files were created using External Calibration Source (ECS) data at two-year epochs. Details on the QEU modeling methods can be found in the memo High-resolution QEU maps for ACIS-I and S1,2,3 chips.
See the CXC Calibration Web page ACIS time-dependent QEU for further details.
Fig. 4: The percentage QE loss over time at the aimpoint regions
for S3 (with and without CTI correction) and I3.
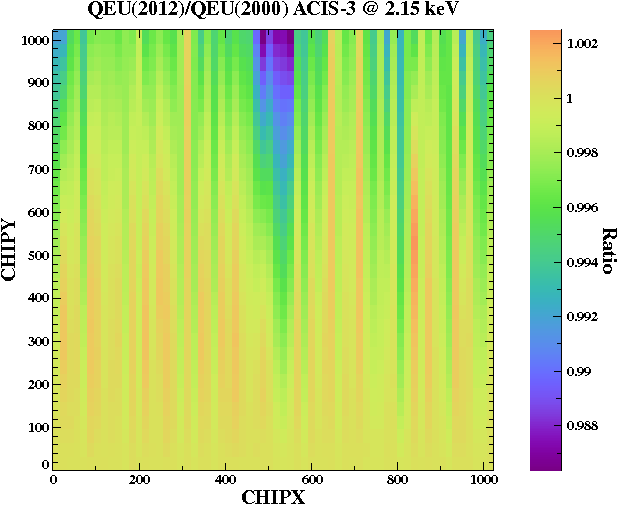
Fig. 5: Ratio image showing the changes in QE from 2000 to 2012 for I3 at 2.15 keV
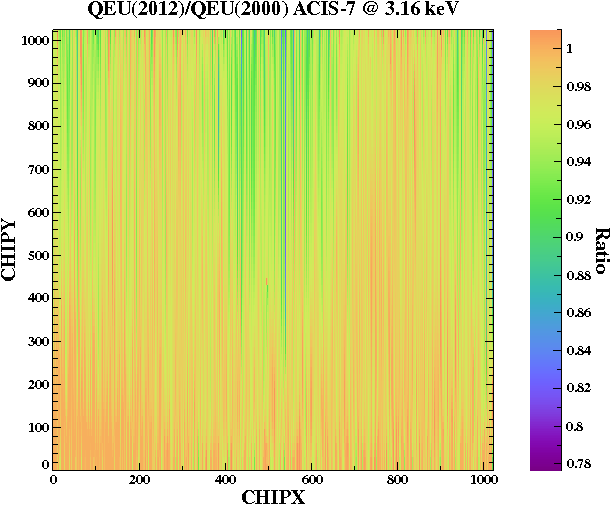
Fig. 6: Ratio image showing the changes in QE from 2000 to 2012
for S3 at 3.16 keV. This is for the S3 CTI-corrected case
(DATAMODE=FAINT or VFAINT).
C. HRC-I Gain Map/PI Background Spec Update 2012-09-27
A new HRC-I GMAP has been generated for the (UTC) period 2012-09-27T12:00 to the present, and extending into 2013. The corrections were generated using G21.5-0.9 and HZ 43 calibration observations taken regularly to monitor HRC-I, combined with a sequence of ArLac observations at 21 specific locations on HRC-I, taken annually.
The HRC-I gain continues to decline slowly (typically ≤5% per year). Annual updates to the gain maps are found to be adequate to maintain 2% consistency in the PI. Images of the new Sept 2012 GMAP, and a ratio of the new map to the previous (2011) one already in CalDB are shown in Fig. 7A & B below. In Fig. 7B, the sense of the ratio is that the 2012 map includes equal to or larger corrections (equal to or greater than unity) compared with last year's gmap.
Fig. 7A: The new HRC-I GMAP derived from Sept 2012 ArLac observations, and periodic HZ43 and G21.5-0.9 observations. |
Fig. 7B: Ratio of the new 2012 GMAP to the one from 2011. |
A corresponding upgrade to the PIBGSPEC library fo 2012 has also been derived, effective for the same time-period as the above HRC-I GMAP. The background PI spectra are generated from the same HRC-I calibration observations of AR Lac used to derive the new GMAP. These 21 observations are reprocessed with the new GMAP, generating new PI scaled to SUMAMPS values.
For each year, the HRC-I Cal team extracts events in a 800x800 pixel box at the 17 observation locations that are within 10 arcmin of the aim point, excluding the location of the source. They sum the PI spectra from each location, weighting by exposure time, to create the final PI spectrum for the year. Finally, the PI spectra are Loess-smoothed with a third-degree polynomial fit over ranges 10 channels wide.
Figure 8 shows the PI spectra (as calculated count rates) for each year since 2009:
Fig. 8: The HRC-I Background PI spectra for 2009-2012, including
the latest spectrum derived from Sept 2012 AR Lac data.
D. HRC-S QE version N0012
A gain droop over time has caused the HRC-S to lose quantum efficiency as a function of wavelength with noticeable drops in efficiency above 120Å for negative orders. Incremental voltage adjustment tests at higher operating voltages were conducted on 2012 Jan 9 and the default HRC-S voltage settings were changed in mid-March, restoring performance to what it was circa 2002. Post-adjustment observations were taken of the white dwarf HZ43, and the blazar MKN421 during real-time voltage switching. Analysis of the data prior to and after the adjustments resulted in a wavelength-dependent correction to the HRC-S QE. Users can expect an increase in counts of 4.5-6% dependent on ϣ, which is corrected by the revised QE map. The before and after adjustment residuals are shown in Fig. 9 below, using data from HZ43.
Fig. 9: Ratio of count rates versus wavelength summed for two
sources with NewV=HiVoltage observations since 3/2012, and
OldV=Observations taken between 11/1999 and 8/2006.