CAVEAT for the ACIS N0005 Response Suite
The latest calibration data for -120C ACIS responses (those released with CalDB 3.2.0 represent the best of our efforts to characterize these detectors for some time to come. The suite of response data, as usual, includes CTI corrections, T_GAIN corrections, DET_GAIN (to determine PI's), and response input data for mkacisrmf (P2_RESP file). All files in this suite are version "N0005." We are aware of certain systematic errors in these calibrations, predominantly in the central regions of only the front-illuminated (FI) chips, which we illustrate here.
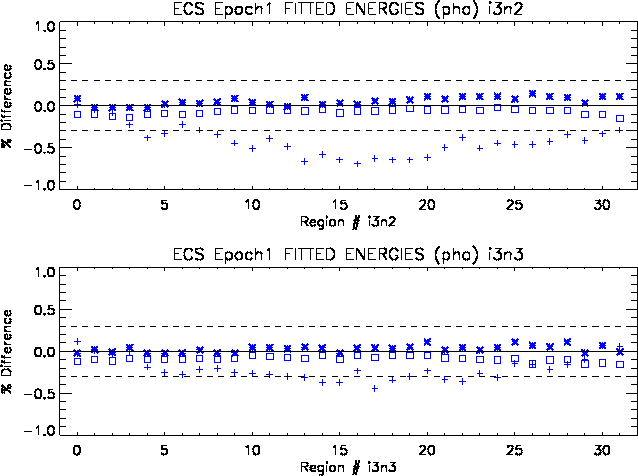
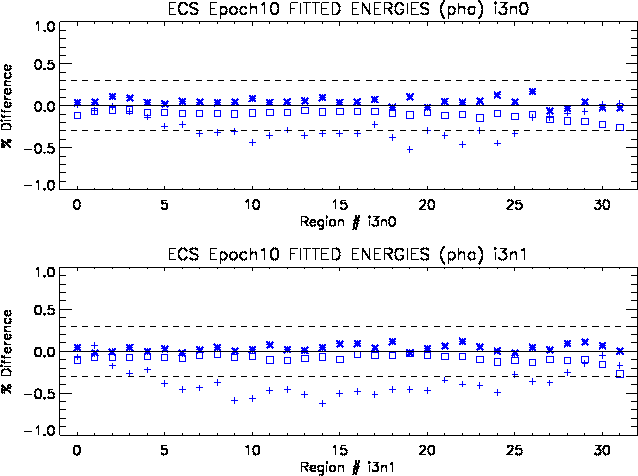
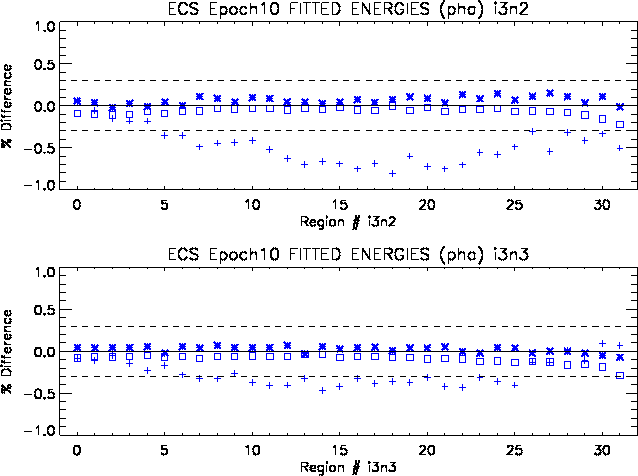
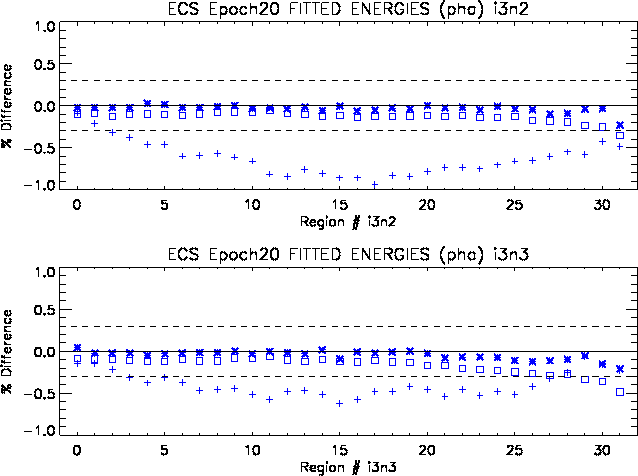
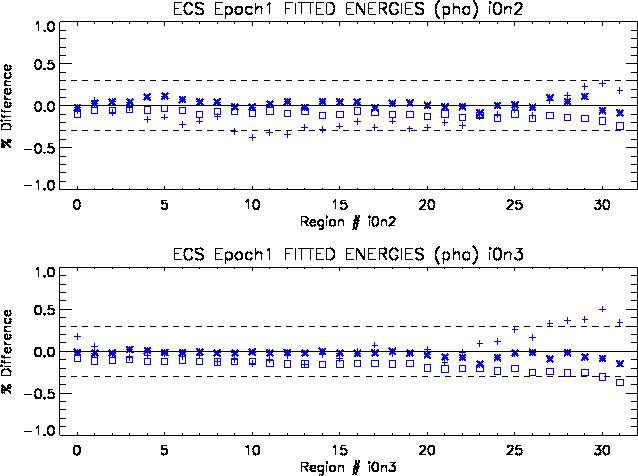
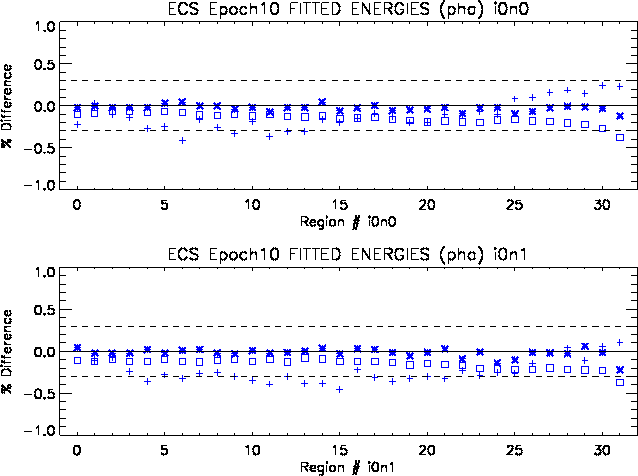
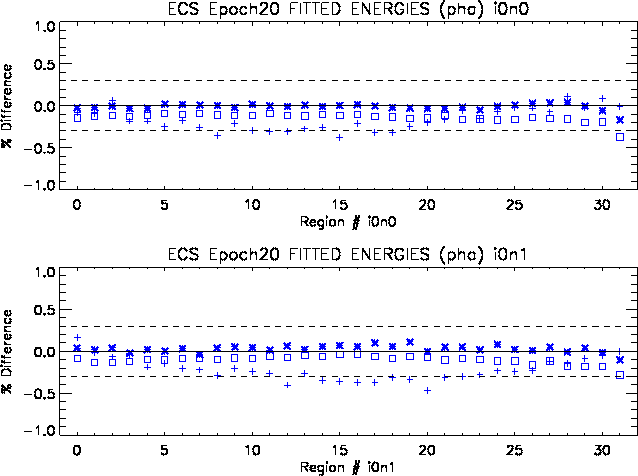
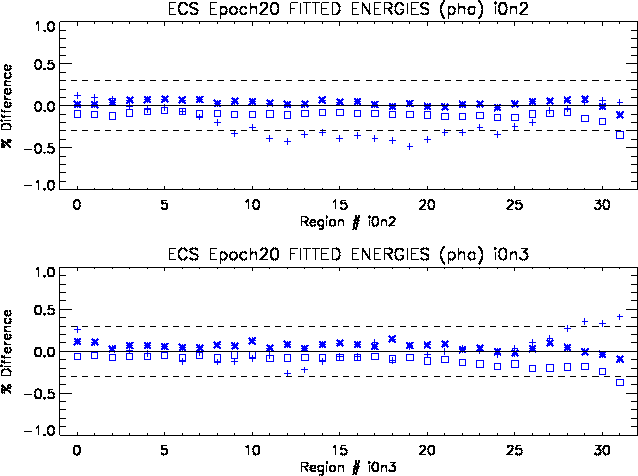
In our testing of the ACIS response to known line radiation in the onboard External Calibration Source (ECS), we have identified a small sag in the apparent gain toward the centers of the FI chips at the lowest ECS line, Al-K, or 1.487 keV. The effect is not present for the higher-energy Ti-K(4.51 keV) and Mn-K(5.898keV) lines. The effect increases gradually with time, giving about a 0.5% to 0.7% error during the first few months of the year 2000 observations, and increasing to 0.8-1.2% by mid year 2004. This is equivalent to approximately a 1-3 PHA channel shift of a line position at 1.487 keV, downward in energy. Figs 1-3 show the progression of this effect on ACIS-3 (the ACIS-I aimpoint chip) for ACIS T_GAIN epochs 1 (year 2000), 10 (2002), and 20 (2004). Note that this sag appears most markedly in Node 2 of I3, and is centered around row 512, or the middle of the chip. Figs. 4-6 show the same results for ACIS-0.
Insofar as we can tell, effect is only visible when working in PHA space near 1.5 keV. Analysis of the low-energy E0102-72.3 thermal line emission in PI space, we have not been able to see this effect at all. This is in part due to the (4X) broader PI binning.
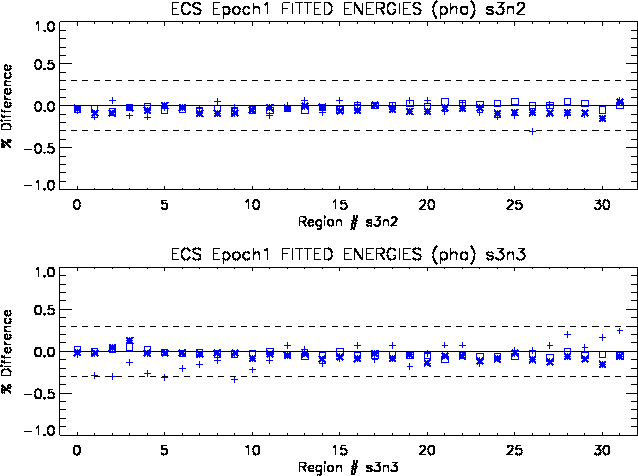
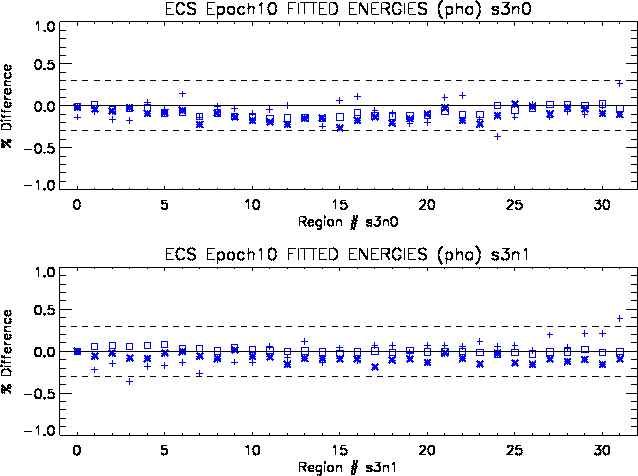
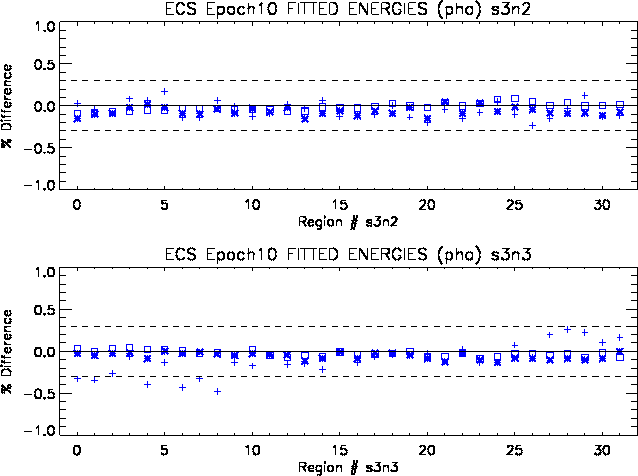
This effect does not occur for the back-illuminated chips S1 (ACIS-5) and S3 (ACIS-7). This is made clear in Figs 7-9, for chip S3.
For all figures the "+" sign indicates results for the Al-K line, at 1.487 keV, the squares are for Mn-Ka (5.898keV), and the "*" (asterisks) indicate Ti-Ka (4.51 keV)
ACIS-I3 Nodes 0 and 1 (Epoch 1) |
ACIS-I3 Nodes 2 and 3 (Epoch 1) |

|
|
Fig. 1: Relative errors expressed as percent of the known value in the fitted line positions for each node (graph) and tile (symbol) of ACIS-I3, for the three main ECS lines. The T_GAIN epoch number is 1, corresponding to Feb-April 2000. The dashed line marks the 0.3% error level, corresponding to a 1 PHA-channel shift at 1.487 keV.
ACIS-I3 Nodes 0 and 1 (Epoch 10) |
ACIS-I3 Nodes 2 and 3 (Epoch 10) |
|
|
Fig. 2: Percent line position errors for ACIS-I3, T_GAIN epoch 10 (May-Jul 2002). Note the sag in nodes 1 and 2 at 1.487 keV toward the central rows is more pronounced than for Epoch 1.
ACIS-I3 Nodes 0 and 1 (Epoch 20) |
ACIS-I3 Nodes 2 and 3 (Epoch 20) |

|
|
Fig. 3: Percent line position errors for ACIS-I3, T_GAIN epoch 20 (May-Jul 2004). Here the 1.487 keV gain sag in Nodes 1 and 2 is up to 1% near the middle of the chip, and extends over a broad range of rows.
ACIS-I0 Nodes 0 and 1 (Epoch 1) |
ACIS-I0 Nodes 2 and 3 (Epoch 1) |

|
|
Fig. 4: Percent line postion errors for ACIS-I0, T_GAIN epoch 1.
ACIS-I0 Nodes 0 and 1 (Epoch 10) |
ACIS-I0 Nodes 2 and 3 (Epoch 10) |
|

|
Fig. 5: Percent line postion errors for ACIS-I0, T_GAIN epoch 10.
ACIS-I0 Nodes 0 and 1 (Epoch 20) |
ACIS-I0 Nodes 2 and 3 (Epoch 20) |
|
|
Fig. 6: Percent line postion errors for ACIS-I0, T_GAIN epoch 20.
ACIS-S3 Nodes 0 and 1 (Epoch 1) |
ACIS-S3 Nodes 2 and 3 (Epoch 1) |

|
|
Fig. 7: Percent line postion errors for ACIS-S3, T_GAIN epoch 1. Note the effect seen in I0 and I3 is not present at all.
ACIS-S3 Nodes 0 and 1 (Epoch 10) |
ACIS-S3 Nodes 2 and 3 (Epoch 10) |
|
|
Fig. 8: Percent line postion errors for ACIS-S3, T_GAIN epoch 10. Again, no systematic sag in the gain is present.
ACIS-S3 Nodes 0 and 1 (Epoch 18) |
ACIS-S3 Nodes 2 and 3 (Epoch 18) |

|

|
Fig. 9: Percent line postion errors for ACIS-S3, T_GAIN epoch 18, (January 2004). Again, no systematic sag in the gain occurs.