CalDB 4.4.7 Public Release Notes
Public Release Date: 15 DEC 2011
SDP Installation Date: 2011-12-15T17:00:00 (UTC)
I. INTRODUCTION
CalDB 4.4.7 is an upgrade to the Chandra CalDB, which includes the following items:
- ACIS T_GAIN Epoch 47
- HRC-I GMAPS 2010, 2011
- HRC-I PIGBSPEC 2010, 2011
- HRC-S Quantum Efficiency Version 11
- PIMMS Cycle 14 Effective Areas
- HETG Grating Efficiency (GREFF) version N0007; See the CalDB 4.4.6.1 release notes.
For the CIAO 4.4 / CalDB 4.4.7 release notes see How CIAO 4.4 and CalDB 4.4.7 Affect Your Analysis
II. SUMMARY OF CHANGES
A. ACIS T_GAIN Epoch 47
| Location: | $CALDB/data/chandra/acis/t_gain |
| Filenames: | acisD2011-05-01t_gainN0005.fits acisD2011-05-01t_gainN0006.fits acisD2011-08-01t_gainN0002.fits acisD2011-08-01t_gain_biN0002.fits |
The most recent ACIS T_GAIN epochal corrections have been compiled and released for Standard Data Processing (SDP) and for CIAO 4.4, specifically for the August 1 through Oct 31 period (Epoch 47). The corrections for this period are nominal, being less than 2% for all energies at the ACIS-I and ACIS-S aimpoints. These updates affect all ACIS datasets with DATE-OBS after 2011-05-01T00:00:00. Users with such datasets are encouraged to revalidate their analysis results after reprocessing their data with the upgraded CalDB files. For quantitative details see the technical details section below.
See the why page for more information.
PIPELINES/TOOLS AFFECTED:
DS and CIAO level 1 (re)processing tool acis_process_events.
Also: CIAO reprocessing script chandra_repro
THREADS AFFECTED:
Reprocessing Data to Create a New L2 Events File
B. HRC-I GMAPS 2010, 2011
| Location: | $CALDB/data/chandra/hrci/gmap |
| Filenames: | hrciD2010-09-25sampgainN0002.fits hrciD2011-09-19sampgainN0001.fits |
The HRC-I calibration team has released two new time-displaced gain maps (GMAP), applicable to data taken during the past year, and the year going forward. The first file affects HRC-I observations with DATE-OBS between 2010-09-25T12:00:00 and 2011-09-19T12:00:00, and is an upgrade of the previous GMAP of the same date. (Hence the N0002 version number.) The second file is the anticipated annual update to the GMAP for September 2011, and affects all HRC-I OBS_IDs taken since 2011-09-19T12:00:00.
These gain maps use the SUMAMPS metric that was implemented in time-dependent GMAPs with CalDB 4.2.0 in December 2009. The original GMAP for Sept 25, 2010 (version N0001) was released with CalDB 4.4.1 in December 2010. For details on the derivation and affect on PI values for the new files, see the technical details section below.
See the why page for more information.
PIPELINES/TOOLS AFFECTED:
SDP/CIAO Level 1 (re)processing tool hrc_process_events
Also: CIAO reprocessing script chandra_repro
THREADS AFFECTED:
Reprocessing Data to Create a New Level 2 Events File
C. HRC-I PIGBSPEC 2010, 2011
| Location: | $CALDB/data/chandra/hrc/pibgspec/ |
| Filenames: | hrciD2010-09-25pibgspecN0001.fits hrciD2011-09-19pibgspecN0001.fits |
The new HRC-I background spectra files, used to compute the cumulative background distributions of HRC-I datasets, and to estimate the efficacy that the PI filtering will achieve, are being added to CalDB for their corresponding GMAPs in the previous section. Note that the two files correspond in applicable date ranges to the two new GMAP files above. A comparison of the new PIBGSPEC files to the previously released ones is given in the tech details section below.
PIPELINES/TOOLS AFFECTED:
None
THREADS AFFECTED:
The HRC-I Background Spectra Files
D. HRC-S Quantum Efficiency Version 11
| Location: | $CALDB/data/chandra/hrc/qe/ |
| Filename: | hrcsD1999-07-22qeN0011.fits |
A new mean quantum efficiency (QE) file has been released for HRC-S, now version N0011. For quantitative details of the new QE, see the technical details section below.
See the HRC-S QE/QEU why page for more information.
PIPELINES/TOOLS AFFECTED:
CIAO script fullgarf, which uses the tool mkgarf, though this only works for +/- 1st-order gARFs for LETGS. See the thread below for higher-order gARFs, done manually.
CIAO tool mkexpmap, which employs mkinstmap
THREADS AFFECTED:
HRC-S Exposure Map and Fluxed Image
E. PIMMS Cycle 14 Effective Areas
| Location: | $CALDB/data/chandra/pimms/acis/ |
| Filenames: | acisiD2008-12-29pimmsN0011.fits acisihetg0D2009-01-12pimmsN0011.fits acisiletg0D2008-12-29pimmsN0011.fits acissD2008-12-29pimmsN0011.fits acissheg1D2009-01-14pimmsN0011.fits acisshegmeg1D2009-01-14pimmsN0011.fits acisshetg0D2009-01-12pimmsN0011.fits acissleg1D2009-01-14pimmsN0011.fits acissletg0D2008-12-29pimmsN0011.fits acissmeg1D2009-01-14pimmsN0011.fits |
| Location: | $CALDB/data/chandra/pimms/hrc/ |
| Filenames: | hrciD2008-12-29pimmsN0011.fits hrciletg0D2008-12-29pimmsN0011.fits hrcsD2008-12-29pimmsN0011.fits hrcsleg1D2008-12-29pimmsN0011.fits hrcsleghiD2008-12-29pimmsN0011.fits hrcsletg0D2008-12-29pimmsN0011.fits |
The new PIMMS effective areas applicable to the Chandra Cycle 14 Call for Proposals (CfP) are being released in CalDB 4.4.7. PIMMS is no longer included in the CIAO distribution, beginning with CIAO 4.3. Only the online PIMMS calculator and effective area viewer are affected by this release.
PIPELINES/TOOLS AFFECTED:
Chandra PIMMS Effective Area Viewer
Chandra PIMMS Count Rate Calculator
Plots, comparisons, and input calibrations used in the Cycle 14 PIMMS effective area files are given in the two public web pages below:
III. TECHNICAL DETAILS
A. ACIS T_GAIN Epoch 47
The ACIS time-dependent gain corrections (T_GAIN) have recently been updated for current changes from the previous T_GAIN epoch, specifically Epoch 47, which was August through October 2011. With the addition of these new corrections, derived from ACIS External Cal Source (ECS) data taken during radiation zone passes, the CalDB files extending from May 2011 through July 2011 (i.e. Epoch 46) have been finalized, and new non-interpolating T_GAIN files are now implemented for Epoch 47.
The magnitudes (in eV) of the new gain corrections, versus photon energy, are given in Figs. 1-3 below. The corrections are of the usual order in magnitude, specifically less than 2.0% of the photon energy value. Fig. 1 below gives the corrections for the ACIS-I aimpoint on chip ACIS-3, for the CTI-corrected case, which is the only one applicable to FI chips. Figure 2 gives the corrections for the ACIS-S aimpoint on ACIS-7, for the case where the BI chips are CTI-corrected. Finally Fig. 3 gives the corrections for ACIS-7 for NON-CTI-corrected BI chips. These would be relevant to GRADED DATAMODE observations with ACIS-S, for example.
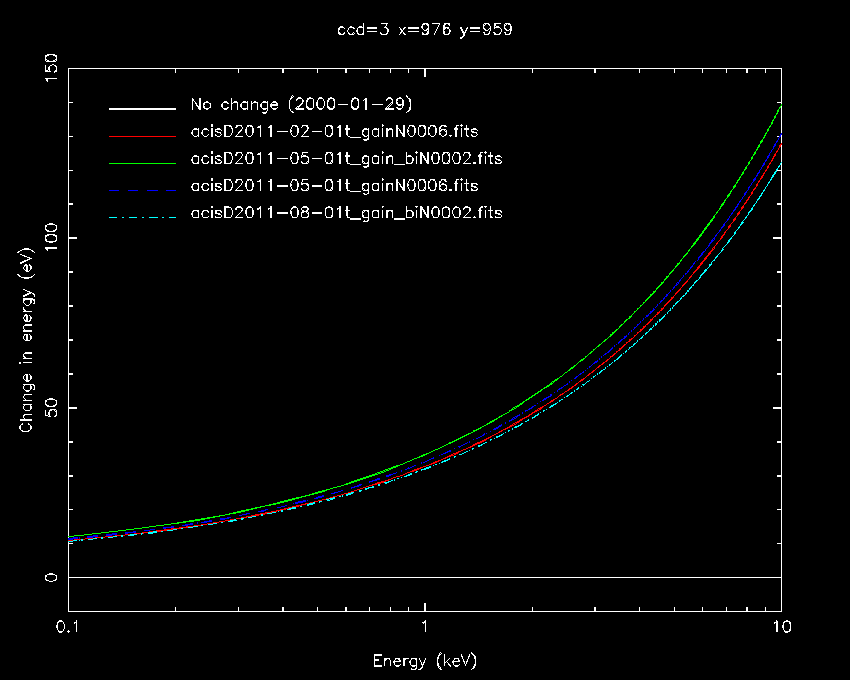
Fig. 1: ACIS-I3 aimpoint T_GAIN corrections in eV versus photon energy.
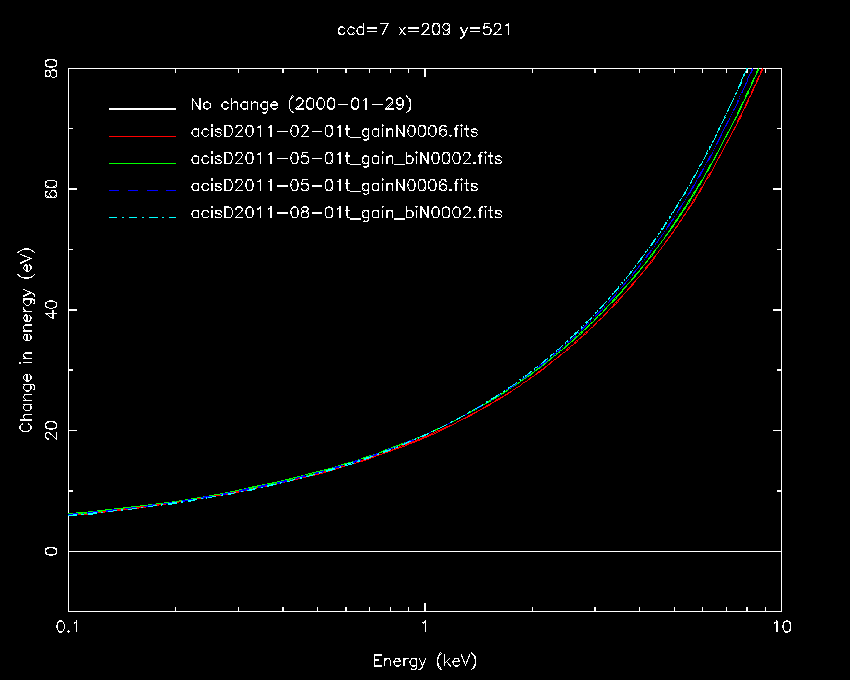
Fig. 2: ACIS-S3 CTI-corrected aimpoint T_GAIN corrections in eV versus photon energy.
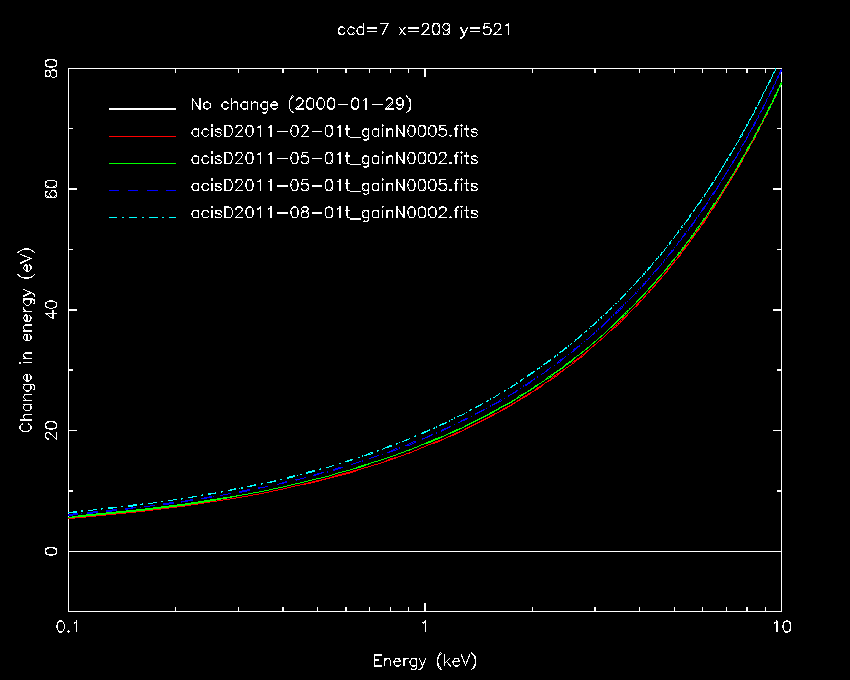
Fig. 3: ACIS-S3 non-CTI-corrected aimpoint T_GAIN corrections in eV versus photon energy.
B. HRC-I GMAPS 2010, 2011
New HRC-I GMAPs have been generated for the (UTC) periods 2010-09-25T12:00:00 to 2011-09-19T12:00:00, and from 2011-09-19T12:00:00 to the present and extending into 2012. The corrections are generated using AR Lac, G21.5-0.9, and HZ 43 observations regularly taken for calibration purposes on HRC-I. The HRC-I gain continues to decline slowly (typically ≤5% per year). Annual updates to the gain maps are found to be adequate to maintain 2% consistency in the PI. Images of the old and new Sept 2010 GMAPS and the new Sept 2011 GMAP are shown in Fig. 4 below.
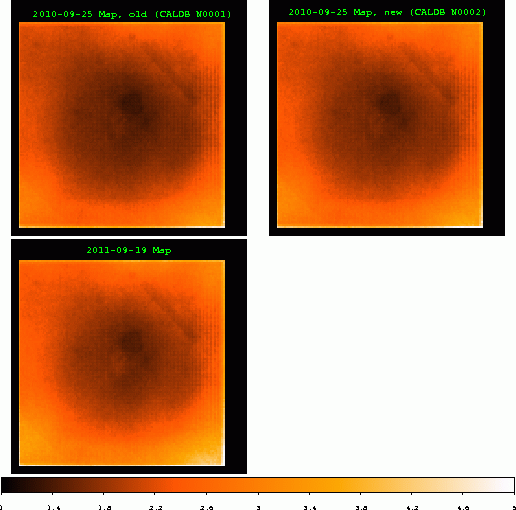
Fig. 4: The FITS images of the 2010 GMAPS old (upper left)
and new (upper right) 2010 GMAPs, and the new 2011 (lower left) GMAP.
The 2010 GMAP file is being updated to version N0002 because of an affect shown in Fig. 5 below. In this plot, the data points show gain correction factors measured from observations of AR Lac, G21.5-0.9, and HZ 43. The dashed line shows the best exponential+linear fit to the data as of 2008. All the gain maps currently in the CALDB (including 2010 version N0001) incorporate this fit. With the addition of all the 2010 and 2011 data points (everything after T = 120 months), it is clear that the fit does not accurately describe the gain correction needed for 2010 and 2011. So, the new 2010 and 2011 gmaps have an additional correction above the previous exponential+linear fit. This is represented by the solid black vertical lines at T ~ 130 and 140 months. The new map (N0002) for 2010 is 5.3% higher than the old (N0001) 2010 map.

Fig. 5: The data points from HRC-I observations, along with
the original fit (dashed curve) used to derive gain corrections for
years 1999-2009 GMAPs. The vertical solid lines show the additional
corrections needed for 2010 N0002 and 2011, respectively.
Figs. 6 and 7 below illustrate the currection given in the 2010 N0002 and 2011 GMAPs for Ar Lac data. Fig. 6 gives the mean PIs for all HRC-I AR Lac observations, versus time. Each cluster of points is the 21 observations for that year. The last set of points (red asterisks) are the 2010 mean PIs with the old gmap. Note that they are slightly lower than most of the other sets. Fig. 7 gives the same data, but with the new 2010 version N0002 GMAP applied.
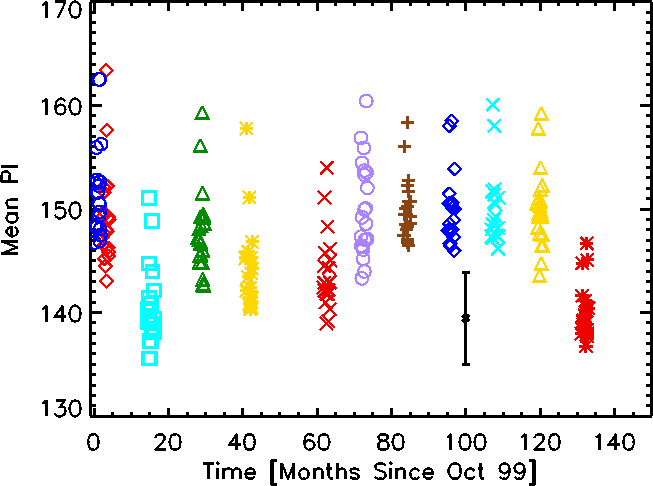
Fig. 6: Mean PIs for all HRC-I AR Lac observations, versus
time. Each cluster of points is the 21 observations for that year.
The last set of points (red asterisks) are the 2010 mean PIs with the
old gmap. Note that they are slightly lower than most of the other
sets.
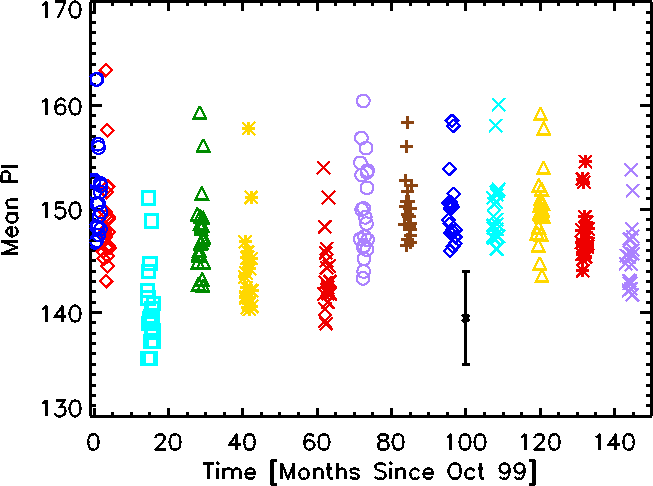
Fig. 7: same as Fig. 6, but with the new 2010 gmap. Notice
the 2010 mean PIs (red asterisks) are higher. The 2011 mean PIs are
shown by purple Xs.
C. HRC-I PIGBSPEC 2010, 2011
The following information is also posted on the HRC-I Background PI Spectra web page. See that page for details in the calibrations and the file contents.
There is one background PI spectrum per year, corresponding exactly in date and validity period with a time-diplaced HRC-I GMAP. The spectra can be used to calculate a custom PI filter to reduce background, as explained in the HRC-I Background Spectra CIAO thread. The files were first introduced in CALDB 4.3.
Fig. 8 below shows the PI spectra for each year, including the two new spectra files.
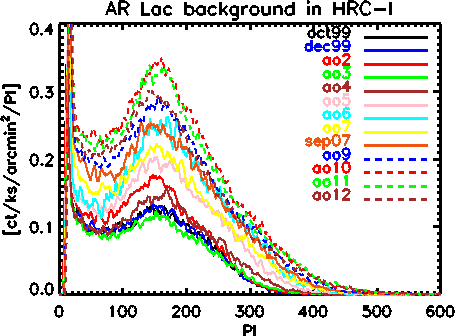
Fig. 8: The HRC-I spectra from Oct 1999 through the present,
including the two new additions for Sep 2010 (green dashes) and for
Sep 2011 (brown dashes).
D. HRC-S Quantum Efficiency Version 11
From the LETGS calibration group:
"Following in-flight calibration of the low energy QE, models of flux vs energy and parameter estimates for the two main calibration standards HZ43 and Sirius B underwent significant revisions. The latest non-LTE pure hydrogen model atmospheres computed by the Tubingen group have been used to devise a new low energy calibration. Using co-added data for HZ43 obtained since launch, sufficient signal was obtained to use HZ43 as a calibration fiducial down to the C K-edge at 284 eV (43.6Å) where the other standard, the blazar PKS2155-304 becomes compromised by higher order throughput. The HZ43 model flux is normalised in the optical using high-precision HST photometry. Figs. 9 and 10 show the residuals between LETG+HRC-S observations and the fiducial model before and after modifications to the HRC-S quantum efficiency."
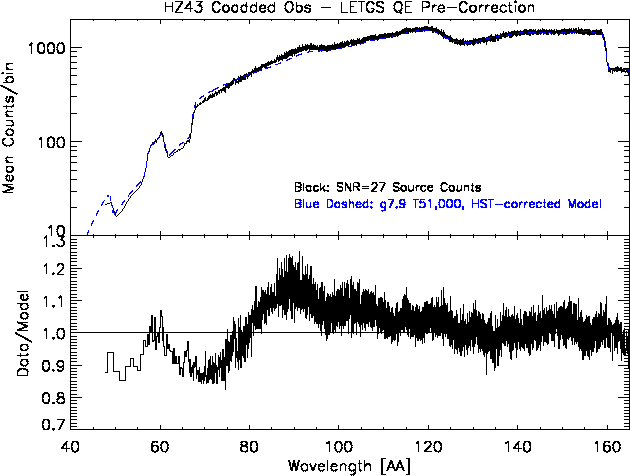
Fig. 9: The fit and residuals to co-added spectra for HZ43
taken since launch, with the previous HRC-S QE (version N0010) in CalDB.

Fig. 10: The fit and residuals to co-added spectra for HZ43
taken since launch, with the new HRC-S QE (version N0011).
E. PIMMS Cycle 14 Effective Areas
Plots, comparisons, and input calibrations used in the Cycle 14 PIMMS effective area files are given in the two public web pages below: