CalDB 4.9.4 Public Release Notes
Public Release Date: 16 DEC 2020
SDP Installation Date: TBD (UTC)
I. INTRODUCTION
CalDB 4.9.4 is an upgrade to the Chandra CalDB, which includes the following items:
- ACIS CONTAM N0014
- HRC-S QEU N0014
- LETG/HRC-S PI Region Filter N0002
- PIMMS Effective Areas for Proposal Cycle 23
- Backout of Recent HRC-I GTI_LIM File
For the CIAO 4.13 / CalDB 4.9.4 release notes see How CalDB 4.9.4 Affects Your Analysis.
II. SUMMARY OF CHANGES
A. ACIS CONTAM N0014
| Location: | $CALDB/data/chandra/contam/ |
| Filename: | acisD1999-08-13contamN0014.fits |
The ACIS OBF contamination layer continues to accumulate, and defies modeling in any systematic fashion into the current epoch. As shown in Fig. 1 below, the latest observations with ACIS-S/Gratings give an optical depth at C-K that is no longer properly tracked by the current CalDB CONTAM file N0013, and an update is required. Figure 2 below gives the Center-to-Edge ratios for the same data points and model as in Fig. 1.
Fig. 1: Contamination layer (for Carbon) at the center of ACIS-S versus time in years, showing the previous model (CONTM N0013) and the recent data from observations, at 0.66 keV. The model is fine up to 2018, but has begun to underestimate since. |
Fig. 2: The variation between the center to the edge for the carbon layer at 0.66 keV on ACIS-S. |
An updated model has been generated, to be released as CalDB CONTAM version N0014, which increases the predicted central contamination buildup on both ACIS-S and ACIS-I. In fact, it assumes a modified asymptotic variation with time for the three elemental optical depths, which limits the long-term contributions, but enhances the effect for 2018-2020 to fit the data. No change has been made to the center-to-edge ratio in the new model relative to the previous release (N0013). The new model has virtually ZERO EFFECT for the period before 2018.
See the ACIS QE CONTAM why page for basic information concerning ACIS contamination. For further details on the latest CONTAM N0014 effects on the ACIS aimpoint EAs, see the technical details below.
CIAO SCRIPTS/TOOLS AFFECTED:
See the CIAO scripts as follows:
THREADS AFFECTED:
For exposure-corrected imaging analysis with ACIS, see the threads:
- Single Chip ACIS Exposure Map and Exposure-corrected Image
- Multiple Chip ACIS Exposure Map and Exposure-corrected Image
For imaging spectroscopy with ACIS, see the threads:
- Extract Spectrum and Response Files for a Pointlike Source
- Extract Spectrum and Response Files for an Extended Source
- Extract Spectrum and Response Files for Multiple Sources
For grating spectroscopy with ACIS, see the threads:
B. HRC-S QEU N0014
| Location: | $CALDB/data/chandra/hrc/qeu/ |
| Filenames: | hrcsD1999-07-22qeuN0014.fits hrcsD2000-01-01qeuN0014.fits hrcsD2001-01-01qeuN0014.fits hrcsD2002-01-01qeuN0014.fits hrcsD2003-01-01qeuN0014.fits hrcsD2004-01-01qeuN0014.fits hrcsD2005-01-01qeuN0014.fits hrcsD2006-01-01qeuN0014.fits hrcsD2007-01-01qeuN0014.fits hrcsD2008-01-01qeuN0014.fits hrcsD2009-01-01qeuN0014.fits hrcsD2009-08-08qeuN0014.fits hrcsD2010-09-14qeuN0014.fits hrcsD2012-03-29qeuN0014.fits hrcsD2012-10-05qeuN0014.fits hrcsD2013-09-21qeuN0014.fits hrcsD2015-02-17qeuN0014.fits hrcsD2016-02-22qeuN0014.fits hrcsD2016-07-28qeuN0014.fits hrcsD2017-01-23qeuN0014.fits hrcsD2017-06-05qeuN0014.fits hrcsD2017-09-26qeuN0014.fits hrcsD2018-01-19qeuN0014.fits hrcsD2018-05-27qeuN0014.fits hrcsD2018-09-26qeuN0014.fits hrcsD2019-02-24qeuN0014.fits hrcsD2019-08-22qeuN0014.fits hrcsD2020-01-16qeuN0014.fits hrcsD2020-07-22qeuN0014.fits |
The HRC-S calibration team has generated and delivered an update to the HRC-S QEU library of time-displaced files to track the QE Uniformity across the detector's three plates. The new file set replaces the previous N0013 one, which is to be retired. The team uses its "carma" model routine of data taken from cosmic source HZ43, which is observed periodically. The most recent observation of HZ43 was taken in November 2020, which was after the anomaly and restart, with the switch to the B-side electronics for HRC. Hence the latest file in the QEU set includes any QE modifications generated by the electronics system swap.
The most significant change to come with the new datasets, is the addition of two new files effective 2020-01-16 and 2020-07-22, respectively, which continue the gradually decreasing trend in the HRC-S QEU with time.
According to Peter Ratzlaff, who generated the new data sets, there is as yet no significant change in the QEU trends with time due to the B-side electronics swap-in. However, the Cal team cautions that the future of the QE/QEU calibration for HRC-S is still uncertain.
See the HRC-S QE/QEU why page for information on the current HRC-S QE and QE Uniformity. See the technical details section below for illustrations and details of the derivation of these new QE Uniformity corrections.
SDP Pipeline / CIAO SCRIPTS/TOOLS AFFECTED:
The SDP pipeline procedure "tg_mk_responses" is used to generate single-source GARFs and GRMFs for HRC-S/LETG observations, to be ingested onto the archive. This procedure uses the HRC-S QEU library as loaded from the ARDLIB.
See the CIAO script fluximage, which uses mkinstmap.
THREADS AFFECTED:
For exposure-corrected imaging analysis with HRC-S, see the thread:
For grating spectroscopy with the LETG/HRC-S, see the thread:
C. LETG/HRC-S PI Region Filter N0002
| Location: | $CALDB/data/chandra/hrc/tgpimask2/ |
| Filename: | letgD1999-07-22pireg_tgmap_N0002.fits |
Due to a mutual oversight between the HRC-S Cal team, SDS, and the CalDB Manager, an update to the PI Region Filter file which was slated to be released with the new time-dependent gain maps (T_GMAPs) with CalDB 4.9.2 in July of 2020 was not delivered or included in the release. Because the existing (old) PI Region Filter file is not matched with the new T_GMAPs, some significant loss of real X-ray events is now occurring when that old filter is applied to the newly-calibrated data. This applies to LETG/HRC-S data being analyzed for the whole mission over the past six months. Hence the new PI region file, code-named TGPIMASK2 in CalDB, must be released immediately.
See the HRC-S T_GMAP and PI Filtering why page for more information. For some example applications of the new PI Region Filter, including comparisons to the old one, see the technical details below.
PIPELINES/TOOLS AFFECTED:
The CIAO script chandra_repro executes the PI filter step in its level 2 events list generation procedure. NOTE: An upgrade to chandra_repro, available in CIAO 4.13 and later versions, is required to apply the N0002 upgrade filter!
THREADS AFFECTED:
See the L2 events file regeneration threads for single and multiple sources:
D. PIMMS Effective Areas for Proposal Cycle 23
| Location: | $CALDB/data/chandra/pimms/acis/ |
| Filenames: | acisiD2020-11-17pimmsN0023.fits acisihetg0D2020-11-17pimmsN0023.fits acisiletg0D2020-11-17pimmsN0023.fits acissD2020-11-17pimmsN0023.fits acissheg1D2020-11-17pimmsN0023.fits acisshegmeg1D2020-11-17pimmsN0023.fits acisshetg0D2020-11-17pimmsN0023.fits acissleg1D2020-11-17pimmsN0023.fits acissletg0D2020-11-17pimmsN0023.fits acissmeg1D2020-11-17pimmsN0023.fits |
| Location: | $CALDB/data/chandra/pimms/hrc/ |
| Filenames: | hrciD2020-11-17pimmsN0023.fits hrciletg0D2020-11-17pimmsN0023.fits hrcsD2020-11-17pimmsN0023.fits hrcsleg1D2020-11-17pimmsN0023.fits hrcsleghiD2020-11-17pimmsN0023.fits hrcsletg0D2020-11-17pimmsN0023.fits |
The Chandra Cycle 23 PIMMS effective areas have been generated and loaded into the DS10.9.3 software for release with the Cycle 23 Call for Proposals. These files are maintained in CalDB for use by the DS when it is ready to load the PIMMS files, and convert them into the usual PIMMS ASCII format for implementation and distribution to HEASARC, annually. See the links below for information on this cycle's PIMMS EAs:
Cycle 23 PIMMS Effective Areas
Cycle 23 PIMMS Effective Area Public Information
![[NOTE]](../../imgs/note.png)
These files, despite their presence in CalDB, are NOT to be used for any sort of analysis of real Chanrda observation data!
PIPELINES/TOOLS AFFECTED:
E. Backout of Recent HRC-I GTI_LIM File
| Location: | $CALDB/data/chandra/hrc/gti_lim/ |
| Filename: | hrciD2020-09-28gtilimN0001.fits |
The file above is to be removed from the CalDB distribution and the index with the CalDB 4.9.4 release.
The above file was originally released in CalDB 4.9.3 in response to the HRC-I HV ramp-up proceedings of 29 September 2020. The above file would be called for only one OBS_ID (ER 62650, of ArLac), which was active during the HV ramp-up procedure. The HRC Cal team had originally requested that the HV GTI Limit be removed from processing with a manually-altered GTI_LIM file. The DS at that point, to maintain C-M protocol, elected to include the above so-altered file in the formal CalDB, rather than ingest data that had been processed with a manual intervention.
Upon further consideration, the DS would prefer to have only properly calibrated, restricted events published on the Chandra Data Archive, rather than those events that were taken out of the approriate control boundaries, and hence uncalibrated. Such would be the case if the subject GTI_LIM file were removed from CalDB, and the ordinary default GTI limits left to be applied.
PIPELINES/TOOLS AFFECTED:
HRC SDP Level 1 processing tool mtl_build_gti, first call only.
THREADS AFFECTED:
No CIAO threads are affected by this change.
III. TECHNICAL DETAILS
A. ACIS CONTAM N0014
The ACIS Calibrations Team found that merely extrapolating the current time dependences of the current model were not sufficient to account for declining fluxes in A1795 and the 1E0102 emission lines or the increasing optical depths observed in the LETG/ACIS spectra of Mk 421 (the Big Dither observations). The Big Dither data were used to update the models of the F-K and O-K edges in the contaminant initially. These time dependences were then used to fit for the C-K optical depth as a function of time using A1795 fits. The C-K time dependence was adjusted slightly at the center of the detector, as were the O-K and F-K models. For this initial model, the parametric forms were retained.
Upon comparison to the line fluxes of 1E0102 and A 1795, however, there were issues with fluxes for data before 2018 due to the changed model parameters. In order to avoid changing the contaminant optical depths farther back than 2018, a new parametric form was added to the time dependences at the center of the detector. These additions are negligible before 2018 and have an asymptotic form that limits their long-term contributions. The time dependences of the center-to-edge optical depths were not changed for O-K and F-K while the C-K spatial component was increased slightly.
Figures 3a&b (ACIS-I3 aimpoint) and 4a&b (ACIS-S3 aimpoint) give the effective areas for various years from the start through the current point of the mission, tracking mainly the effect of the ACIS OBS contaminant layer (in addition to the QEU variations with time in CalDB). The solid curves in the 3a and 4a plots are those calculated from the new CONTAM N0014 model, and the dashed curves used the previous CONTAM N0013 model. The "3b" and "4b" plots give the percent differences between the solid and dashed curves in the "N0013 minus N0014" sense. These plots indicate that there is virtually no difference between N0013 and N0014 models before 2018, and significant increase in the contamination effect with the new model after that date.
Fig. 3a: ACIS-I3 aimpoint effective areas versus photon energy for the mid-cycle (May 15th) dates of years 2000 (top curve), 2005, 2010, 2015, 2017, 2019, and 2022. The solid curves are derived using the new CONTAM N0014 model, the dashed ones from N0013. For 2000, 2005, 2010, 2015, and 2017, the solid and dashed curves appear to overlap. |

Fig. 3b: Percent difference plots for ACIS-I3 effective area curves from Fig 3a. |
||
Fig. 4a: ACIS-S3 aimpoint effective areas versus photon energy for the mid-cycle (May 15th) dates of years 2000 (top curve), 2005, 2010, 2015, 2017, 2019, and 2022. The solid curves are derived using the new CONTAM N0014 model, the dashed ones from N0013. As with ACIS-I3 above, for 2000, 2005, 2010, 2015, and 2017, the solid and dashed curves appear to overlap. |
Fig. 4b: Percent difference plots for ACIS-S3 effective area curves from Fig 4a. |
B. HRC-S QEU N0014
Since roughly the beginning of 2017, due to evolution of the HRC-S gain, (tg_lam,pi) background filtering has been rejecting an increasing proportion of valid longest-wavelength positive order events. Gain and PI filter recalibration are priorities and will be revisited soon. Meanwhile, until now the QEU has been calibrated to such filtered spectra, but beginning with the N0011 release, unfiltered spectra will be used instead.
This HRC-S QEU N0014 update incorporates the latest HZ 43 LETG calibration observations into the analysis. Using these most recent data, the post HV-change (2012-04 and later) wavelength-independent linear QE decline has been set to 2.55%/yr for 0th order, and set to 2.38%/yr for dispersed orders. Fig. 5 below also shows what additional empirical wavelength-dependent dispersed order corrections are required to match the HZ 43 fiducial WD model.
The final plot in Fig 5 below gives the results for the fit of the newest HRC-S/LETG data set, which was taken after the HRC power supply anomaly of August 2020, and the ensuing "B-side" power supply swap-in and HRC-S high-voltage reset, which occured in early October 2020. No significant change in the trend is yet in evidence resulting from the anomaly, shut-down, and restart of HRC-S.
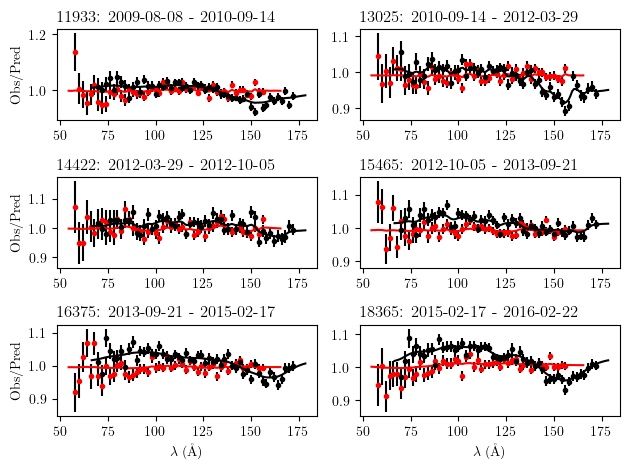
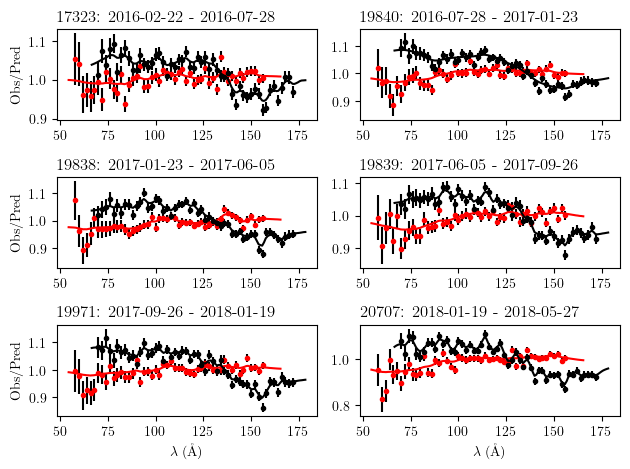
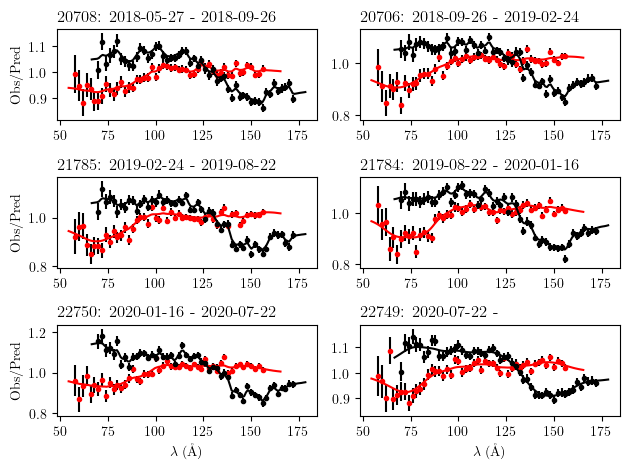
Fig. 5: The residual wavelength-dependent continuous autoregressive moving
average model correction for each epoch's QEU CalDB file, after the linear temporal
wavelength-independent QE decline has been applied.
Red curves are negative dispersed orders, black are positive orders.
C. LETG/HRC-S PI Region Filter N0002
The updated PI Region Filter application is illustrated in Figure 6 below for two (one early, one recent) cases of LETG/HRC-S observations, with the latest (N0003) T_GMAPs applied in each case. A comparison is made with no filter applied, and with the old N0001 filter applied as well.
It is clear that using the N0001 PI region filter with the latest T_GMAP results in the loss of significant (10%) of real events at some wavelengths, and this should be discontinued. However, chandra_repro in CIAO 4.12 with CalDB 4.9.2 or later applies the N0001 filter via hard-coding as well as using the latest T_GMAPs, and cannot be switched to the new N0002 PI region file without an upgrade. Hence users should install CIAO 4.13 and CalDB 4.9.4 or later versions to correct this situation!

Fig. 6: Results of a sample run on LETG/HRC-S Obs_IDs 19012 (NOVA SMC 2016, January 2017)
and 3722 (Lambda And, July 2002), wherein the spectrum with no PI background filtering (black/grey)
are plotted against that with the N0001 (old) PI filter applied (red/orange), and the same with the
new N0002 PI region filter applied (blue/purple).