[Last Change: 05 Apr 2011 (rev 5)]
Assessing the Chandra PSF Wings: An Estimate from Ground Calibration Data
T. J. Gaetz
This is a summary of a more complete memo which may be found here:
1up 2up
This memo has been superceded by
Fits to the HRMA on-orbit wings based on an observation of Her X-1
The memo describes an approach for using the ground calibration data to generate a model for the wings of the
Chandra point spread function are considered. An abbreviated version is presented here.
Introduction
The
Chandra High Resolution Mirror (HRMA) consists of 4 nested Wolter type I grazing incidence optics, each consisting of a paraboloidal mirror (P) and a hyperboloidal mirror (H). These are referred to as ``mirror pairs'' or ``shells'' interchangeably. For historical reasons, the shells are labeled 1, 3, 4, and 6 (from largest to smallest, respectively).
During the ground calibration at the X-ray Calibration Facility (XRCF), an extensive set of measurements was performed in order to validate the calibration raytrace model. The wing scan experiment was designed to map out the far wings of the Point Spread Function, or PSF, at angles about 1 mm and larger. Because of time constraints, only selected portions of the wings could be mapped in detail. This was accomplished by a series of horizontal (
Y) or vertical (
Z) pinhole scans through the PSF, using pinholes with nominal diameters of 1, 4, 10, 20, and 35 mm. Each scan was centered on the core of the PSF, and up to 3 points were sampled to either side (
i.e., -3
Dap, -2
Dap, -1
Dap, 0, +1
Dap, +2
Dap, +3
Dap).
Quadrant shutters were used to isolate quadrants of individual mirror pairs (or
shells) of the optic. Wing scans were performed at various energies for various quadrants of individual mirror pairs.
The far wings of the PSF result mainly from scattering by the optic surfaces, primarily scattering from microroughness. In principle dust scattering could also contribute, but any dust component was expected to be small because of the cleanliness of the
Chandra optics, and a special set of transverse wing scans at C-K alpha (0.277 keV) scattering from dust on the mirrors was not a significant component.
For grazing incidence reflection, scattering by microroughness is predominantly in-plane with only a small out-of-plane component. Consequently,
Y-scans were performed for the North and South quadrants, while
Z-scans were used for the Top and Bottom quadrants; a
Y-scan was also performed at C-K alpha for the shell 6 bottom quadrant in order to look for out-of-plane scattering resulting from any dust contamination.
In the ground calibration measurements for individual mirror quadrants, the HRMA was tilted in order to obtain a more nearly on-orbit incidence angle for the beam in order to obtain a better illumination of the optics. Because the X-ray sources were at finite distance, the beam diverged slightly; as a result, the effective illumination pattern on the projected surface of the P optic was not uniform (as would be expected for an ideal system with the source at infinite distance). In particular, this led to the ends of the optics (known from mirror metrology to be rougher than the middles of the optics) being less well illuminated.
This approach has worked very well, particularly for reproducing the overall image aberrations induced by the misalignments within the optics. Modeling the scattering has proven more problematic, though. The scattering function is based on detailed metrology of the roughness of the optics, with 5 to 11 axial zones per optic representing the variation in surface roughness along the optic. The middle of the optic (typically about 80%) is smoothest, with increasing roughness toward the edges. Mirror pair 1, the largest mirrors, also have the roughest surfaces. The scattering model is based on Kirchoff scalar diffraction theory. Unfortunately, the model tends to underpredict the wings of the PSF; refinements of the model and scattering function for the wings are under investigation. In the full memo (
1up 2up ) an interim model is developed for the HRMA wings profile based directly on the ground calibration data.
Full HRMA Surface Brightness Profiles (figures and tables)
The 2
W1 functions are related to the of the surface roughness properties of the mirrors; the functions may be scaled to allow evaluation of the wing surface brightness profiles at different energies. The full HRMA surface brightness profiles are evaluated for several energies and presented in the following figure:
Full HRMA Surface Brightness Profiles: Figures
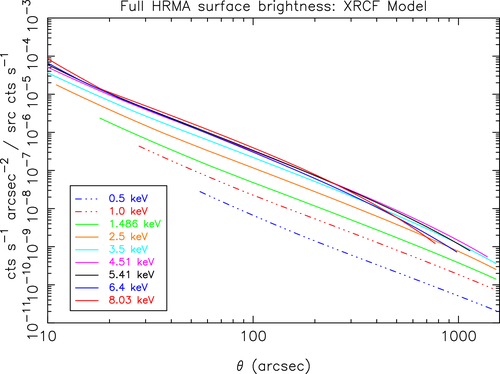
Surface brightness profile for the full HRMA, evaluated from the 2W1 fits to individual mirror pairs.
Full HRMA: Excluded Energy Profiles: Figures
The integrated surface brightness profile outside a radius theta (an “excluded energy fraction”) was evaluated from the above profiles; the results are presented in the following figure:
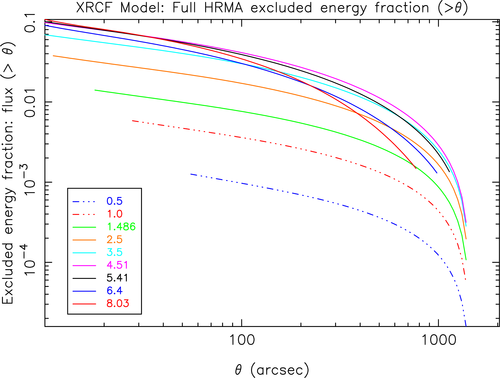
Flux fraction outside theta (excluded energy fraction). This is the integral of the profile outward from theta based on the surface brightness profiles evaluated from the 2W1 fits to individual mirror pairs.
Full HRMA Surface Brightness Profiles: ASCII tables
The data are also available as ASCII (RDB and HTML) tables:
Comparison to ground data: 2W1 for individual shells
The full-HRMA models were derived from fits to 2
W1 for individual shells:
Comparison to ground data: surface brightness profiles for individual shells
These 2
W1 fits can be scaled and combined to evaluate the surface brightness profile for individual mirror pair or the full HRMA (see the full memo (
1up 2up) for further details.) The reconstructed surface brightness profiles are compared to the ground calibration data here:
There remain systematics and uncertainties which need to be explored. In particular, the experimental configuration resulted in a nonuniform illumination of the HRMA and the roughest parts of the mirrors (the regions near the edges) are under-illuminated; consequently, the profiles are likely lower limits, particularly at large angles. The effect of the tilting of the HRMA in the ground test may also introduce a bias. These will be evaluated by comparing with on-orbit data, which are subject to different systematics. In particular, any source extent or scattering by intervening dust will tend to result in an overestimate of the true PSF wings.
Caveats
- Time limitations during ground calibration led to a sparse sampling for energies and mirror quadrants. Note that for energies higher than 4.51 keV, some mirror pairs were not measured at all. This is particularly a problem at 5.41 keV; the large outermost mirror pair still has significant on-axis effective area (about 13% of the total); by 6.4 keV, the mirror pair 1 contribution drops to about 1.4%. Although the shell 1 effective area at high energies is small compared to the inner shells, mirror pair 1 also has the roughest surface.
- Absolute scaling of the wings: The pinhole effective areas were normalized with absolutely calibrated detectors. However deriving the wing normalization is subject to systematic effects:
- A quadrant shutter scaling factor needs to be applied. Scattering from microroughness is mainly in-plane, so the quadrant shutters block about 1/2 of the scattered flux for off-axis pinholes, but only about 1/4 of the specular flux for the central (on-axis) pinhole position (that is, for the pinhole including the specular image). The pinhole correction factor is approximately 2, but it should be modeled. In this analysis, it is taken to be exactly 2.
- The optics were tilted to obtain a mean graze angle more nearly corresponding to the on-orbit graze angle for the given mirror pair. This improves the illumination pattern, but does not completely replicate the on-orbit conditions. The illumination pattern varies azimuthally around the quadrant, and the graze angle varies axially along the optic; these systematically affect the fluxes. Again, this correction should be modeled.
- The tilt of the optics (in order to improve the illumination pattern) results in the rough ends of the optics being undersampled relative to the smoother interior of the optic. It would thus be expected that the straightforward combination of the wing scan measurements could systematically underestimate the slope of the wings.
- The closed shutters (required to isolate particular mirror quadrants) result in significant vignetting by the quadrant shutter blades for far off-axis angles. This is particularly important for the middle two mirror pairs (3 and 4) because of their close spacing.
Suggestions for Future Work
- The 2W1 scaling allows the surface brightness profiles to be evaluated for different energies. For comparison with on-orbit data, the profile for a given energy band should be integrated over the source spectrum. This would take into account the variation of the profile with energy.
- The profiles can be improved using high quality on-orbit data for sources with low NH columns. Using the 2W1-based profiles as a baseline, the residuals can be parameterized as functions of energy and off-axis angle. The 2W1-based profiles can account for much of the energy and angular variation, with an empirical correction factor (probably energy dependent) accounting for the residuals. A deep calibration observation of a bright X-ray source is currently being scheduled. The improved count statistics will allow a better assessment of the far wings of the PSF.