[Last Change: 01 Mar 2011 (rev 1)]
Optical Axis Measurement
Maxim Markevitch (maxim@head-cfa.harvard.edu), 11 Oct 1999
This report describes a determination of the HRMA optical axis position using a raster scan of the star HR1099 with HRC-I. The position is determined by searching for a minimum of the PSF width. (There is ambiguity in defining "optical axis" for a non-ideal mirror, and one possibility is to define it as a direction of the narrowest PSF. This discussion is beyond the scope of the present report; once any definition is made, it can be related to the measured position of the PSF minimum using the HRMA model.) The present measurement is a refinement of a preliminary test performed earlier with ACIS-S (see
this memo). For a pre-flight simulation of this measurement, see
this memo.
Data analysis
The measurement was performed with
SIM_Z =91.866 mm (from the fits headers of L1 event files) which puts the aimpoint to one of the HRC-I corners. The source was observed at 33 different offsets within a 4' radius from the presumed optical axis position, with exposures of 500-1000 s each (OBSIDs 1120-1152).
To check for any aspect problems, each pointing was divided into 4 time intervals. A source centroid was calculated in each interval and compared to the centroid from the full exposure. This procedure detected an aspect drift in OBSID 1124 which was excluded from further analysis. In addition, time intervals in which the centroid was offset by more than 0.2" from the average were excluded (20 one-quarter exposure intervals in total, almost all of them either in the beginning or in the end of the observation).
The event files cleaned of aspect error intervals and also of events with
amp_sf=3 were used to make the aspect-uncorrected images in chip (u,v) coords and aspect-corrected images in sky coords. From the former, I determined the average position of the source in chip coords during the exposure, and from the latter, the width of the PSF. Note that for the present analysis, we are interested in the actual average position in chip coords weighted by the number of events (rather than, for example, the center of the dither pattern), because the PSF changes slightly over the dither pattern and we measure the average PSF width in each observation. The width of the PSF is characterized by the 50% and 90% encircled energy radii derived from a radial brightness profile centered on the source centroid.
Uncertainties of the 50% and 90% radii values were estimated by dividing the exposures for a representative set of pointings (1-2 for each off-axis angle) into 9 intervals, calculating the scatter of the PSF widths among these interval, and dividing this scatter by sqrt(9). Since not all clean exposures had the same length, for each observation, the above uncertainties for the correspondent off-axis angle were then normalized by 1/sqrt(N) where N is the number of photons. This resulted in the following dataset (errors are 1σ; radii are given in HRC pixels, 1 pixel=0.132"):
Table 1
| OBSID |
chipx |
chipy |
r(50%) |
r(90%) |
best-fit |
| |
(pixels) |
|
|
|
r(50%) |
r(90%) |
| 1120 |
3715.8 |
3831.5 |
3.500 ± 0.07 |
7.717 ± 0.21 |
3.47 |
7.88 |
| 1121 |
4174.7 |
3441.3 |
4.561 ± 0.14 |
9.745 ± 0.26 |
4.53 |
9.54 |
| 1122 |
4446.7 |
3160.3 |
5.930 ± 0.18 |
11.658 ± 0.30 |
6.14 |
12.05 |
| 1123 |
4807.0 |
2820.9 |
8.790 ± 0.30 |
16.092 ± 0.53 |
9.23 |
16.86 |
| 1125 |
3840.9 |
3340.1 |
4.047 ± 0.12 |
8.757 ± 0.24 |
4.23 |
9.06 |
| 1126 |
3836.3 |
2894.0 |
5.825 ± 0.20 |
11.306 ± 0.33 |
5.85 |
11.59 |
| 1127 |
3840.5 |
2342.7 |
9.312 ± 0.31 |
16.227 ± 0.54 |
9.17 |
16.78 |
| 1128 |
3835.0 |
1971.6 |
11.884 ± 0.40 |
21.417 ± 0.60 |
12.21 |
21.52 |
| 1129 |
3517.5 |
3460.2 |
3.937 ± 0.11 |
8.710 ± 0.21 |
3.94 |
8.61 |
| 1130 |
3153.5 |
3167.1 |
5.517 ± 0.16 |
10.806 ± 0.26 |
5.31 |
10.74 |
| 1131 |
2823.5 |
2853.7 |
7.656 ± 0.23 |
14.402 ± 0.40 |
7.67 |
14.44 |
| 1132 |
2516.0 |
2516.8 |
11.441 ± 0.31 |
19.865 ± 0.46 |
11.06 |
19.72 |
| 1133 |
3342.2 |
3864.4 |
3.864 ± 0.12 |
8.884 ± 0.22 |
3.71 |
8.26 |
| 1134 |
2900.7 |
3802.9 |
4.846 ± 0.15 |
9.663 ± 0.24 |
4.88 |
10.07 |
| 1135 |
2467.8 |
3805.4 |
7.153 ± 0.19 |
12.987 ± 0.33 |
6.90 |
13.24 |
| 1136 |
1986.6 |
3814.8 |
10.550 ± 0.36 |
18.163 ± 0.54 |
10.20 |
18.38 |
| 1137 |
3516.3 |
4096.2 |
3.551 ± 0.11 |
7.984 ± 0.21 |
3.62 |
8.12 |
| 1138 |
3151.7 |
4442.6 |
4.853 ± 0.17 |
9.880 ± 0.27 |
4.84 |
10.02 |
| 1139 |
2833.1 |
4763.3 |
6.865 ± 0.22 |
13.443 ± 0.38 |
6.97 |
13.34 |
| 1140 |
2514.6 |
5084.5 |
9.890 ± 0.38 |
18.537 ± 0.57 |
10.07 |
18.18 |
| 1141 |
3837.2 |
4230.7 |
3.785 ± 0.13 |
8.382 ± 0.24 |
3.82 |
8.42 |
| 1142 |
3789.9 |
4715.4 |
5.073 ± 0.19 |
10.401 ± 0.31 |
5.15 |
10.50 |
| 1143 |
3841.5 |
5036.2 |
6.536 ± 0.40 |
12.574 ± 0.70 |
6.70 |
12.92 |
| 1144 |
3837.4 |
5577.3 |
9.702 ± 0.61 |
18.548 ± 0.91 |
10.37 |
18.65 |
| 1145 |
4157.1 |
4101.1 |
3.803 ± 0.14 |
8.487 ± 0.27 |
4.14 |
8.93 |
| 1146 |
4435.4 |
4427.7 |
5.127 ± 0.21 |
10.576 ± 0.34 |
5.57 |
11.16 |
| 1147 |
4757.5 |
4757.2 |
7.996 ± 0.21 |
15.437 ± 0.37 |
8.11 |
15.12 |
| 1148 |
5126.1 |
5040.4 |
11.663 ± 0.44 |
21.883 ± 0.66 |
11.71 |
20.75 |
| 1149 |
4245.3 |
3859.5 |
4.386 ± 0.08 |
9.516 ± 0.15 |
4.26 |
9.10 |
| 1150 |
4687.1 |
3854.7 |
6.058 ± 0.13 |
11.740 ± 0.22 |
5.93 |
11.72 |
| 1151 |
5142.4 |
3794.3 |
8.893 ± 0.17 |
16.284 ± 0.30 |
8.65 |
15.97 |
| 1152 |
5588.6 |
3795.9 |
12.077 ± 0.32 |
21.787 ± 0.48 |
12.26 |
21.59 |
The above data (PSF width as a function of two chip coordinates) were fit by a symmetric quadratic function. Uncertainties of the best-fit position of the function minimum were estimated by Monte-Carlo simulations, varying the data values by their uncertainties. The best-fit values for the fit to the 50% and 90% radii, including the 90% confidence intervals, are given in Table 2:
Table 2
| |
min position |
min value |
χ2 |
χ2ν |
| |
chipx chipy (±90%) |
|
|
|
| 50% |
3678±15 3893±18 |
0.46" |
31.5 |
1.13 |
| 90% |
3658±16 3870±20 |
1.04" |
38.5 |
1.38 |
| 50% |
3668 3882 (fixed) |
0.46" |
33.6 |
1.20 |
| 90% |
3668 3882 (fixed) |
1.04" |
40.4 |
1.44 |
The best-fit positions from the 50% and 90% radius datasets are within each other's 95% confidence intervals. Although these are not exactly independent datasets, I take their average as the final result (keeping the same confidence interval). The bottom two lines in Table 2 give χ
2 for the fits with positions fixed at their average values, and the last 2 columns in Table 1 give the respective model values for each data point.
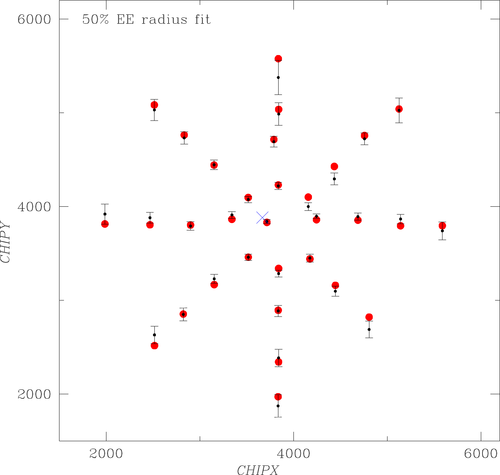
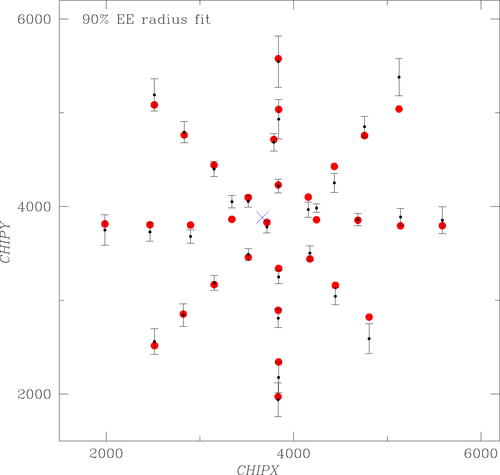
In the two (rather nonintuitive) figures below, I attempt to show the residual deviations in the fits with the fixed average position (bottom lines in Table 2). Axes in the plots show chip coordinates in the HRC-I detector. Big red dots show the weighted average positions of each pointing. The black data points with error bars (1σ) deviate from these red points in the vertical direction by the amount of the deviation from the best-fit parabolic model (the scale is arbitrary but the same for all points). The blue cross is the average minimum position. One can see that the fits are reasonably good, without any obvious systematic deviations.
A couple of tests, for example, excluding the central pointing (whose offset may seem suspiciously coincident with the best-fit axis position) or excluding the data point at the end of the upper-left diagonal, do not change the best-fit positions significantly. A close examination of the residuals shows that somewhat high χ
2 values are dominated by a couple of data points with the smallest errors. Our formal statistical errors do not attempt to account for any systematic uncertainties, while it is probably fair to say that we cannot measure the PSF width to better than, say, 1/3 of the detector pixel. If we replace all formal errors that are smaller than 0.3 pixels in our dataset by 0.3 pixels and rerun the fit, we get practically no change in the fitted parameters while χ
2 becomes acceptable. To conclude, there seems to be no problems from the data analysis standpoint, and the resulting optical axis position in the HRC-I chip coordinates is at
CHIPX = 3668 ±16 or +-2.1" (90%)
CHIPY = 3882 ±19 or ±2.5"
For SIM_Z = 91.866 mm            (this is NOT the HRC-I default aimpoint)
Conversion to other detectors
In turns out that to convert this result accurately to the default
SIM_Z value for HRC-I as well as to all other instrument's coordinate systems, we have to wait until we complete all coordinate calibrations and the results are ingested into PIXLIB. However, I can convert this position relatively accurately to the default (central) position in HRC-I at
SIM_Z 126.983 mm assuming that the detector is rotated exactly 45 deg w.r.t. SIM =z axis and the pixel size is 6.429 microns:
CHIPX     = 7530
CHIPY     = 7744
For SIM_Z = 126.983 mm      (this is the HRC-I central aimpoint)
An uncertainty of 0.1 deg in the detector rotation adds a 10 pixel uncertainty to the above values.
Tom Aldcroft has pointed out that without waiting for a PIXLIB update, it is possible to convert approximately the measured position to other instruments' coordinates using the detector positions of the sources observed at the zero offset (0,0). This is based on the assumption that the big ~90" coordinate error seen in the early observations was entirely due to the aspect camera misalignment. That misalignment, same for all 4 instruments, is currently being applied to all source coordinates for pointing the telescope. Thus the offset of the optical axis from the position of a source with the commanded offset (0,0) for each instrument should be the same. The above assumption may not be exactly true, and in addition, the telescope pointing accuracy is finite (the requirement is ±12" 1σ, although it appears to be better than that), so this conversion introduces an additional uncertainty of order 10".
To do such approximate conversion, first I need to find the average chip coordinates at which the source with zero offset lands in each of the 4 detectors. For each instrument, I selected 2 or more observations of point sources at zero offset and default
SIM_Z that were long enough to determine the center of the dither pattern in chip coords, and that were separated by maneuvers to average over pointing inaccuracy. They are listed in Table 3:
Table 3
   OBSID   chipx chipy   comments
ACIS-I:   1278    966  955   PKS0312, focus
    469    967  957   PKS0312, verify focus

     average    966  956
ACIS-S:   1055    267  516   PKS0637, crude opt axis
   1235    254  492   Capella, HETG focus
    474    266  512   PKS0637, plate focus
   1252    267  507   HR1099, HETG

     average    263  507
HRC-I:   1211   7704 7664   HR1099 verify focus, no dither
   1296   7652 7726   LMC X-1, shutter focus
   1295   7652 7688   Ar Lac, plate focus

     average   7667 7693
HRC-S:   1166   2116 8840   Capella, no grat
       62436   2158 8848   LMC X-1, shutter focus

     average   2137 8844
The optical axis position determined for HRC-I is offset from the average "aimpoint" in Table 3 by
dy=-17.5", dz=8.0". Applying this offset to the other detectors, we obtain the following positions:
Table 4
| detector |
SIM_Z |
Opt. axis position |
| |
mm |
chipx |
chipy |
| ACIS-I |
-233.587 |
983 |
992 |
| ACIS-S |
-190.120 |
228 |
523 |
| HRC-I |
126.983 |
7530 |
7744 |
| HRC-S |
250.466 |
2199 |
8976 |
It is worth noticing that the resulting ACIS-S axis position is only 7" away from our previous crude measurement that was derived directly in ACIS-S and was (238, 532) if one averaged the 50% and 90% radii fits as it is done here. Given all the uncertainties, the results for instruments other than HRC-I are accurate only to about 10-15" (while for HRC-I it is better than 5"); a more accurate conversion has to wait for a PIXLIB update.

 A couple of tests, for example, excluding the central pointing (whose offset may seem suspiciously coincident with the best-fit axis position) or excluding the data point at the end of the upper-left diagonal, do not change the best-fit positions significantly. A close examination of the residuals shows that somewhat high χ2 values are dominated by a couple of data points with the smallest errors. Our formal statistical errors do not attempt to account for any systematic uncertainties, while it is probably fair to say that we cannot measure the PSF width to better than, say, 1/3 of the detector pixel. If we replace all formal errors that are smaller than 0.3 pixels in our dataset by 0.3 pixels and rerun the fit, we get practically no change in the fitted parameters while χ2 becomes acceptable. To conclude, there seems to be no problems from the data analysis standpoint, and the resulting optical axis position in the HRC-I chip coordinates is at
