
[Last Change: 01 Mar 2011 (rev 3)]
Background was evaluated from region regions on ACIS-S3 outside the 280 arcsec radius region centered on the source (see background region file).
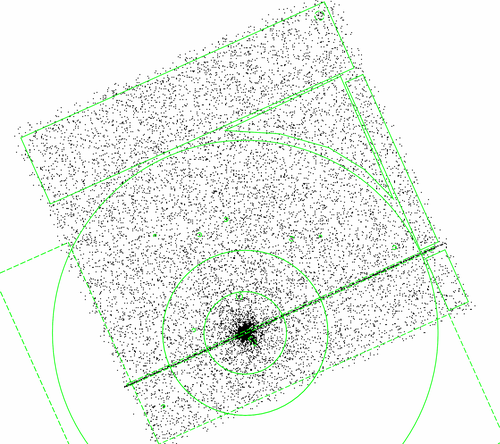
Finally, a pair of long, narrow regions (10 arcsec width) were used to extract counts from the transfer smear far from the direct image of 3C273 ( transfer streak region file).
The regions are indicated below:
 The
The
HRMA PSF Wings (preliminary)
Introduction
The far wings of the point spread function (PSF) result mainly from scattering from the microroughness on the X-ray optic surfaces. Observations of cosmic sources can only provide upper limits for the wings of the PSF; any source extent (e.g., intrinsic extent, or dust scattering halos) can enhance the apparent wings. This report describes an estimate of the HRMA PSF wing profile based on an on-orbit observation of 3C273 (OBSID 1712). The N_(H I) column to 3C273 is relatively small, about 1.69e20 cm^-2 (Lockman and Savage 1995, ApJS 97, 1), reducing the possible contribution of dust scattering wings. For the present, we assume that 3C273 is intrinsically a point source in X-rays, and that the differences between the wings in the raytrace model and the wings extracted from the observation represent a deficiency in the model. Further work is being undertaken to examine other point-like sources, which will help to clarify the degree to which the object is a point source. The PSF's in the PSF library (distributed as part of the Chandra CALDB) were generated using the SAOSAC raytrace model; the comparison of the raytrace model with sky data thus clarifies the applicability and deficiencies of the model PSFs. OBSID 1712 is a calibration observation using ACIS-S as the detector. The grating insertion failed, resulting in a long exposure of 3C273 without the grating (27.4 ks; approximately 22 ks was left after filtering out high countrate intervals). A more detailed memo describing the analysis is in preparation.Data processing and analysis
On-orbit data : Eliminating Times with High Count Rates
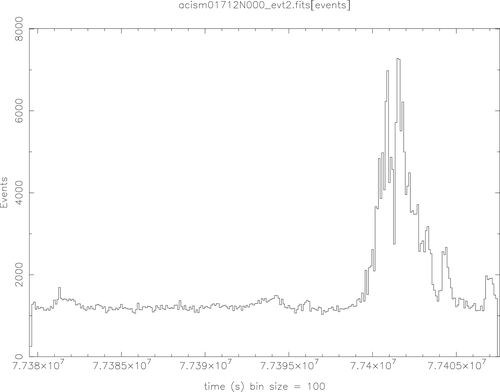
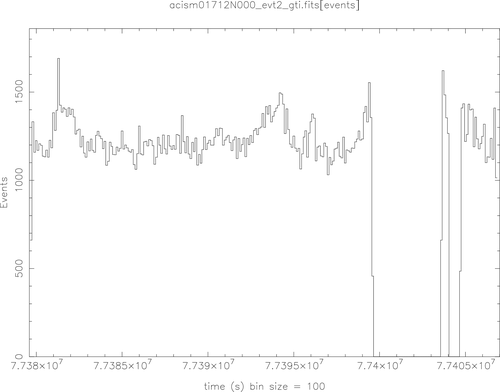
The total exposure was 27.4 ks. The light curve indicates a period of increased count rate, though. A Good Time Interval (GTI) was evaluated by including only those periods with count rates within a factor of 1.6 of the median count rate. This GTI was applied to filter the data set. The resulting exposure time was 22.1 ks. Raw light curve
GTI-filtered light curve (high count rate intervals removed)
SAOSAC Raytrace Model
We compare the on-orbit data for 3C273 with a detailed raytrace model based on the calibration data. The raytrace configuration was performed using the trace-nest3 script to trace the full HRMA, using the orbit_XRCF+tilts_02b configuration file. This configuration incorporates the new (20001117) version of the optical constants, and a slightly tweaked version of the scattering tables (repairing a slight glitch in the table covering the middle section of the P1 optic). The resulting rays were postprocessed using MARX 3.0.1 (sao-p1) to project the rays to the detector surface, and to apply the detector model. The model includes a treatment of the ACIS transfer smear, but does not include a pileup calculation or the effects of dither.Wing Profile Extraction
The profiles were extracted using the funtools routine funcnts. Both the sky data and the raytrace model data were processed in the same way. A set of concentric annuli were constructed centered on the source and extending out to 280 arcsec and with annular widths ranging from 2 arcsec to 8 arcsec (see Table 1). Rectangular exclusion regions were used to clip the annuli to lie within the active area of the ACIS-S3 detector; the jet and other obvious sources were also excluded (see extraction region file). In addition, a narrow (8 pixel wide) region centered on the transfer streak was excised: far from the core, out-of-time events from the core of the PSF can dominate over the wings.| Rmin | Rmax | Δ R |
|---|---|---|
| (arcsec) | (arcsec) | (arcsec) |
| 0 | 60 | 2 |
| 60 | 120 | 4 |
| 120 | 280 | 8 |
Schematic of extraction
funcnts output were processed to evaluate background-subtracted radial profiles. In order to facilitate comparison of the profiles, the individual profiles were normalized by dividing by the source count rate (integrated over the energy band of interest). The normalization count rate is intended to be the sum of the PSF out to a radius of 1 arcmin. However, 3C273 is heavily piled up in the core, so an indirect method of estimating the count rate is needed; the data from the transfer smear was used to estimate the count rate for 3C273 (and also for the SAOSAC/MARX simulated event list). A correction factor needs to be applied to correct for the difference between the PSF captured by the transfer smear estimate and the PSF which would be captured by the 1 arcmin radius reference aperture (in the absence of pileup). This correction factor depends on the shape of the PSF wings, so in principle it needs to be assessed iteratively. Currently this correction factor is set to unity, but this will be addressed more fully in an update.
Table 2 lists estimates for the uncertainties in the total count rates based on the statistical uncertainties in the count rates in the ACIS transfer streak. The count rate estimates for the raytraces are about a factor of two less uncertain than for the actual observation, again based only on counting statistics.
In order to obtain a qualitative indication of how well the transfer-streak based estimate of the total source rate compares to the source rate which would be obtained by summing over the profile, we constructed profiles for the raytrace data but including the transfer streak data, approximating what the detector would detect in the absence of detector pileup. The source count rate within 1 arcmin is then estimated by directly summing over the profile; these estimates agreed well with the transfer streak estimates (about 5% disagreement for 5-8 keV [worst case]). However, this does not include the uncertainty introduced by neglecting the aperture correction factor.
| Energy range | (Δ S) / S | uncertainty |
|---|---|---|
| (keV) | (dex) | |
| All | 0.017 | 0.007 |
| 0.2-2.0 | 0.016 | 0.007 |
| 2.0-5.0 | 0.040 | 0.017 |
| 5.0-8.0 | 0.149 | 0.060 |
Results
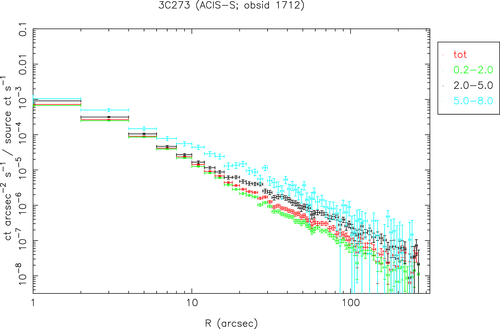
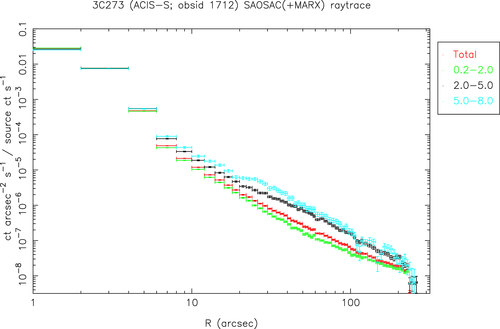
The event lists were filtered on energy for three broad energy bands: 0.2-2.0 keV, 2.0-5.0 keV, and 5.0-8.0 keV. The normalized profiles were evaluated and the results are plotted in the figure below, in addition to the profile for the unfiltered dataset. The horizontal error bars indicate the widths of the annular bins, and the vertical error bars indicate the statistical errors for each bin. The normalization error (i.e. error on the total count rate) is not added into the other errors; this does not affect the shape of the curves, but amounts to an uncertainty in the vertical positioning of the curves. The points in red are the profiles for the unfiltered data set; green is the 0.2-2.0 keV band, white is the 2.0-5.0 keV band, and blue is the 5.0-8.0 keV band. Note that the profiles are invalid inside about 10 arcsec; the source is heavily piled up in the data. In addition, a region 8 pixels wide covering the core of the transfer streak has been excluded; this produces a significant error near the core, affecting the profiles based on sky data and also the profiles based on the SAOSAC raytrace data. The wing profile is tightest for low energies, and the wings become more prominent at the higher energies, consistent with the expected behavior of mirror scattering. An SAOSAC raytrace simulation was performed using an absorbed broken powerlaw spectrum for the 3C273 spectrum based on the Chandra HETG/ACIS-S data ("The high resolution Chandra X-ray spectrum of 3C273", Fruscione et al. , HEAD2000). The SAOSAC raytrace model incorporates a detailed model of the HRMA performance. The resulting rays were postprocessed by MARX to project to the detector and apply the detector model. The resulting event lists were processed in the same way as the sky data (with suitable adjustments to the centers of the extraction annuli, the clipping region, and the and transfer streak extraction region). The results are plotted below using the same conventions as for the profiles derived from the sky data. In comparing the two sets of profiles, note that the raytrace-based profiles peak considerably higher for bins inside 10 arcsec. The raytrace simulation does not include the effects of pileup.3C273 Obsid 1712: profiles for energy ranges
SAOSAC simulation: profiles for energy ranges
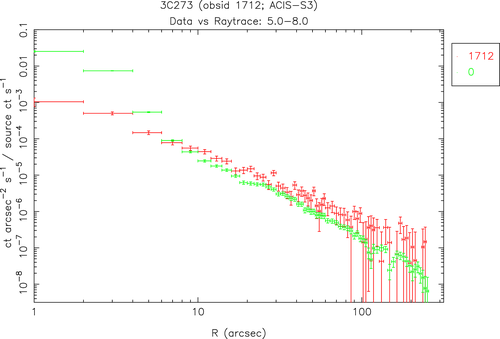
Observations vs Simulations
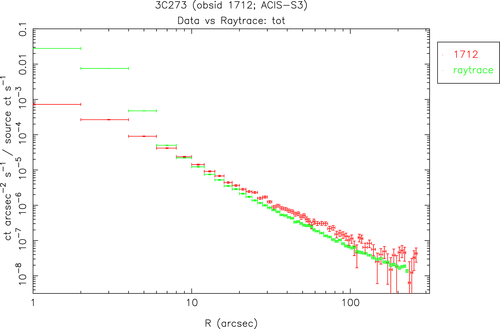
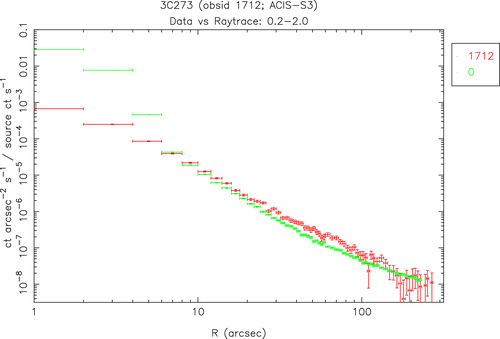
In the following, the profiles derived from the on-orbit 3C273 data are compared directly to the raytrace simulations. The effect of pileup is evident in comparing the green points (raytrace, no pileup) with the data (red, OBSID 1712 data). It is also evident that the present mirror scattering model under-predicts the actual scattering outside about 10 arcsec. (Inside 10 arcsec, it is difficult to assess the situation because of pileup in the sky data. Observations with less pileup will help to extend the comparison.)All energies
0.2-2.0 keV
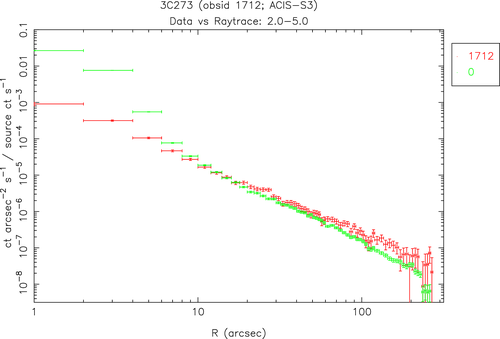
2.0-5.0 keV
5.0-8.0 keV
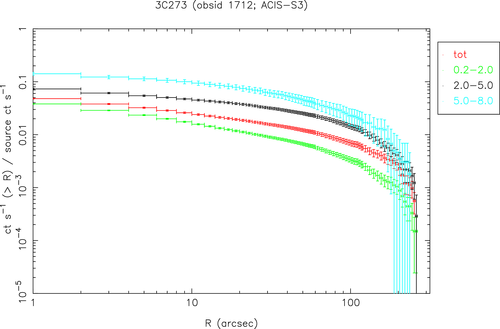
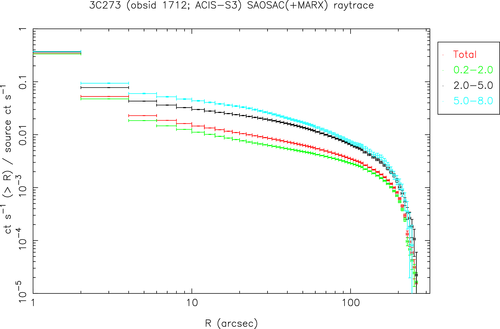
PSF fraction outside radius R
In the next figures, an estimate of the fraction of the PSF outside a given radius is plotted. The estimates are made by summing the profile outward from the given radius, ignoring bins with negative values. Again, the profiles are invalid inside about 10 arcsec.Observation
SAOSAC simulation
Comments
- From these estimates of the PSF wings, it is evident that for distances in excess of about 10 arcsec from the source, the calibration model for the wings underestimates the data. Improved models (with better scattering tables) are currently under investigation.
- Because of detector pileup, profiles inside about 10 arcsec are not well constrained for these data. Data from sources with less pileup will allow us to extend the profiles further inward.
- The power scattered into the wings can be significant, particularly at high energies.
Plans
Assessing the wings of the PSF is an iterative process. Examining a variety of sources will help to assess the contributions of source extent or X-ray dust scattering halos. The PSF profile interior to 10 arcsec (limited here by detector pileup) can be assessed by examining fainter sources which are not so heavily piled up. Work in progress includes extraction wing profiles from other sources, including:- LMC-X1 [ACIS-I] - extended at low energies, though
- AR Lac [HRC-I] - no pileup, allowing the core and near wings to be probed. Soft spectrum, though.
- Capella [HRC-S] - deep exposure (failure of grating to insert), but a soft source, and a high background rate.
Caveats
- Observations of cosmic sources can only provide upper limits for the wings of the PSF; any source extent (e.g., intrinsic extent, or dust scattering halos) can enhance the apparent wings.
- The profiles extracted from the sky data are invalid inside about 10 arcsec; the source is heavily piled up in the data.
- The aperture correction factor accounting for the difference in captured PSF between the transfer streak estimate and the 1 arcmin reference aperture has not been applied yet. The correction depends on the shape of the PSF wings, so it will need to be calculated iteratively.
- A region 8 pixels wide covering the core of the transfer streak has been excluded from both the sky data and from the SAOSAC raytrace data. This produces a significant error near the core, affecting the profiles based on sky data and also the profiles based on the SAOSAC raytrace data. For this reason (in addition to detector pileup), the profiles become increasingly unreliable for radii interior to 10 arcsec.
- No vignetting corrections have been applied yet. The background is assumed here to be primarily particle background which is not significantly vignetted by the HRMA.
- In the SAOSAC raytrace model, an approximate (absorbed powerlaw) spectrum was used; the models will be redone with a more accurate spectrum based on the HETG+LETG data for this source.
- The detector QE maps have not been applied yet.
