CalDB 4.6.3 Public Release Notes
Public Release Date: 29 AUG 2014
SDP Installation Date: 2014-09-02T18:00:00 (UTC)
I. INTRODUCTION
CalDB 4.6.3 is an upgrade to the Chandra CalDB, which includes the following items:
- ACIS T_GAIN Epoch 58
- HRC-S QEU files for 2014 - 2020
- OLD HRC-S QEUs RETIRED
- HRC-I 2006 GMAPs Validity Dates Changes
For the CIAO 4.6.1 / CalDB 4.6.3 release notes see How CalDB 4.6.3 Affects Your Analysis.
II. SUMMARY OF CHANGES
A. ACIS T_GAIN Epoch 58
| Location: | $CALDB/data/chandra/acis/t_gain/ |
| Filenames: | acisD2014-02-01t_gainN0005.fits acisD2014-02-01t_gainN0006.fits acisD2014-05-01t_gainN0002.fits acisD2014-05-01t_gain_biN0002.fits |
The periodic ACIS T_GAIN correction upgrade for May-July 2014 (Epoch 58) has been released. The corrections are at nominal/expected levels of less than 2% of the energy value. This upgrade as usual affects observation data taken over the two most recent T_GAIN Epochs (58 and 57), and so would update PHAs for OBS_IDs taken since 01 Feb 2014. Users with such datasets are encouraged to revalidate their analysis results after reprocessing their data with the upgraded CalDB files. For specific details of the new calibrations in this release, see the technical details section below.
See the ACIS T_GAIN why page for more information.
PIPELINES/TOOLS AFFECTED:
DS and CIAO level 1 (re)processing tool acis_process_events
Also: CIAO reprocessing script chandra_repro
THREADS AFFECTED:
Reprocessing Data to Create a New L2 Events File
B. HRC-S QEU files for 2014 - 2020
| Location: | $CALDB/data/chandra/hrc/qeu/ |
| Filenames: | hrcsD2014-01-01qeuN0006.fits hrcsD2015-01-01qeuN0006.fits hrcsD2016-01-01qeuN0006.fits hrcsD2017-01-01qeuN0006.fits hrcsD2018-01-01qeuN0006.fits hrcsD2019-01-01qeuN0006.fits hrcsD2020-01-01qeuN0006.fits |
The HRC-S array has shown a consistent ~0.5% per year drop in the net QE across the full first-order spectrum, since the launch date. A somewhat steeper reduction with time is seen in the zeroth order. Addressing these circumstances in advance, the LETGS calibration team has released seven new predictive HRC-S QEU files for the CalDB. The 2014 file in particular addresses an existing error in the CalDB, wherein the wrong QEU file has been being selected for all 2014 HRC-S observations. The problem has been identified and described here. CalDB 4.6.3 eliminates the problems described on that page completely.
PIPELINES/TOOLS AFFECTED:
CIAO script mktgresp for 2014 LETGS OBD_IDs.
CIAO script fullgarf.
THREADS AFFECTED:
C. OLD HRC-S QEUs RETIRED
| Location: | $CALDB/data/chandra/hrc/qeu/ |
| Filenames: | hrcsD1999-07-22qeuN0005.fits hrcsD1999-07-22qeuN0004.fits |
The above files are outdated, having been kept in the CalDB for a number of years now since the latest time-dependent HRC-S QEUs have been available. It has also been discovered that since CIAO 4.4 and CalDB 4.4.0 were released in December 2012 that the N0005 file above has been being selected instead of the appropriate 1999-01-01 QEU file, for all 1999 OBS_IDs using HRC-S. This occurs because of an error in the HRC branch index. Removal of both of these files from CalDB removes the problem for the 1999 HRC-S observations. The issue has been described here. As with the 2014 HRC-S observations described above, CalDB 4.6.3 fixes this issue.
PIPELINES/TOOLS AFFECTED:
CIAO script mktgresp for 1999 LETGS OBD_IDs.
CIAO script fullgarf.
THREADS AFFECTED:
D. HRC-I 2006 GMAPs Validity Dates Changes
| Location: | $CALDB/data/chandra/hrc/gmap/ |
| Filenames: | hrciD2006-09-06gainN0002.fits hrciD2006-09-20sampgainN0001.fits |
The two files above have separate Calibration Validity Start Dates and Times (CVSD0001, CVST0001 header keywords). At the time of the release of the SUMAMPS-based gain maps ("sampgain" in the filename), the intention was to replace the PHA-based PI settings with SAMP-based PIs for all cases. However, with the release of CIAO 4.4 in December 2012 and DS 10.0 in October 2012, the LIBCALDB4 software was updated with a modified time-dependence selection algorithm, which has exposed the hrciD2006-09-06gainN0002.fits to default selection in the CalDB tool "calquiz" for the dates 2006-09-06T12:00:00 through 2006-09-20T12:00:00. A single HRC-I OBS_ID is affected, specifically 6466 (Vega).
To prevent this from happening in future reprocessing (with CIAO or the DS), we have agreed to change the validity start date and time of the SAMPGAIN file hrciD2006-09-20sampgainN0001.fits, to coincide with that of the above PHA-based gain file. This allows the retention of both files in the CalDB and the index. Users of the older datasets may then choose to employ the PHA-based gain files by manual selection in hrc_process_events.
Additionally, the CAL_QUAL value in the header of hrciD2006-09-06gainN0002.fits has been reset from value 5 (BAD) to value (4) (Deprecated). This ensures that the file will continue to be retained in CalDB.
PIPELINES/TOOLS AFFECTED:
HRC L1 pipeline, CIAO reprocessing tool hrc_process_events
CIAO reprocessing script chandra_repro
THREADS AFFECTED:
Reprocessing Data to Create a New Level=2 Event File
III. TECHNICAL DETAILS
A. ACIS T_GAIN Epoch 58
The ACIS time-dependent gain corrections (T_GAIN) have recently been updated for current changes from the previous T_GAIN epoch, specifically Epoch 58, which was May-July 2014. With the addition of these new corrections, derived from ACIS External Cal Source (ECS) data taken during radiation zone passes, the CalDB files extending from Feb-Apr 2014 (i.e. Epoch 57) have been finalized, and new non-interpolating T_GAIN files are now implemented for Epoch 58.
The magnitudes (in eV) of the new gain corrections, versus photon energy, are given in Figs. 1-3 below. The corrections are of the usual order in magnitude, specifically less than 2.0% of the photon energy value. Fig. 1 below gives the corrections for the ACIS-I aimpoint on chip ACIS-3, for the CTI-corrected case, which is the only one applicable to FI chips. Figure 2 gives the corrections for the ACIS-S aimpoint on ACIS-7, for the case where the BI chips are CTI-corrected. Finally Fig. 3 gives the corrections for ACIS-7 for NON-CTI-corrected BI chips. These would be relevant to GRADED DATAMODE observations with ACIS-S, for example.
Fig. 1: ACIS-I3 aimpoint T_GAIN corrections in eV versus photon energy.
Fig. 2: ACIS-S3 CTI-corrected aimpoint T_GAIN corrections in eV versus photon energy.
Fig. 3: ACIS-S3 non-CTI-corrected aimpoint T_GAIN corrections in eV versus photon energy.
Long term trends for chips I3 and S3 are plotted below in Figure 4a and b, through Epoch 58, the latest release. The chip locations for these plots are given in the respective labels above the plots. Note that the locations are not the aimpoint positions, as with Figs. 1-3 above, but are near the centers of each chip.

|
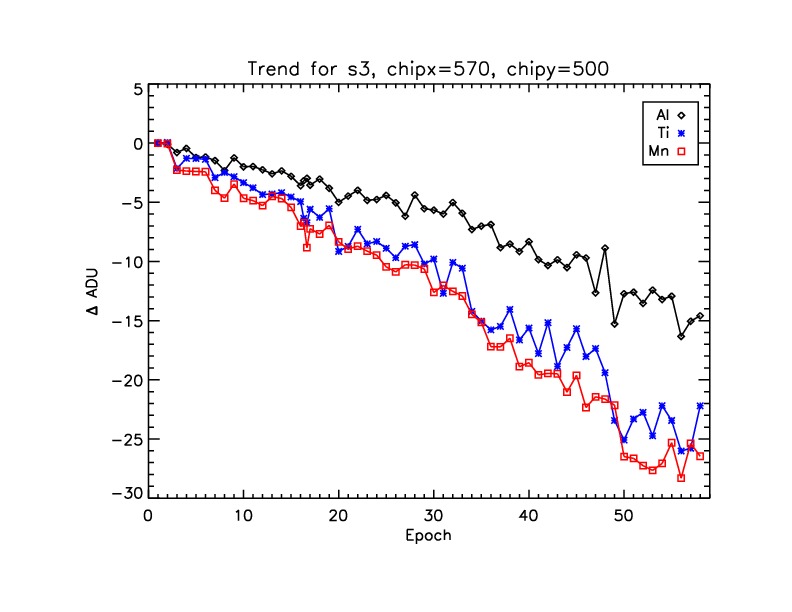
|
| Figs 4a and 4b: Long term gain trends for specific ECS line energies from Epoch 1 to Epoch 58 inclusive, and for the positions on the respective chips given in the figure labels. (Click on images to expand the plots.) | |
B. HRC-S QEU files for 2014 - 2020
The new HRC-S QEU calibrations through the year 2020 are extensions of the same calibrations derived for the existing 1999-2013 datasets. The time-dependent QE calibration was originally based on seventeen HRC-S/LETG monitoring observations of HZ43 and four supplemental observations of Sirius B. Both of these white dwarfs should be completely stable in X-ray output, and so provide standard candles for LETGS monitoring.
Over the length of the Chandra mission, the LETGS Calibration team's analysis of these sources shows a linear QE decline of roughly 0.5%/year. The 0th-order (aimpoint) region of the detector shows a slightly steeper decline.

Fig. 5: Zeroth (top) and first order QEU corrections were derived from the relative flux values plotted
above. The corrections give a level flux versus time for the calibration sources.
In order to fully account for the two distinct rates of decline, the HRC-S QEU file, which contains QE variations based on chip location, was modified into an annual time-dependent list of files. For an observation obtained in a given year, CIAO employs the QEU map appropriate for that year. Files are indexed to mid-year, so that the error in QE incurred by the yearly digitization amounts to no more than 0.25% or so.
Two additonal notes:
- Decline correction in CALDB archive is centered on the year 2008. Hence Figures 6 and 8 below give the 1999 and 2008 traces for the zeroth and first orders, respectively, for illustration.
- Quantum efficiency increases for earlier dates, decreases for later. Zeroth order decline rate is applied within the region chipx= [8544.5, 9312.5], chipy= [1776.5, 2416.5]. This produces the two-level correction visible in the differnce plots in Figure 9 below.
|
|
|
|
|
|