CalDB 4.5.1 Public Release Notes
Public Release Date: 24 July 2012
SDP Installation Date: 2012-07-25T13:14:00 (UTC)
I. INTRODUCTION
CalDB 4.5.1 is an upgrade to the Chandra CalDB, which includes the following item only:
- HRC-S T_GMAPs version N0002
For the CIAO 4.4.1 / CalDB 4.5.1 release notes see How CalDB 4.5.1 Affects Your Analysis
II. SUMMARY OF CHANGES
A. HRC-S T_GMAPs version N0002
| Location: | $CALDB/data/chandra/hrc/t_gmap/ |
| Filenames: | hrcsD1999-07-22t_gmapN0002.fits hrcsD2012-03-29t_gmapN0002.fits |
It has been known for some time that the HRC-S GAIN and QE have been degrading with the age and exposure of the detector. An HRC-S time-dependent gain map (T_GMAP) was originally released in CalDB 4.3.0 on 15 December 2009, to correct for this gain and QE sag. It was due to expire as of 01 Jan 2012, with no projections in subsequent GAIN sag included in that file. Since then, several additional calibration observations have been added that modify that T_GMAP, for the applicable HRC-S HV settings, and hence that original file is due to be updated. Additionally, the HRC-S top and bottom plate HV values have been adjusted by 60 volts, in particular for OBS_ID 14250 (29 MAR 2012) and most subsequent observations with HRC-S. The purpose of the HV change is to recover the HRC-S GAIN and QE performance to 2002 levels. Hence an additional approximate T_GMAP, effective as of 29 MAR 2012, must be added as well. This second T_GMAP file will likely be upgraded with the accumulation of additional gain calibration data, in the year 2013.
For technical information on the new T_GMAP calibrations, see the Technical Details section below.
See also the HRC-S Time-dependent Gain why page for more information.
PIPELINES/TOOLS AFFECTED:
THREADS AFFECTED:
III. TECHNICAL DETAILS
A. HRC-S T_GMAPs version N0002
The HRC-S time-dependent gain map has been updated for all observations taken with HRC-S since 01 Jan 2012. The previously existing T_GMAP file has been replaced with two new files. The first file, hrcsD1999-07-22t_gmapN0002.fits, effective from Launch Date until 2012-07-05, has been modified with a new GMAP epoch extended by observations taken during 01 Jan through 04 July 2012 at the original Launch HV settings. Obs_IDs taken before 2012 are unaffected by the update to this T_GMAP.
For the new HV settings, there has not been adequate observation time on the HRC-S to calibrate the GMAP fully, or to verify the time-dependence thereof. Hence an approximate T_GMAP file has been generated, namely hrcsD2012-03-29t_gmapN0002.fits, with the intention of replacing it with a better one on the calendar year 2013 time range.
The following information has been reduced from the LETGS web page HRC-S High Voltage Change.
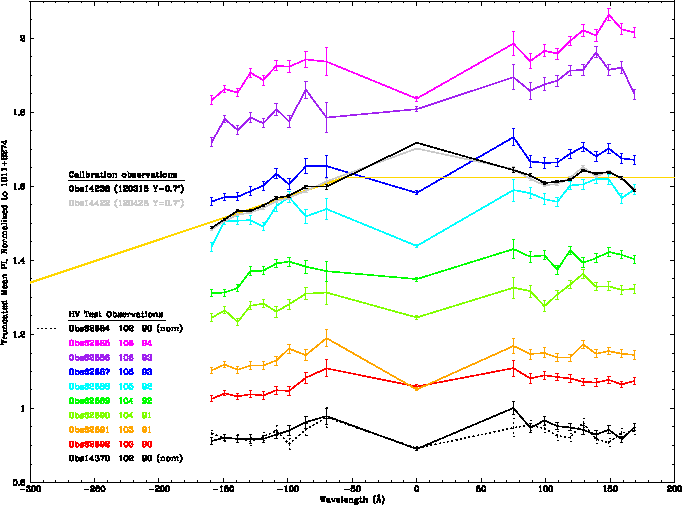
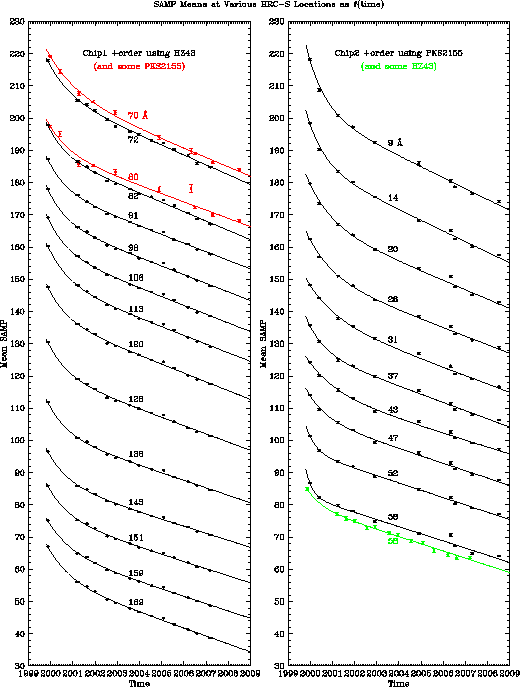
After testing a range of settings, the voltages applied to the top and bottom plates of the HRC-S microchannel plates (MCPs) have each been increased by 60 V, which raised the detector gain by ~60% at wavelengths covered by the soft continuum source, HZ43 (see Fig. 1). Data at shorter wavelengths (from Mkn 421) show similar increase in gain, but the effects of grating higher orders require more detailed analysis and so for now the file simply interpolates gain behavior for λ ≤ 60 Å from the longer-wavelength HZ43 data. Likewise, until data are collected over a longer time period the file conservatively extrapolates the temporal decay seen before the voltage change (see Fig. 2) and scale the gain calibration accordingly.

Fig. 1: Mean PI for 0th order and slices of dispersed HZ43
spectra, using the old gain calibration, and normalized to PI
values from observations (ObsIDs 1011 and 8274) made at the
old voltage settings. Colored curves and the bottom two black
curves (solid and dotted) are for short test observations at
various voltage settings. Settings for the blue curve (ObsID
62687) were chosen for the new operating voltage. The upper
black and gray curves are for 10-ks calibration observations
made with the new voltages. (0th order appears high for these
two observations because they were made with Yoffset=0.7',
which moves 0th order off the low-gain on-axis aimpoint.) The
gold curve is the gain correction factor used for post-voltagechange
observations (with an additional 6% adjustment to
provide a margin of error for filtering).

Fig. 2: Mean SAMP (PHA) as a function of time, with data
from different wavelengths offset vertically in steps of 10.
Smooth curves are from least-squares fits of exponential plus
linear decay, and are used to model time dependence of the
HRC-S gain map. For the preliminary post-voltage-change gain
calibration, these curves will be extrapolated in time but have
abrupt jumps at March 2012.
Given the uncertainties in the short-wavelength gain and in the rate of temporal decline, the HRC-S Cal team has adjusted the gain correction factors by ~6% (relative to their most likely values) in order to ensure that event PI values err on the low side so that the LETG/HRC-S background filter will not remove more than the expected 1.25% of valid X-ray events. Background filtering of data collected after 2012 Mar 29 will therefore be slightly less effective than with a fully optimized gain map, but is otherwise perfectly "safe." A more accurate gain map will be constructed when adequate data have been accumulated, probably sometime in 2013.