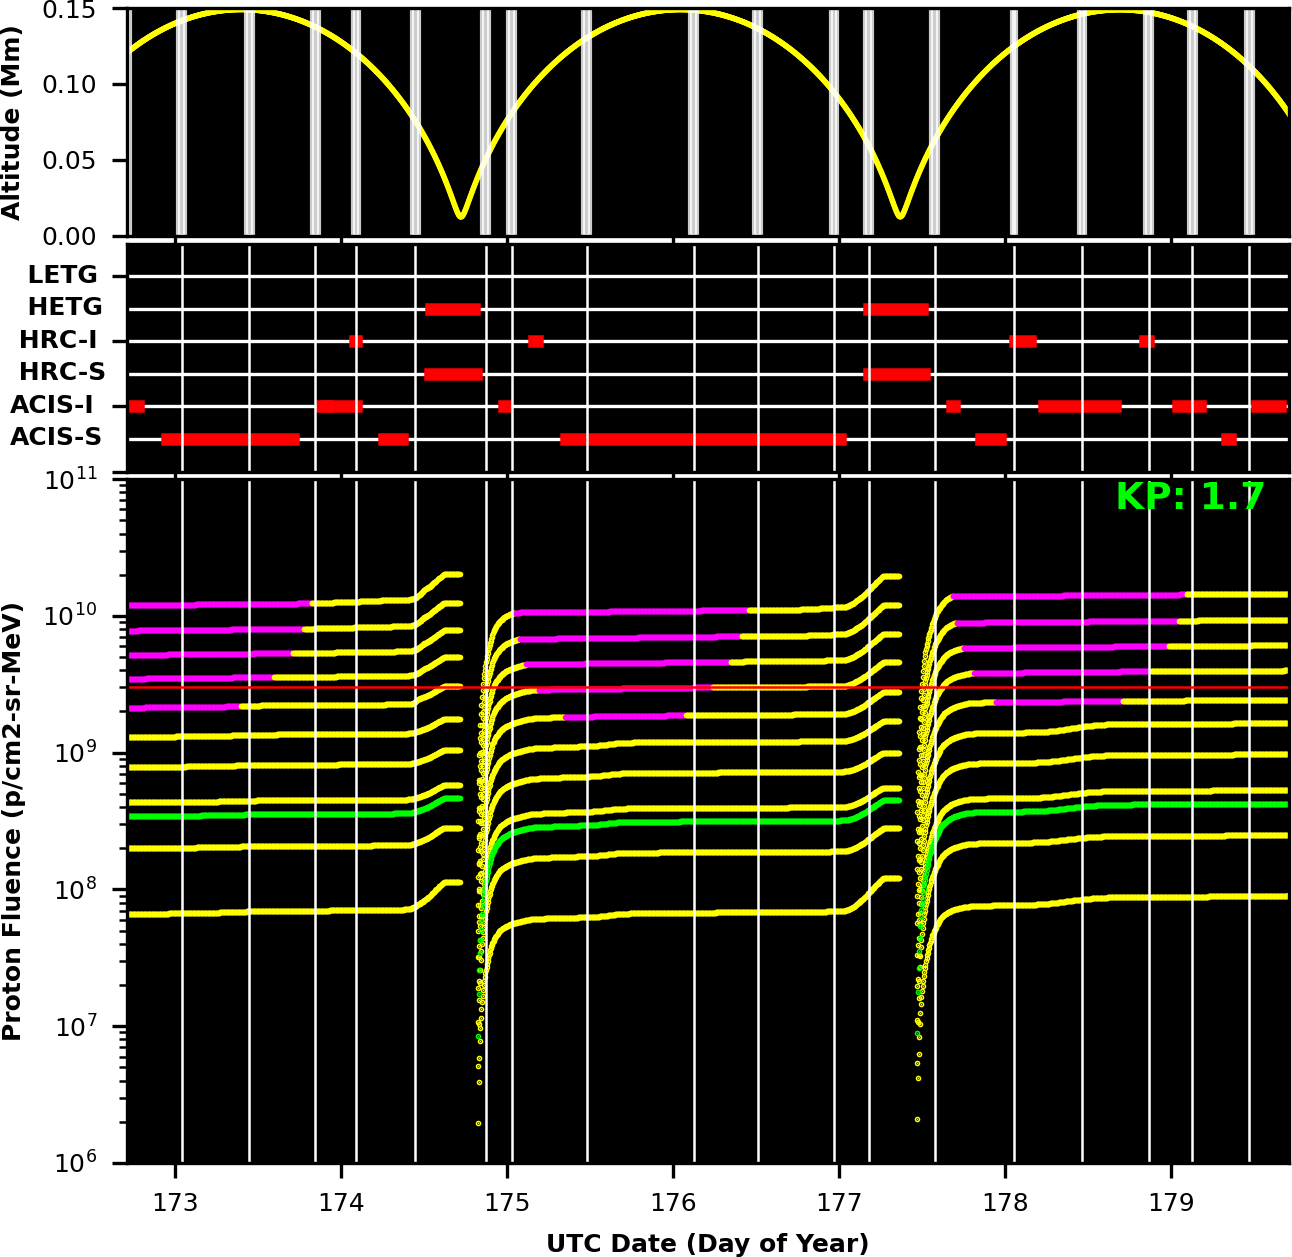
Green lines indicates fluence estimates based on the current KP value.
|
|
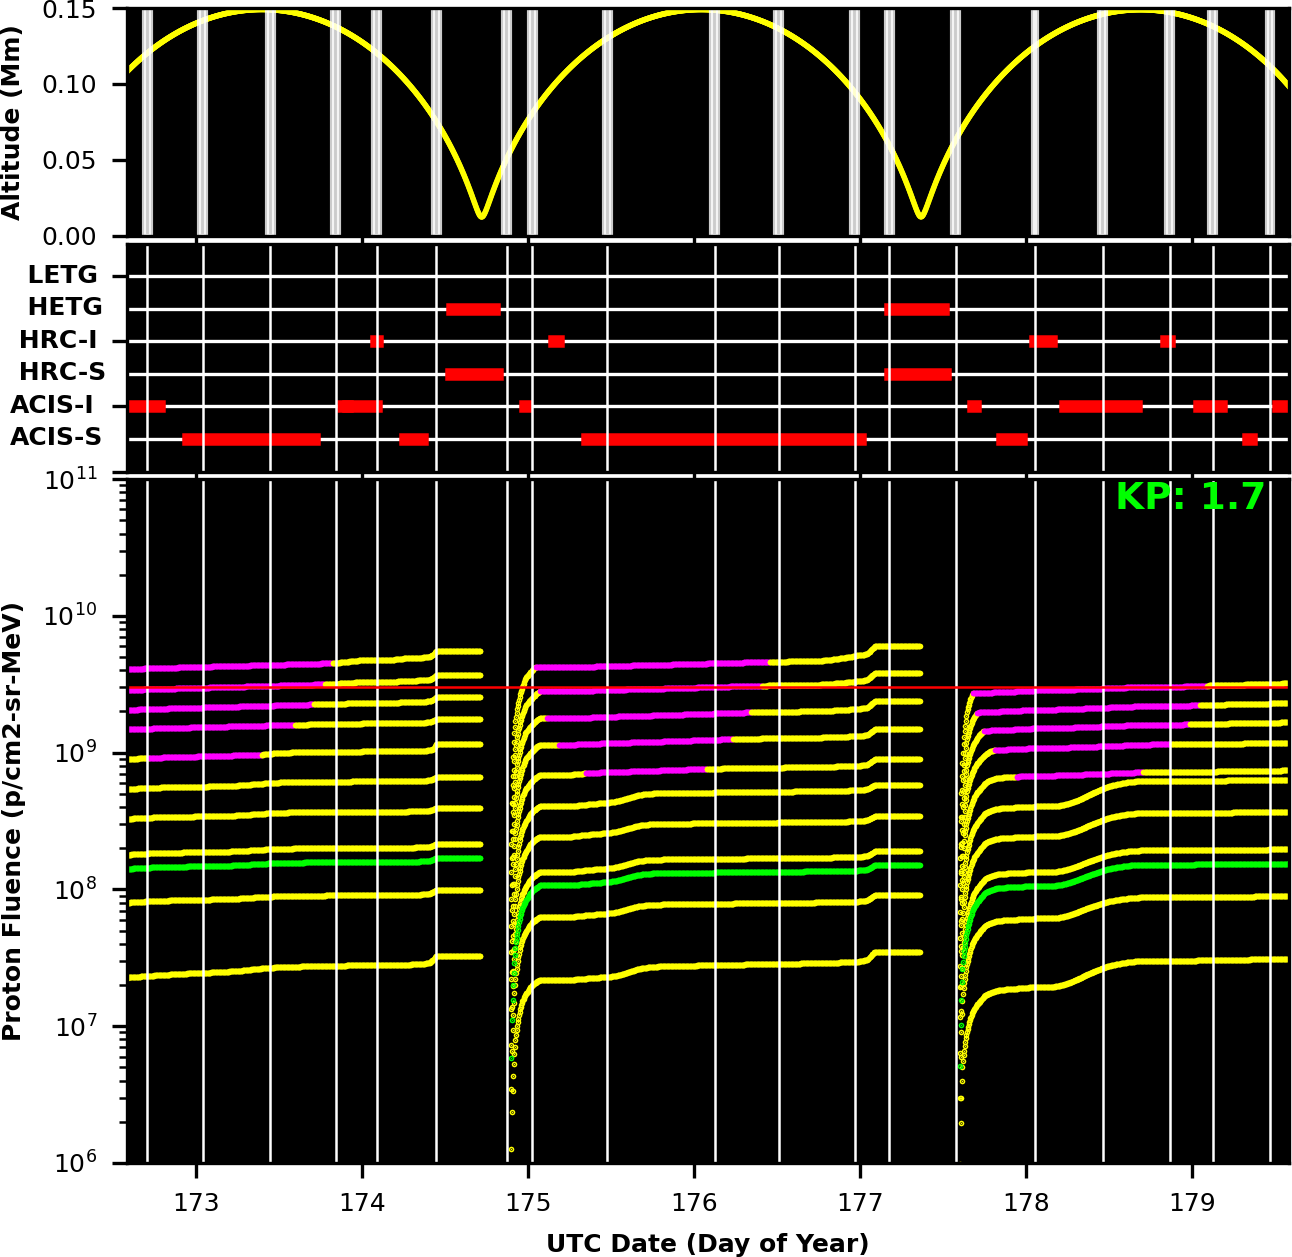
Plot of predicted future Chandra radiation, with SI config and DSN schedule plots, updated every 5 minutes. The left plot shows the external environment, and the right plot shows the attenuated plots due to the instruments used.
Green lines indicates fluence estimates based on the current KP value.
Email problems to: swolk@cfa.harvard.edu (Scott Wolk)
Last Update:Jul 18, 2025