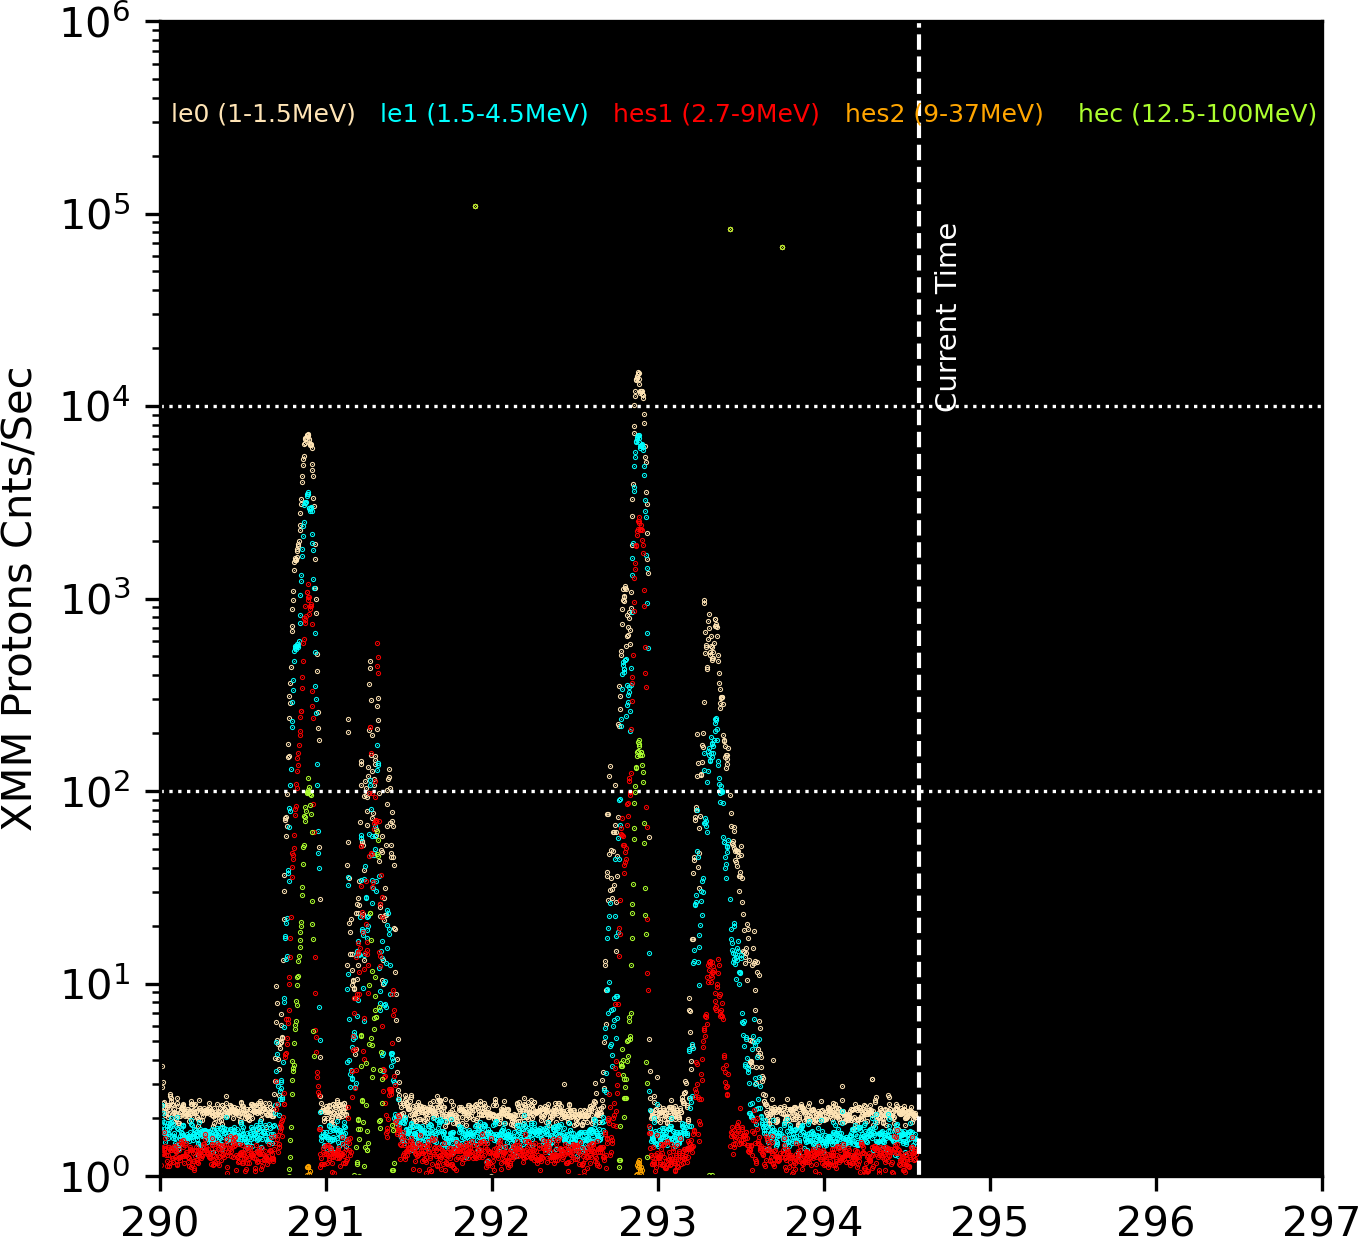
                                        Most recent XMM radiation observations
                                 Differential Flux particles/cm2-s-ster-MeV

 UT Date   Time    ---------------------------------- Protons MeV -------------------------------
                          LE1          LE2         HES1         HES2         HESC
  YR MO DA HHMM          1-1.5       1.5-4.5       2.7-9        9-37       12.5-100
2026-Jul26-00:30      485.454        0.444      104.403        0.502        7.373
2026-Jul26-01:30     2356.346        0.496     1586.348        1.233      124.191
2026-Jul26-02:30    10272.624        1.053     6519.197        5.378      559.800
2026-Jul26-03:30     3694.435        0.590     1688.657        1.422      134.055
2026-Jul26-04:30        2.206        0.457        1.510        0.500        0.401
2026-Jul26-05:30        1.894        0.454        1.465        0.470        0.410
2026-Jul26-06:30        1.933        0.423        1.560        0.461        0.392
2026-Jul26-07:30        1.916        0.447        1.482        0.479        0.388
2026-Jul26-08:30        4.189        0.409        1.612        0.502        0.411
2026-Jul26-09:30      127.012        0.432        3.580        0.494        0.497
2026-Jul26-10:30      895.015        0.432       38.479        0.505        2.968
2026-Jul26-11:30     1628.535        0.446       96.680        0.517        6.813
2026-Jul26-12:30     1081.262        0.454      115.528        0.556       10.253
2026-Jul26-13:30      494.587        0.458       75.665        0.547        7.461
2026-Jul26-14:30      339.404        0.448       45.402        0.519        4.541
2026-Jul26-15:30      237.123        0.443       21.589        0.479        1.996
2026-Jul26-16:30       95.017        0.429        8.779        0.505        0.865
2026-Jul26-17:30       54.744        0.439        6.322        0.539        0.750
2026-Jul26-18:30       42.786        0.434        3.205        0.493        0.478
2026-Jul26-19:30       20.845        0.460        2.056        0.502        0.389
2026-Jul26-20:30       21.376        0.429        3.254        0.499        0.488
2026-Jul26-21:30       13.882        0.463        3.521        0.485        0.550
2026-Jul26-22:30        3.289        0.452        1.798        0.446        0.411
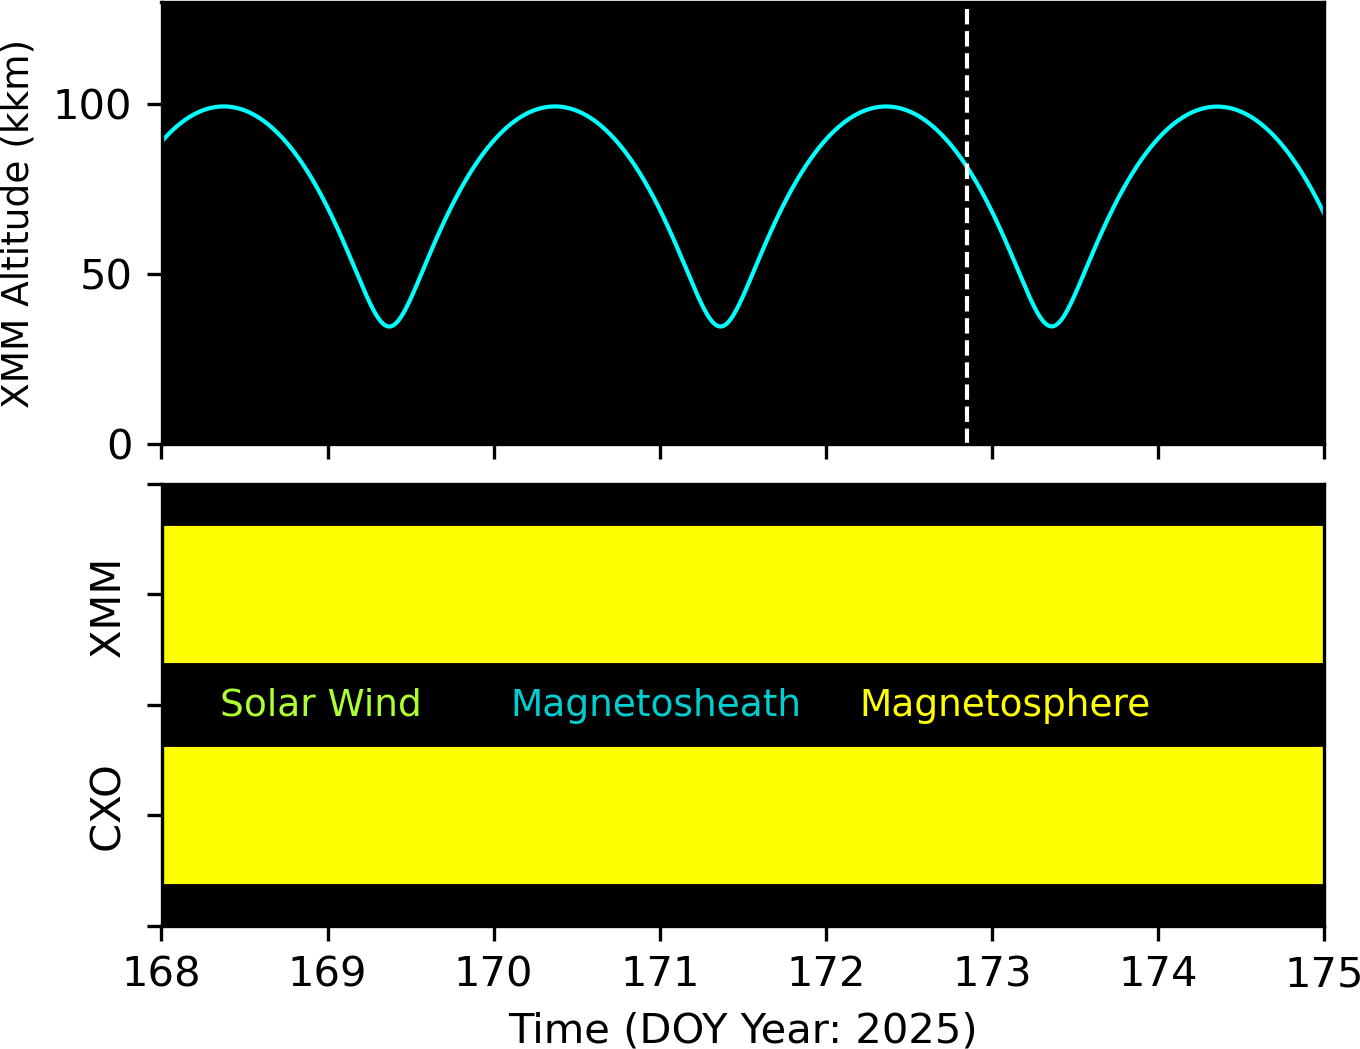
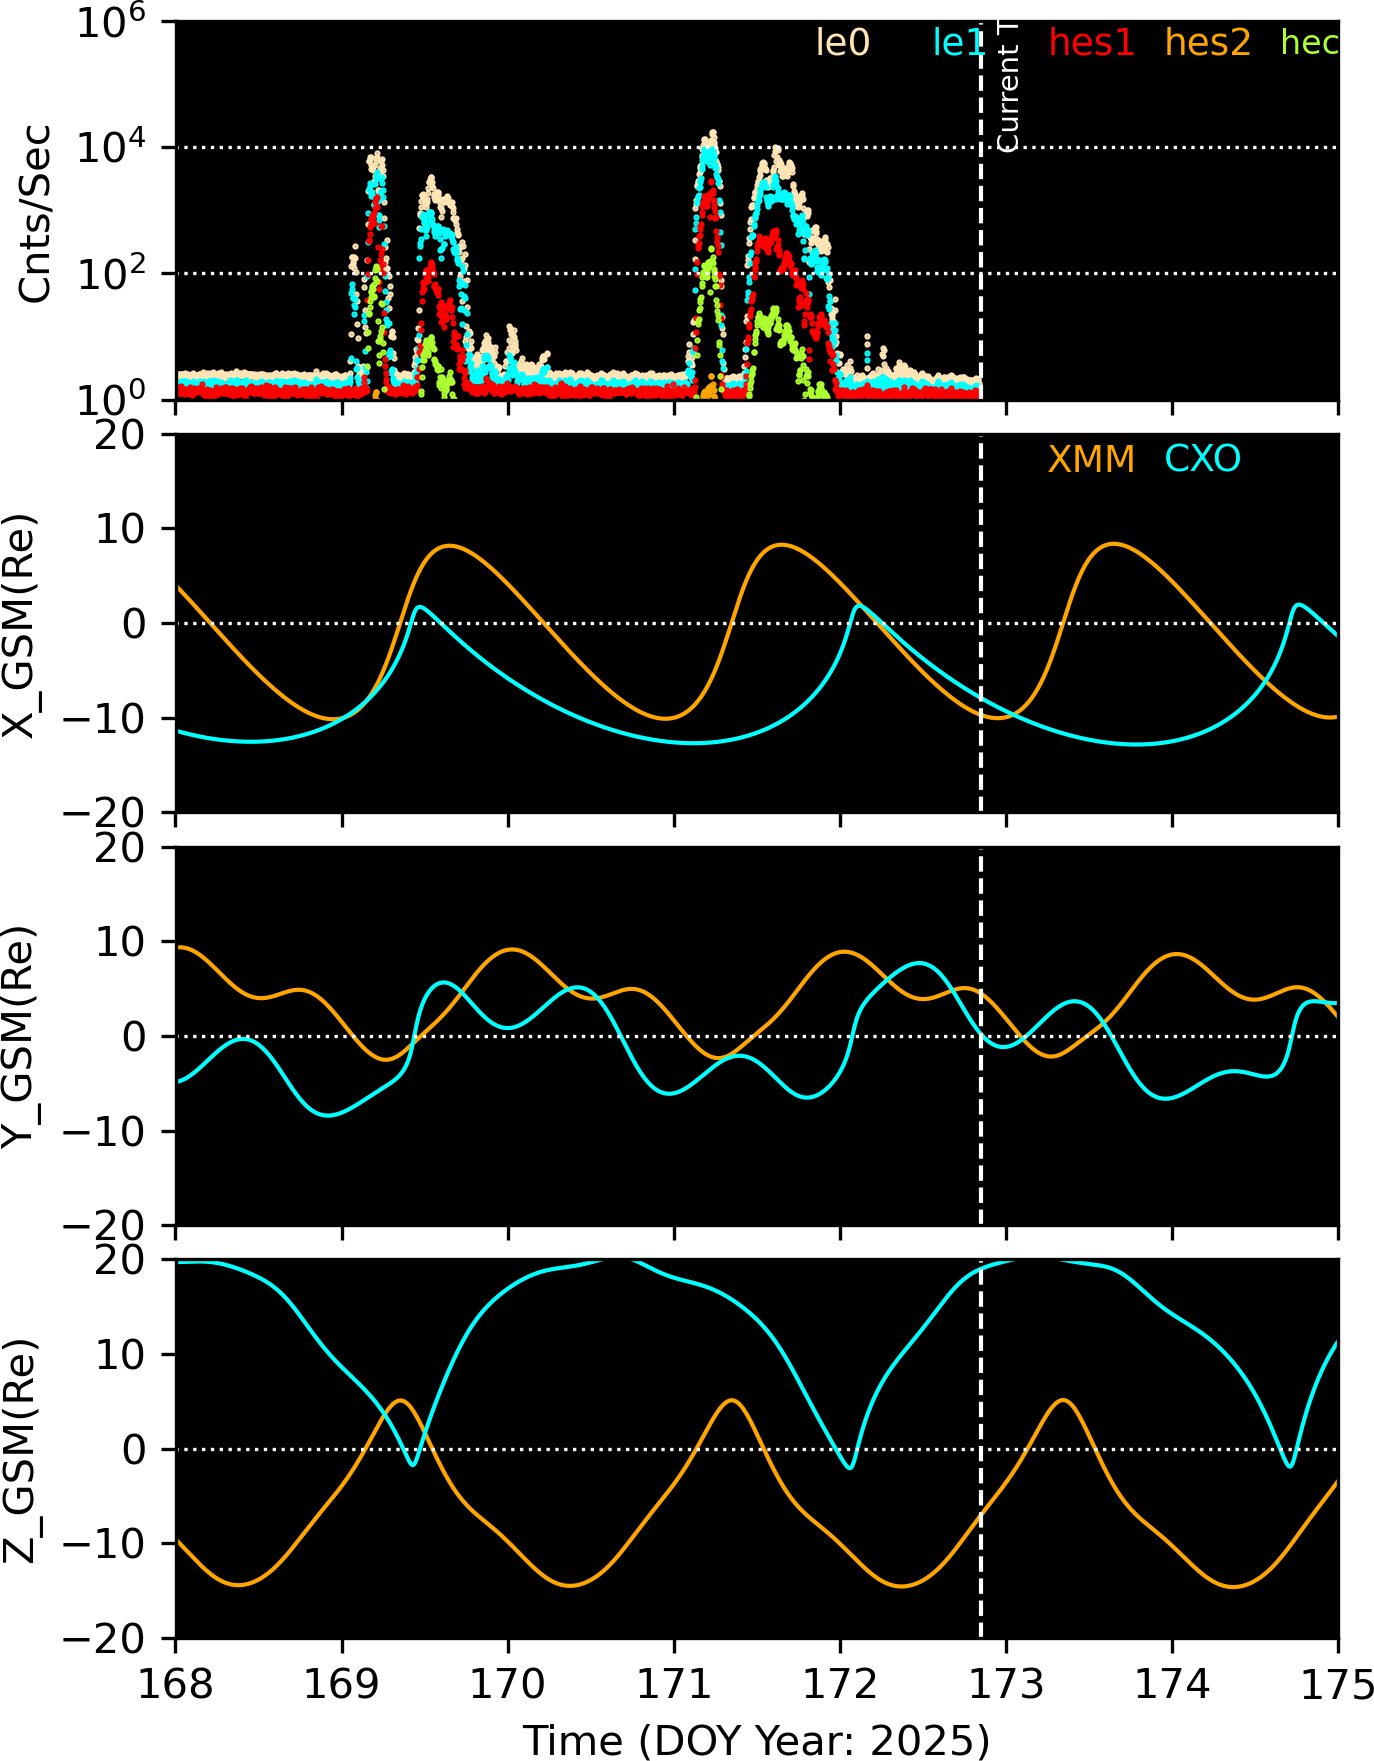
The following plots show the orbits of CXO and XMM in GSM coordinates. The left plot is in X-Y plane, and the right plot is in X-Z plane. If the orbit is in green, the satellite is in the solar wind area, if it is in light blue, the satellite is in magnetosheath, and if it is in yellow, the satellite is in magnetosphere.
The periods of the plotted orbits are +/-1.35 days from the current satellite positions (*), and the orange pentagon (*) mark the positions of one day ago.
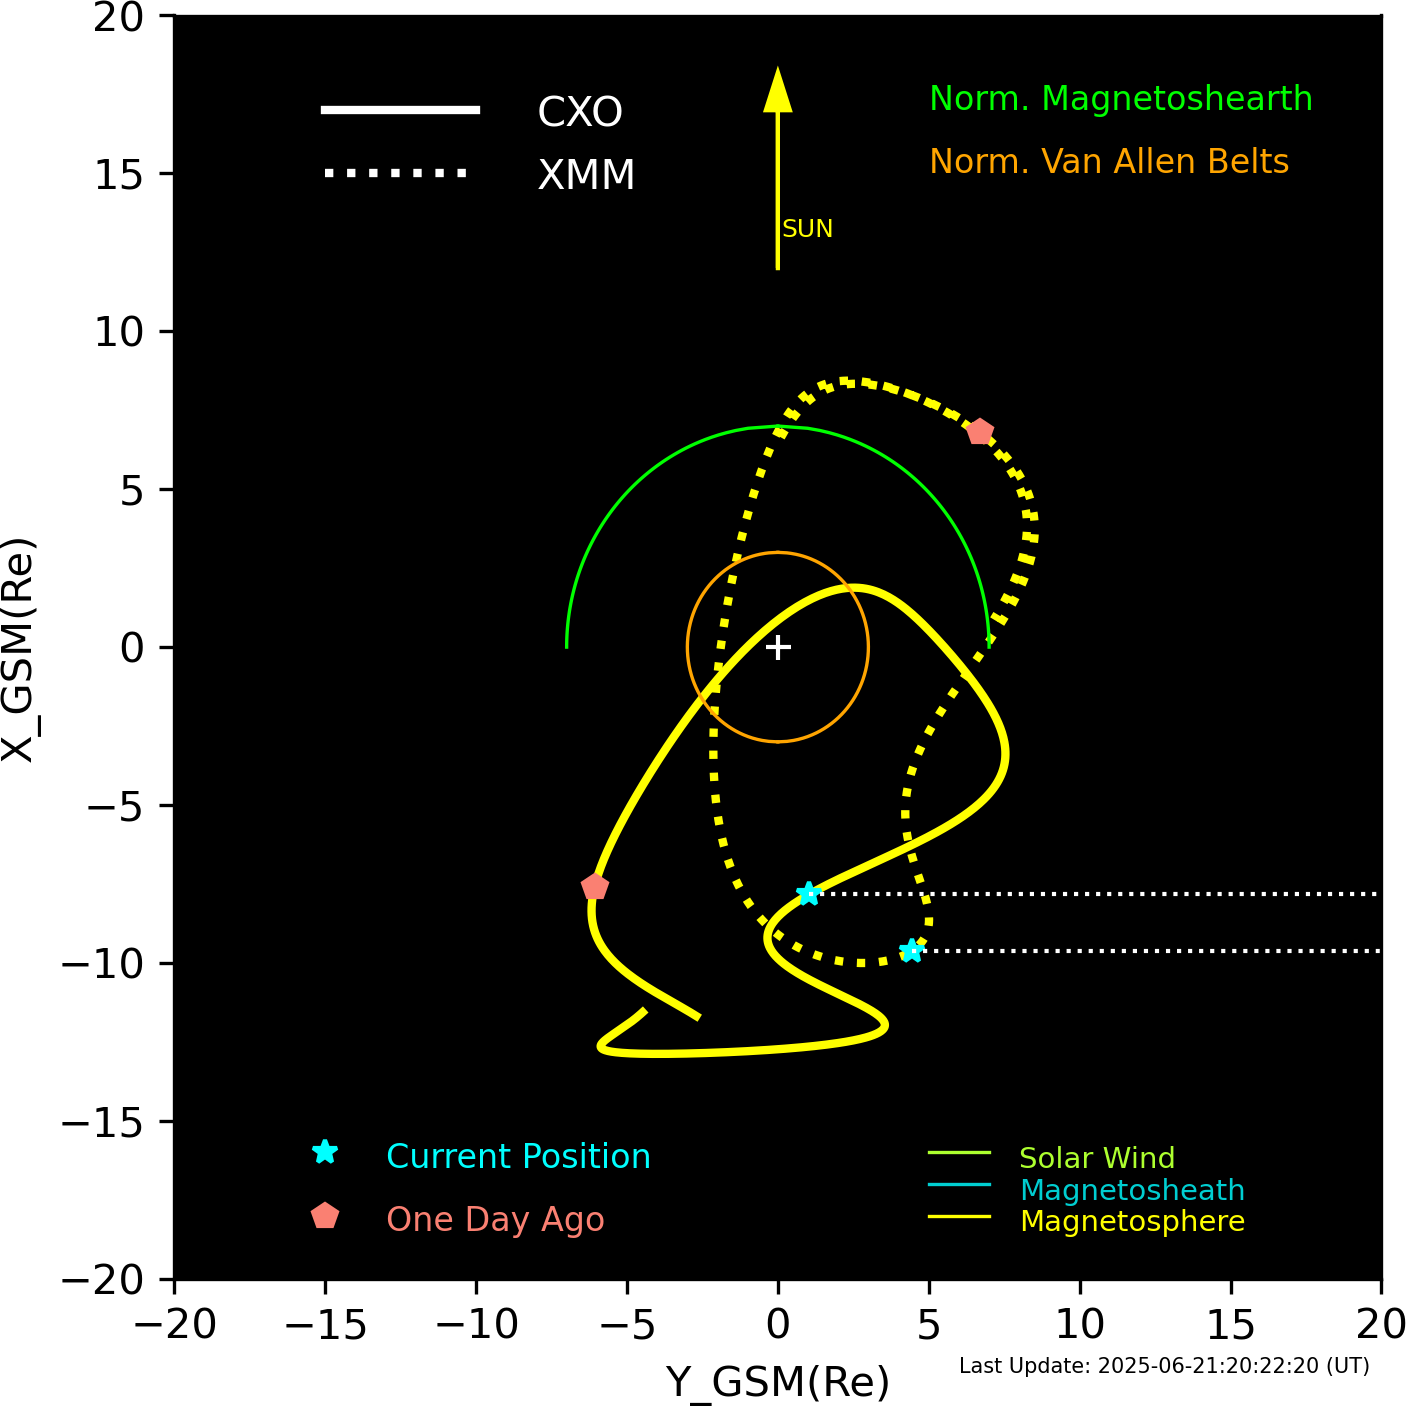
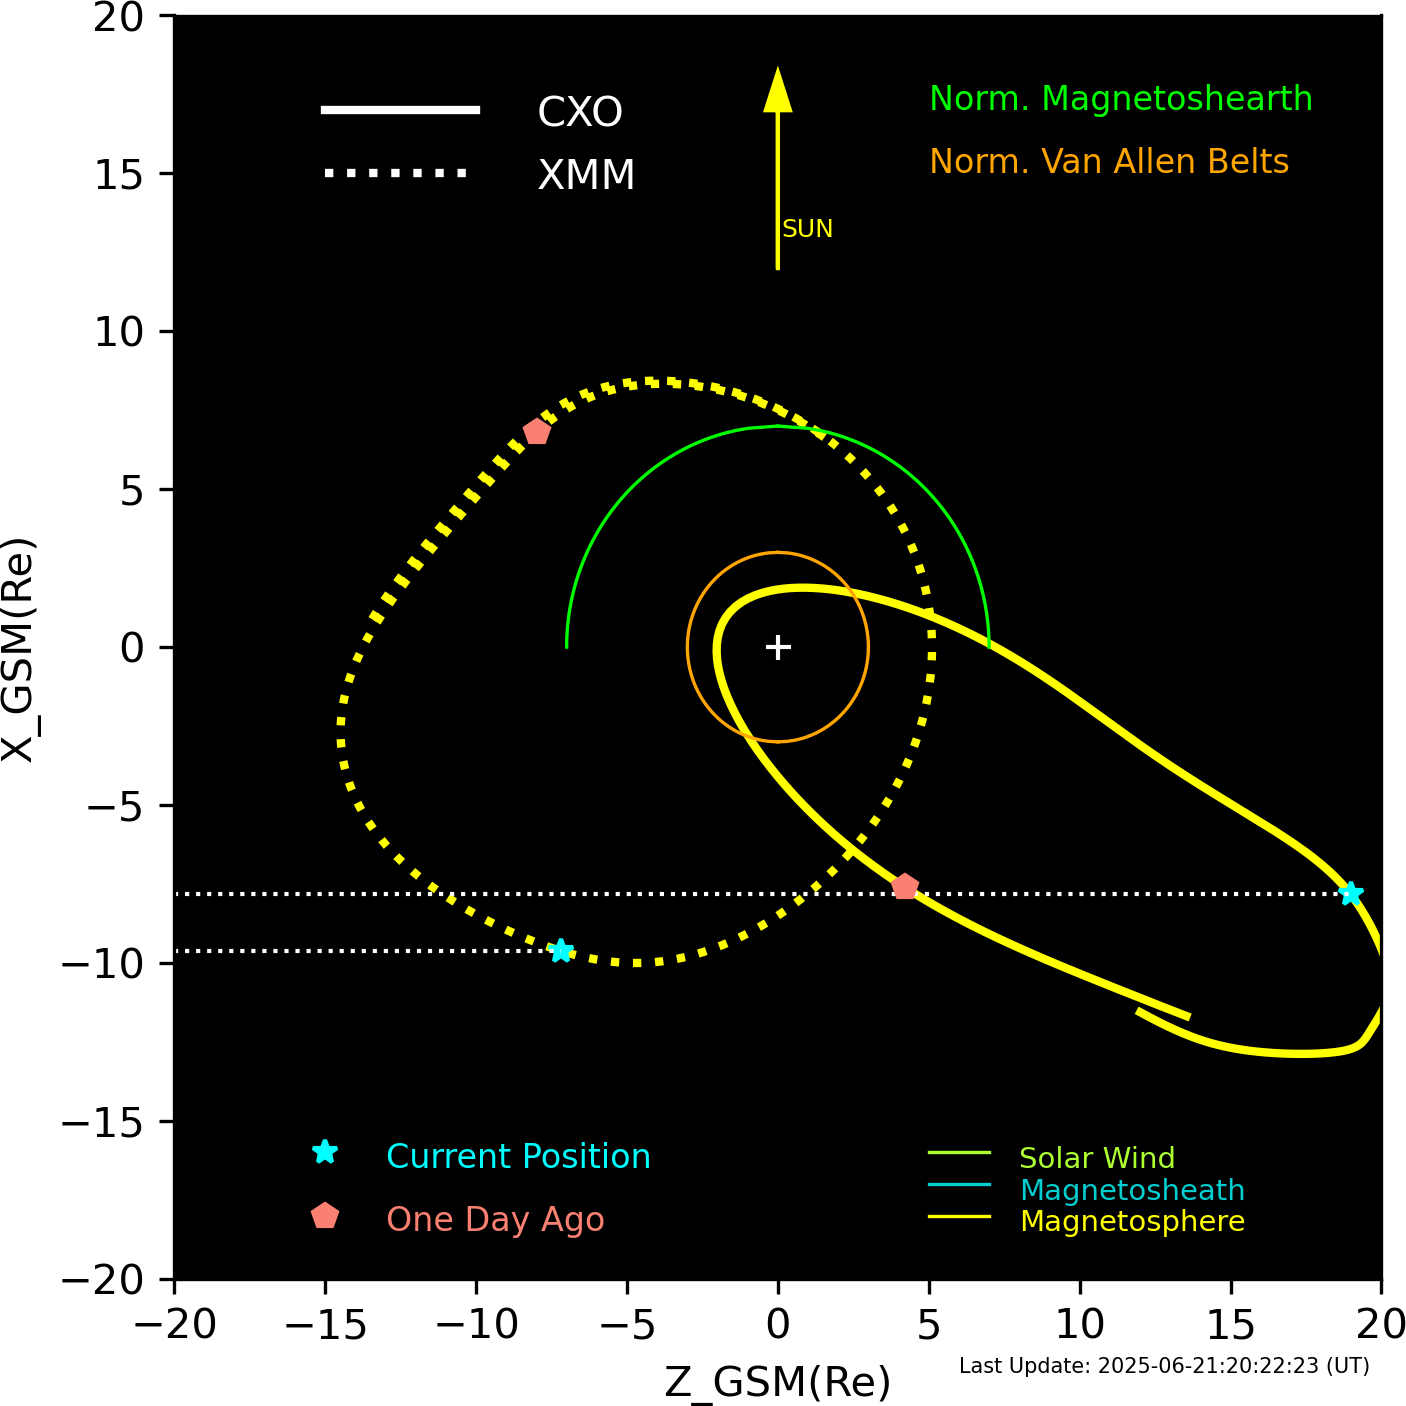
XMM and CXO orbits in GSM coordinates.
Email problems to: swolk
(Scott Wolk)
...it is all his fault