Fig.
1: Comparison of the total change in eV due to the Epoch 37, 38, and
39 T_GAIN files, for the I3 aimpoint.
<Return to CalDB Release Notes>
CalDB PUBLIC Release Notes
Effective
Date: (UTC) 2009-12-15T17:00:00
(Not installed in SDP.)
Public Release Date: 15 December 2009
Version: 4.2.0
Release Type: PUBLIC
CaldB 4.2.0 is a major upgrade to all previous CalDB4 versions 4.1.x. It includes the following upgrades:
ACIS T_GAIN Epoch 39 (01 August through 31 October 2009)
ACIS CONTAM version 5: Improvement in ACIS OBF contamination modeling for observations taken since 2005.
HRC-I SAMP-based GMAP files: Improved gain map images based on the SUMAMPs metric. Requires CIAO 4.2 or later version to run properly. A new RMF for these new gains is also included.
HRC-S SAMP-based time-dependent gain map (T_GMAP): A new time-dependent filetype that calculates the appropriate GMAP image to be applied to the data. A corresponding new TGPIMASK2 filter file is included, for HRC-S background filtering. Requires CIAO 4.2 or later version.
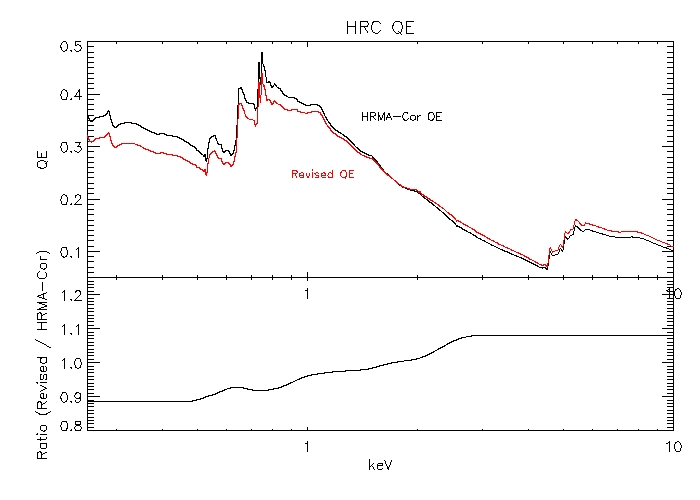
HRC-S QE and QEU upgrades.
A corrected HRC-I PHA-based RMF, with a new EBOUNDS extension that contains the appropriate energy range for analysis of current HRC-I archival data, without reprocessing with the new SAMP GMAPs.
CalDB 4.2.0 requires CIAO 4.2 to work optimally, and vice versa, specifically because of the changes to the HRC GMAPs above, and the corresponding upgrades to hrc_process_events in CIAO 4.2.
User Documentation:
"How
CalDB 4.2.0 Affects Your
Analysis"
http://cxc.harvard.edu/ciao/releasenotes/ciao_4.2_release.html#HowCALDB4.2.0AffectsYourAnalysis
LOCATION:
$CALDB/data/chandra/acis/t_gain/
CODENAME: T_GAIN
FILENAMES:
acisD2009-05-01t_gainN0005.fits
acisD2009-05-01t_gainN0006.fits
acisD2009-08-01t_gainN0002.fits
acisD2009-08-01t_gain_biN0002.fits
The Epoch 39 (Aug - Sep 2009) have now been released as indicated above;
hence the Epoch 38 interpolations (the 2009-05-01 filenames above,
applicable for observation dates May through July 2009) are now
finalized. The previous epoch N0002 files have been demoted to "BAD"
status, though they are still in the circulation with the CalDB, just
in case they are needed for comparison to earlier analyses. See the
Tech Details below for information on the degree of effect versus
energy that the new corrections will have on your particular ACIS
datasets. These new files will only affect data with DATE-OBS after
2009-05-01T00:00:00. All earlier data are unaffected by this
change.
Users analyzing observations with DATE_OBS later than
2009-05-01 are encouraged to reprocess their Level 1 events data
through Level 2, to verify whether or not their previous analysis
results are at all affected by these new data. The plots in Tech
Details section III.A give some a priory indications of how
these data will affect them.
Pipes/Tools affected:
SDP/CIAO tool acis_process_events
Threads affected:
Any thread that employs acis_process_events with the
parameter apply_tgain set
to "yes", which is the default state.
Specifically,
"Reprocessing to create a new (ACIS) L2 events
file"
http://cxc.harvard.edu/ciao/threads/createL2/index.html#acis
BRANCH:
$CALDB/data/chandra/acis/contam/
CODENAME:
CONTAM
FILENAMES: acisD1999-08-13contamN0005.fits
A new model for the ACIS time-dependent QE degradation is now available. This is modeled as a time-variable carbon-oxygen-fluorine + extra component contaminant on the ACIS optical blocking filters, and hence the CalDB file is designated "CONTAM". The new file includes separately derived models for ACIS-I from ACIS-S, because the behavior versus time for I3 is different than for S3, near both the aimpoints and the edges. The old file, N0004, was about to expire as of the end of 2009, and its applicability beyond that time is problematic. The new file replaces the old one for all mission times.
Pipes/Tools affected:
CIAO tools mkarf, mkgarf (fullgarf), mkinstmap (mkexpmap)
Threads affected:
ACIS imaging (exposure maps):
Multiple Chip ACIS Exposure Map:
http://cxc.harvard.edu/ciao/threads/expmap_acis_multi/
ACIS imaging spectroscopy (ARFs):
specextract:
http://cxc.harvard.edu/ciao/threads/specextract/
psextract:
http://cxc.harvard.edu/ciao/threads/psextract/
Step by step:
http://cxc.harvard.edu/ciao/threads/streakextract/index.html#arf
http://cxc.harvard.edu/ciao/threads/wresp_multiple_sources/index.html#warf
http://cxc.harvard.edu/ciao/threads/pieces/index.html#arf
ACIS Grating Spectroscopy (using fullgarf):
http://cxc.harvard.edu/ciao/threads/mkgarf_hetgacis/
http://cxc.harvard.edu/ciao/threads/mkgarf_letgacis/
BRANCH:
$CALDB/data/chandra/hrc/gmap/
CODENAME: GMAP
FILENAMES:
hrciD1998-10-30sampgainN0001.fits
hrciD1999-10-04sampgainN0001.fits
hrciD2000-12-12sampgainN0001.fits
hrciD2002-01-26sampgainN0001.fits
hrciD2003-02-22sampgainN0001.fits
hrciD2004-11-25sampgainN0001.fits
hrciD2005-10-17sampgainN0001.fits
hrciD2006-09-20sampgainN0001.fits
hrciD2007-09-17sampgainN0001.fits
hrciD2008-09-07sampgainN0001.fits
For the new RMF:
BRANCH: $CALDB/data/chandra/hrc/rmf/
CODENAME: MATRIX
FILENAME: hrciD1999-07-22samprmfN0001.fits
The new SAMP-based GMAP files are gain correction files based on the SUMAMPS metric rather than the PHA. SUMPAMPS, which is the sum of the signals of the three nearest amplifiers to the detected event, are more uniform spatially than the PHA, which is the sum of all amplifiers at the time of the event. Hence, any gain corrections are more consistent, and a better estimate of the spectral shape, hard versus soft, may be obtained. Additionally, the SUMAMPS scale extends from 0-1023, and gives a better representation of the pulse-height distribution than the PHA, which extends only from 0-255, and events with larger pulse heights get piled up in channel 255.
The additional channels available in SUMAMPS requires a new, modified RMF to be used for quantile color-color mapping and hardness ratios, whenever the SAMP gain files above have been applied to the data. CIAO 4.2 (or later version) is required in order to use these new GMAP files correctly in hrc_process_events. These new GMAPs will not be applied in standard data processing (SDP) until early 2010, when DS 8.3 is installed in CXC Operations.
Threads affected:
CIAO 4.2 reprocessing with hrc_process_events
(gainfile parameter only)
http://cxc.harvard.edu/ciao/threads/createL2/
Quantile color-color grids and hardness ratios:
See http://cxc.harvard.edu/cal/Hrc/RMF/samp_rmf.html
BRANCH: $CALDB/data/chandra/hrc/rmf/
CODENAME: MATRIX
FILENAME: hrciD1999-07-22rmfN0002.fits
It has been recently discovered that the existing HRC-I RMF file (N0001) has an error in the EBOUNDS extension, in that the energy grid stored there is incorrect. It is currently a grid centered around the channel numbers (1-300), rather than the desired energy range (0-75 keV). Hence this is being corrected in the N0002 version. The "MATRIX" extension, with the actual RMF, remains unchanged.
Threads affected: Quantile color-color
gridding and hardness ratios with HRC-I and the PHA-based GMAPs. Note
that the archive currently contains HRC-I observations with the
PHA-based GMAPs, as the new SAMP-based gains are not yet installed in
processing. See the HRC-I calibration web page at
http://cxc.harvard.edu/cal/Hrc/RMF/index_200611.html
for details and examples.
BRANCH: $CALDB/data/chandra/hrc/t_gmap/ (new)
CODENAME: T_GMAP
FILENAME: hrcsD1999-07-22t_gmapN0001.fits
For the new TGPIMASK2 filter file:
BRANCH: $CALDB/data/chandra/hrc/tgpimask2/
CODENAME: TGPIMASK2
FILENAME: letgD1999-07-22pireg_tgmap_N0001.fits
A new SAMP-based time-dependent GMAP file is now installed in CalDB for HRC-S observations. The file is somewhat analogous to the T_GAIN corrections for ACIS, except that this one provides a fully time-dependent GMAP (gain image) for any observation with a given DATE-OBS (TSTART). The SAMP-based gains are based on the SUMAMPS metric rather than the PHA, because the SUMAMPS (sum of the three nearest amp signals to the measured event) is much more spatially uniform for the HRC plates than is the PHA (sum of all amplifier signals corresponding to a given event). For the HRC-S, the primary purpose of the GMAP application is to reduce background for the instrument. To that end, a new PI-region filter file is also provided, to be used when T_GMAP is applied to the events list.
Threads affected:
HRC-S events reprocessing:
IMAGING:
http://cxc.harvard.edu/ciao/threads/createL2/index.html#hrc.s.imaging
GRATING:
http://cxc.harvard.edu/ciao/threads/spectra_letghrcs/
HRC-S Background Filtering:
BRANCH: $CALDB/data/chandra/hrc/tgpimask2/
CODENAME: TGPIMASK2
FILENAME:letgD1999-07-22pireg_tgmap_N0001.fits
This new PI region filter file is for use only with data reprocessed with the T_GMAP file above, using the modified hrc_process_events in CIAO 4.2 or later version. For the general thread, see "LETG/HRC-S Grating Spectra: Generate New L2 Events file: Apply background filter", at
http://cxc.harvard.edu/ciao/threads/spectra_letghrcs/index.html#back
BRANCH: $CALDB/data/chandra/hrc/qe/
and $CALDB/data/chandra/hrc/qeu/
CODENAMES: QE and QEU
FILENAMES: hrcsD1999-07-22qeN0010.fits and hrcsD1999-07-22qeuN0005.fits
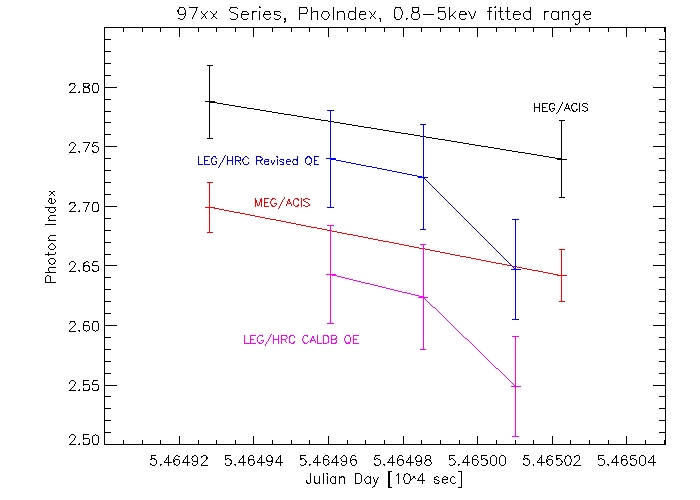
The HRC-S QE has been revised based on the analysis of nine HRC-S/LETG and seven ACIS-S/HETG observations of the blazar PKS2155-304. These observations were selected based upon their close LETG/HETG temporal proximity . The spectra were fitted with an nH-absorbed power law model which revealed a systematic offset between the LETG and HETG observations in photon index and normalization.
Threads affected:
HRC-S Imaging: Exposure maps
http://cxc.harvard.edu/ciao/threads/expmap_hrcs/
LETG/HRC-S Grating Spectroscopy: Making GARFs for LETG/HRC-S
http://cxc.harvard.edu/ciao/threads/mkgarf_letghrcs/
BRANCH: $CALDB/data/chandra/pimms/
CODENAME: PIMMS_EA
ACIS configurations:
ACIS-I aimpoint: acisiD2009-11-05pimmsN0012.fits
ACIS-I/HETG0: acisihetg0D2009-11-05pimmsN0012.fits
ACIS-I/LETG0: acisiletg0D2009-11-05pimmsN0012.fits
ACIS-S aimpoint: acissD2009-11-05pimmsN0012.fits
ACIS-S/HETG0: acisshetg0D2009-11-05pimmsN0012.fits
ACIS-S/HEG1: acissheg1D2009-11-05pimmsN0012.fits
ACIS-S/MEG1: acissmeg1D2009-11-05pimmsN0012.fits
ACIS-S/HEGMEG1: acisshegmeg1D2009-11-05pimmsN0012.fits
ACIS-S/LETG0: acissletg0D2009-11-06pimmsN0012.fits
ACIS-S/LEG1: acissleg1D2009-11-06pimmsN0012.fits
HRC configurations:
HRC-I aimpoint: hrciD2009-11-05pimmsN0012.fits
HRC-I/LETG0: hrciletg0D2009-11-05pimmsN0012.fits
HRC-S aimpoint: hrcsD2009-11-16pimmsN0012.fits
HRC-S/LETG0: hrcsletg0D2009-11-16pimmsN0012.fits
HRC-S/LEG1: hrcsleg1D2009-11-16pimmsN0012.fits
HRC-S/LETG HIGHER ORDER: hrcsleghiD2009-11-16pimmsN0012.fits
NOTE: These files are not used in software directly from CalDB, and instead are here to maintain them as part of the CalDB release; they are built from other concurrently-indexed CalDB files, and are managed by the CalDB manager. Users have no need of these files, and should not use them for analysis.
For plots of the above effective
areas, see the PIMMS effective areas CalDB page at:
http://cxc.harvard.edu/caldb4/prop_plan/pimms/index.html
or the PIMMS effective area viewer at:
http://cxc.harvard.edu/cgi-bin/build_viewer.cgi?ea
The total corrections versus photon energy for epochs 37, 38, and 39 files, in eV, are given in the figures below, for the ACIS-I and ACIS-S aimpoint positions specifically. We note here that corrections a various points across the chip surface may be rather different, even very significantly so, from these results.
The three figures below give the T_GAIN correction values in eV, as a function of photon energy, for aimpoint positions on chip I3 (Fig. 1), and for S3 with CTI correction applied (Fig. 2), and for S3 without the CTI correction (Fig. 3). The red curve is for Epoch 37, and interpolates between the epoch 37 and 38 corrections at the mid-point in time (average of the T_GAIN values). The 2009-05-01 files are for Epoch 38. The t_gainN0006.fits file replaces the t_gain_biN0002.fits file. The acisD2009-08-01t_gain_biN0002.fits file is a flat, non-interpolating file, and will be upgraded after Epoch 40 has been completed (Nov 1, 2009 - Jan 31, 2010).
As seen in Fig. 1, the Epoch 39 corrections are more significant in I3 than in the previous two epochs. Users should be careful to check their I3 results for observations taken after May 2009, so verify that this set up upgrades does not affect their results for I3 observations. As is usually the case, the modifications vary from epoch to epoch, and future additions may trend in the opposite direction. Other locations on chip S3 may show a different degree of T_GAIN shift.
Fig.
1: Comparison of the total change in eV due to the Epoch 37, 38, and
39 T_GAIN files, for the I3 aimpoint.
Figures 2 and 3 indicate that the upgrades for epoch 39 for chip S3 aimpoint are not as significant as for the I3 aimpoint above. However, these results may be modified by Epoch 40 upgrades as well, when they are available.

Fig
2: A similar plot for the aimpoint of the BI chips S3, with the CTI
corrections applied to the data. For this location and chip, the
recent T_GAIN upgrades show only small corrections, and the trend
continues with Epoch 39. This result may be modified by the next
epoch data as well.
Fig.
3: The S3 aimpoint corrections for the case where the BI chips are
NOT CTI-corrected at all. (The N0005 files.)
At this point in time, an upgrade to the N0004 CONTAM file was necessary, as it was provided as a 10-year correction model, to be updated by the end of calendar year 2009 in any case. However, since 2006, the N0004 model has become increasingly less satisfactory for ACIS-S in particular as shown in Fig. 4 below:
Fig.
4: The optical depth of the contaminant as measured
with the ECS on ACIS-S3 for the aimpoint (solid points) and the edge
of the chip (open symbols). The curves give the corresponding
predictions for the contaminant using the N0004 CONTAM file.
The new ACIS CONTAM file includes separate model corrections for ACIS-S and ACIS-I, which deal with the differing trends versus time for the contaminants on the two separate optical blocking filters (OBF).
ACIS-I Model upgrade:
The ACIS-I model components are the
same as with the N0004 model, specifically a series of elements, H,
C, O, and F, contributing some of the optical depth and the edge
structure in the contaminant, and an additional edge-less component
"fluffium" that adds optical depth to the elemental model
in order to fit the measured results from the ACIS external
calibration source (ECS). In the new version, separate analytic
functions are used to model the time dependence of the elemental and
the two-level (fluffium) components. The scalings of the C:O and C:F
ratios were determined from gratings data with LETG/ACIS-S. The
elemental ratios are now C:F=20, and C:O=12.5. However, the fluffium
component was scaled according to the ECS data from ACIS-I.
The fits to the measured optical depth at 660 eV (from the ECS Mn-L and F-K lines) are given in Fig. 5 below. Here, the scaled elemental model is shown as the dashed curves, and the scaled elemental plus 2-level (fluffium) as the solid curves.

Fig. 5: ECS (660 eV) measured optical depth on ACIS-I at the aimpoint and
at the edge (symbols), with the scaled elemental model (dashes) and
the scaled elemental plus fluffium model (solid curve).
ACIS-S Model upgrade:
For ACIS-S, there are two major changes in the contamination model version N0005:
The time-dependence has been adjusted to account for the accelerated contamination build-up that is shown in Fig. 4 above. Improved gain corrections for the BI chips now available for data taken in late 1999 at ACIS FP_TEMP=-110C have allowed more accurate measurement of the contamination build-up early in the mission. Extrapolation of the ECS optical depths taken throughout the mission results in an optical depth of 0.1 at launch--not very likely physically, but marginally consistent with the uncertainties in the ECS measurements at launch. This offset has been assumed into the time-dependence model for ACIS-S.
Fig. 6: The time-dependence used for the ACIS-S portion of the N0005
contamination model file, over the course of the mission. The solid
black curve is the time-dependence model used in CONTAM version
N0005 for ACIS-S chips.

Fig. 7: The early-time buildup of the contaminant measured by the ECS
(black dots) and ACIS-S observations of clusters of galaxies early
in the mission (blue data points). The dashed curve gives the best
fit with a free (not fixed at zero) offset for the optical depth at
launch. The solid curve, with the 0.1 optical depth offset
subtracted, was used for the time-dependence for ACIS-S in the N0005
CONTAM file.
A new empirical determination of the extra absorption component has been employed, taking the ratio of spectra from 1999 and 2009 observations of the Coma Cluster. After taking into account the elemental absorption derived from gratings data, the ratio of the Coma spectra shows an addtional component whose optical depth gradually increases toward lower energies. This extra component can be fit by a Gaussian centered at E=0 and sigma = 600 eV.
The ratio in the absorption in the individual elements C, O, and F, versus the addtional component has been redetermined using LETG/ACIS-S spectra of AGNs. The results indicate that, within the uncertainties, the spectrum of the addtional absorption component has not changed over the past 10 years, and so can be normalized at any point in time and location on ACIS-S using the ECS measurements.
The spatial variation in the depth of the ACIS-S contaminant has been updated according to the solid line in the figure below. The illustration shows the differences between the ECS optical depths at the top and bottom of ACIS-S3 and those in the center of S3. The line gives the analytic function best fit to those data points. The variation in the depth is taken to be symmetrical about the center of ACIS-S, going up or down on the chips.
 Fig. 8: The differences (delta-tau) between ECS optical depths at the top
(red) and bottom (blue) of ACIS-S and the center of ACIS-S. The
solid curve is the model used for the spatial variation of the
ACIS-S contaminant in version N0005.
Fig. 8: The differences (delta-tau) between ECS optical depths at the top
(red) and bottom (blue) of ACIS-S and the center of ACIS-S. The
solid curve is the model used for the spatial variation of the
ACIS-S contaminant in version N0005.
Behavior of the new file with time:
Plots of the time progression of the contaminant for several dates for the respective
aimpoints of ACIS-I and ACIS-S are shown below.
|
TIME factor (UTC) |
Curve color |
|
CONTAM OFF |
Black |
|
2000-05-15T00:00:00 |
Red |
|
2001-05-15T00:00:00 |
Green |
|
2011-05-01T00:00:00 |
Blue |
Fig. 9: Variation in the ACIS-I effective area for the times given in the
table above, using the N0004 contam model (dashes) and the N0005
model (solid curves).
 Fig. 10: Variation in the ACIS-S effective area for the times given in
the table above, using the N0004 contam model (dashes) and the
N0005 model (solid curves).
Fig. 10: Variation in the ACIS-S effective area for the times given in
the table above, using the N0004 contam model (dashes) and the
N0005 model (solid curves).
Further details regarding the derivation and testing of the N0005 CONTAM upgrade are available in the memorandum "Update to the ACIS Contamination Model," available from the Instruments and Calibrations web page.
The HRC-I calibration team has developed a new sequence of time-diplaced GMAP (gain image) files to account for the known decrease in the instrument's gain with time. These new gain maps use a superior calibration derivation in that they are based on the scaled sums of the three nearest amplifier signals to the event location (SUMAMPS), rather than the basic PHA currently stored in the events files. (PHA is the sum of all amplifier signals corresponding to the event in question, and has a much larger small-scale spatial variation than does the SUMAMPS metric. SUMAMPS is also stored currently in the HRC L1 events files.) Hearafter, SUMPAMPS may be abbreviated to SAMP in this document.
Another advantage to the SAMP-based gain maps is that the PHA values are limited by saturation at PHA=255, while SUMAMPS are not, and thus provide a better capability for spectral discrimination.
The derivation of the new scaled SAMP-based time-dependent GMAPs is described in the memo SUMAMPS-based Gain Maps for the HRC-I, by Jennifer Posson-Brown and Vinay Kashyap (2009), as posted on the HRC-I gain calibration page http://cxc.harvard.edu/cal/Hrc/#gain.
Hence we propose to release the new SAMP-based GMAP files simultaneously with an upgrade to hrc_process_events in CIAO 4.2 (Dec 15, 2009), and anticipated in DS 8.3 in early 2010.
The corrected EBOUNDS extension includes the following range of energies in the channels numbering 1-300, and extending from 0.6-75.0 keV:
ROW CHANNEL E_MIN E_MAX
1 1 0.05999999865890 0.06144570931792
...
300 300 74.1164016724 75.9022521973
Channel 256 contains the following:
256 256 25.9979591370 26.6243839264
A new HRC-S gain map and pulse-height filter for use with LETG data has been developed. Over half of Level 2 background events can be removed at most wavelengths with a loss of ~1.25% of X-ray events. The primary differences from the old gain map (GMAP) and PI filter (TGPIMASK2) are:
Fig 11: Fitted gain curves normalized to epoch 2001.5, when flight gain
most closely matched that during pre-flight laboratory calibration.
The gain calibration is valid to at least 2014.
Fig 12: PI pulse height distributions for flight background in 2000 and
2008, and for X-rays at 160 and 20 Angstroms. The difference between
X-ray and background distributions is the basis of the pulse-height
filter.

Fig 13: Comparison of old and new filters, applied to data from 2000 and
2008. Background fractions are relative to Level 2 data that include
events with PHA=255. The old PI filter became less effective over
time because it did not account for decreasing gain. Less background
is removed at short wavelengths because the filtering threshold must
be higher to avoid excluding X-ray events. The raw BG rate is higher
in 2008 than 2000 because of the solar cycle, but relatively more BG
is removed in 2008 because the BG pulse-height distribution has
relatively more high-channel events.
As implied above, the addition of this new T_GMAP requires a modified TGPIMASK2 background filter file from the several that have been in CalDB for use with the old GMAP. To that end, the LETGS group has produced a new filter file, letgD1999-07-22tgpimask2_tgmap_N0001.fits which has been released in CalDB 4.2.0 as well.
The new HRC-S QE:
Because the ACIS QE is based upon
ground and in-flight calibration and is believe to be more secure
than the HRC-S QE which is more heavily dependent upon in-flight
calibration using sources as standard candles, a correction curve for
the HRC-S QE has been implemented to create a consistency between our
HRC-S/LETG and ACIS-S/HETG source spectra.
A series of HRC-S/LETG observations that were bracketed in time by ACIS-S/HETG observations provide the best calibration test due to the minimization of any source variability.
The final HRC-S QE correction curve was generated by coadding the spectral data and assuming the systematic offsets in photon index and normalization as indicated by the bracketed 9000 series observations.
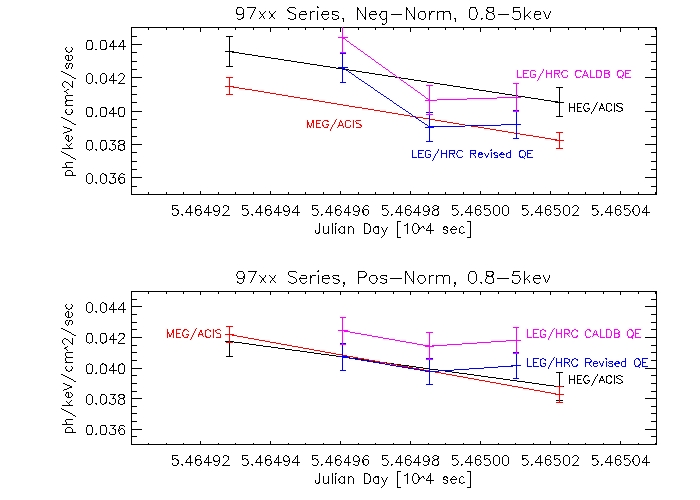
The plots below depict photon index and normalization model fit parameters for the 9000 series of observations. Included are HRC-S/LETG results using the current CALDB 4.1.4 HRC-S QE and the revised N5QE. The fitted photon index and normalization for HRC-S/LETG are now in excellent agreement with the ACIS-S/LETG observations.
|
|
|
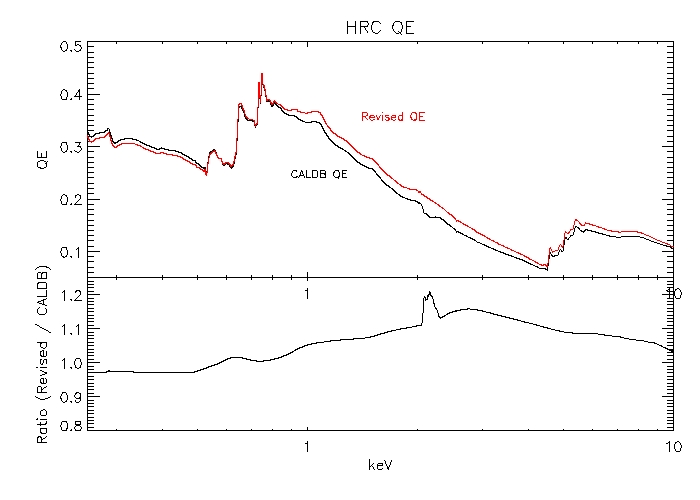
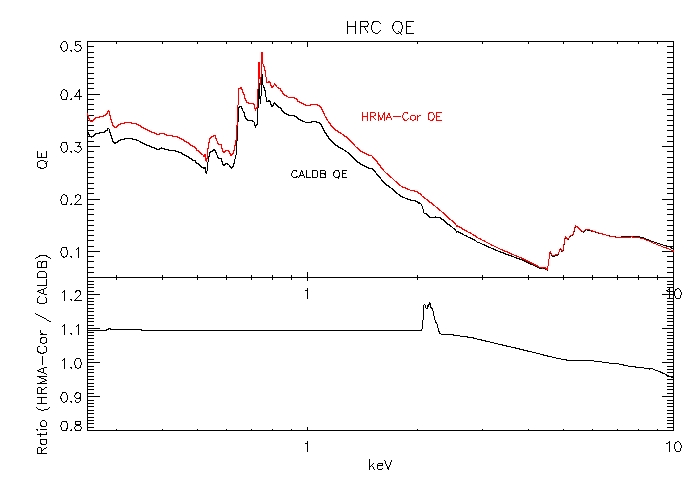
Comparing the old and new HRC-S QE models:
|
|
|
|
|
The new HRC-S QEU:
The following plots illustrate the improvement in the symmetry of
positive and negative orders afforded by the new QEU upgrade for
HRC-S. The first gives the ratio of the +1 and -1 orders for a series
observations, using the current (version N0004) QEU, and the second
plot gives the same ratio (consistently near 1.0) using the new N0005
QEU for HRC-S. Inasmuch as the HRC-S QEU is not based on ground
calibrations, but is instead derived from estimates from flight
observations, the current upgrade is a more-or-less cosmetic change,
but is timely given the upgrade in QE above.
The following plots are the ratio of the fluxes (essentially counts/area) vs wavelength for the combined set of observations of the pure H atmosphere white dwarf HZ43 (obsids 1011, 1012, 2584, 2585, 3676, 3677, 5042, 5044, 5957, 5959, 6473, 6475, 8274, 10622) smoothed on a scale of 0.25 AA.
|
|
|
Technical details for PIMMS CY12 files
are given on the CalDB Proposal Planning web pages under
http://cxc.harvard.edu/caldb4/prop_plan/pimms/pimms.html
<Return to CalDB Release Notes>