CalDB 4.7.9 Public Release Notes
Public Release Date: 28 JUN 2018
NOTICE: CalDB 4.7.9 will not be installed in Standard Data Processing until a subsequent CalDB upgrade is released; the new files included below are not used in SDP.
I. INTRODUCTION
CalDB 4.7.9 is an upgrade to the Chandra CalDB, which includes the following items:
For the CIAO 4.10 / CalDB 4.7.9 release notes see How CalDB 4.7.9 Effects Your Analysis.
II. SUMMARY OF CHANGES
A. ACIS CONTAM version N0011
| Location: | $CALDB/data/chandra/acis/contam/ |
| Filename: | acisD1999-08-13contamN0011.fits |
The ACIS Calibration Team continues to monitor and react to variations in the effects of the Optical Blocking Filter (OBF) contamination layer with mission elapsed time. Most recently, it has come to their attention that the current CONTAM model file in CalDB (version N0010) is overestimating the effect since early 2018, particularly for ACIS-I, and still significantly for ACIS-S. While a modification for the ACIS-S model is still under development, the calibration team has elected to release an upgrade to the ACIS-I configuration's CONTAM model with the version N0011 file listed above.
Additionally, while the ACIS-S model remains unchanged, the time base for all ten chips included in CONTAM N0011 has been extended to the end of Calendar Year 2021, to allow for predictive effective area estimates for proposal planning purposes and the like. See the technical details section below for further information on the upgrade to the ACIS-I model, as well as the updated time base.
See the why page for more general information on the ACIS OBF.
CIAO SCRIPTS/TOOLS AFFECTED:
See the script fluximage, which uses mkinstmap
See the script specextract, which uses mkwarf
See the script fullgarf, which uses mkgarf
THREADS AFFECTED:
For exposure-corrected imaging analysis with ACIS, see the threads:
- Single Chip ACIS Exposure Map and Exposure-corrected Image
- Multiple Chip ACIS Exposure Map and Exposure-corrected Image
For imaging spectroscopy with ACIS, see the threads:
- Extract Spectrum and Response Files for a Pointlike Source
- Extract Spectrum and Response Files for an Extended Source
- Extract Spectrum and Response Files for Multiple Sources
For grating spectroscopy with ACIS, see the threads:
B. HRC-I QE version N0011
| Location: | $CALDB/data/chandra/hrc/qe/ |
| Filenames: | hrciD1999-07-29qeN0011.fits hrciD2000-07-23qeN0011.fits hrciD2001-04-19qeN0011.fits hrciD2001-10-16qeN0011.fits hrciD2002-04-14qeN0011.fits hrciD2002-10-25qeN0011.fits hrciD2003-04-25qeN0011.fits hrciD2003-10-06qeN0011.fits hrciD2004-04-05qeN0011.fits hrciD2004-11-05qeN0011.fits hrciD2005-05-15qeN0011.fits hrciD2005-11-01qeN0011.fits hrciD2006-04-25qeN0011.fits hrciD2006-11-21qeN0011.fits hrciD2007-09-16qeN0011.fits hrciD2008-09-11qeN0011.fits hrciD2009-09-15qeN0011.fits hrciD2010-09-16qeN0011.fits hrciD2011-09-29qeN0011.fits hrciD2012-09-29qeN0011.fits hrciD2013-10-05qeN0011.fits hrciD2014-10-03qeN0011.fits hrciD2015-08-09qeN0011.fits hrciD2016-06-15qeN0011.fits hrciD2017-02-20qeN0011.fits hrciD2017-08-20qeN0011.fits |
It has been known for some time that the HRC-I quantum efficiency has been declining systemmatically, and considerably more rapidly since ~2011 or so. Up until now, there has been no time-dependent correction for the mean QE for HRC-I. It has become timely therefore to release the above time-displaced HRC-I mean QE files into the CalDB to correct for this decline. See the technical details section below for more details on the nature and derivation of these QE corrections.
CIAO SCRIPTS/TOOLS AFFECTED:
See the script fluximage, which uses mkinstmap
THREADS AFFECTED:
For exposure-corrected imaging analysis with HRC-I, see the thread:
HRC-I Exposure Map and Exposure-corrected Image
C. HRC-S QE Uniformity N0009
| Location: | $CALDB/data/chandra/hrc/qeu/ |
| Filenames: | hrcsD1999-07-22qeuN0009.fits hrcsD2000-01-01qeuN0009.fits hrcsD2001-01-01qeuN0009.fits hrcsD2002-01-01qeuN0009.fits hrcsD2003-01-01qeuN0009.fits hrcsD2004-01-01qeuN0009.fits hrcsD2005-01-01qeuN0009.fits hrcsD2006-01-01qeuN0009.fits hrcsD2007-01-01qeuN0009.fits hrcsD2008-01-01qeuN0009.fits hrcsD2009-01-01qeuN0009.fits hrcsD2009-08-08qeuN0009.fits hrcsD2010-09-14qeuN0009.fits hrcsD2012-03-29qeuN0009.fits hrcsD2012-10-05qeuN0009.fits hrcsD2013-09-21qeuN0009.fits hrcsD2015-02-17qeuN0009.fits hrcsD2016-02-22qeuN0009.fits hrcsD2016-07-28qeuN0009.fits hrcsD2017-01-23qeuN0009.fits hrcsD2017-06-05qeuN0009.fits hrcsD2017-09-26qeuN0009.fits hrcsD2018-01-19qeuN0009.fits |
Within the past year, the LETGS calibration team has recognized an accelerated rate of decay in the quantum efficiency as a function of wavelength (i.e. displacement along the length of the HRC-S three-plate detector array. Hence they have elected to replace the current set of time dependent QE Uniformity (QEU) files (version N0008) with a new set of files, version N0009. Furthermore, the new set extends in effective dates only through January 2018, and the predictive QEU files extending from 2019-2022 have been removed from the CalDB distribution and the index. See the technical details section below for illustrations and details of the derivation of these new QE Uniformity corrections.
See also the why page for more general information on the HRC-S QE/QEU corrections in the CalDB.
CIAO SCRIPTS/TOOLS AFFECTED:
See the script fluximage, which uses mkinstmap
THREADS AFFECTED:
For exposure-corrected imaging analysis with HRC-S, see the thread:
For grating spectroscopy with the LETG/HRC-S, see the thread:
III. TECHNICAL DETAILS
A. ACIS CONTAM version N0011
The ACIS Calibration team has generated some modifications to the ACIS-I portion of the CONTAM file in CalDB, being released in version N0011. The issue has been that the previous N0010 version of the model over-estimates the contamination layer effect since early 2018, and extending back somewhat into late 2017. Using calibration sources such as Abell 1795 (and then confirming with E0102-72.3) observations taken regularly since the beginning of the mission, we have found that the new ACIS-I model gives consistent results for these essentially non-varying sources.
The model has the same spatial dependence as in the previous release. The spectral transmission models are the same as well for the elements C, O, and F. The time dependences of the F and O components are generally based on fits to the F-K and O-K edges from LETG/ACIS-S spectra of blazars and particularly from recent 'big dither' data involving observations of Mk 421. The C-K time dependence was determined from fits to ACIS-I spectra of Abell 1795. Due to apparent under-correction for energies above the F-K edge (at 0.7 keV) since 2015, the rise in the F optical depth after 2015 was increased gradually with time over that which was fit to the ACIS-S data.
We show the effective areas (EAs) for mid-cycles of AO-1 (2000), CY-11 (2010), CY-17 (2016), and finally CY-19 (2018, the current epoch) in Fig. 1 below. While the 2000, 2010, and 2016 cases show little change in the EA, for 2018 the contamination effect is reduced considerably, and this is found to help with model fitting of the most recent ACIS-I data. (Note that difference plots are shown in Figure 2 below.) This occurs without altering the fitting results from early observations signficantly at all. Hence the release of the new ACIS-I model.
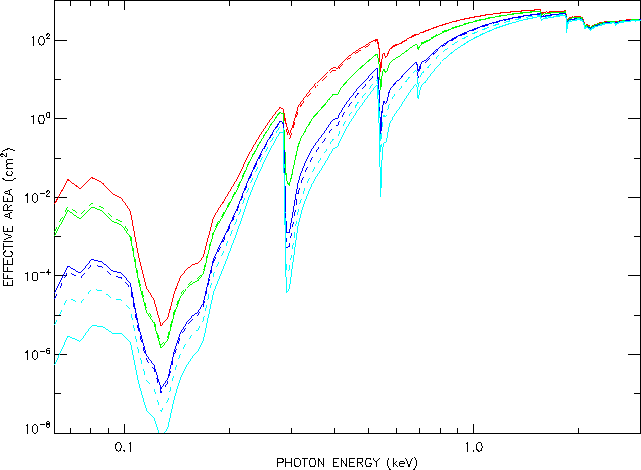
Fig. 1: The effective areas from CONTAM N0011 (dashed curves) compared with those from CONTAM N0010 (solid) for the ACIS-I3 aimpoint. The top two curves (red) are for mid-cycle of year 2000, the green for 2010, blue 2016, and cyan 2018 are the bottom two curves. |
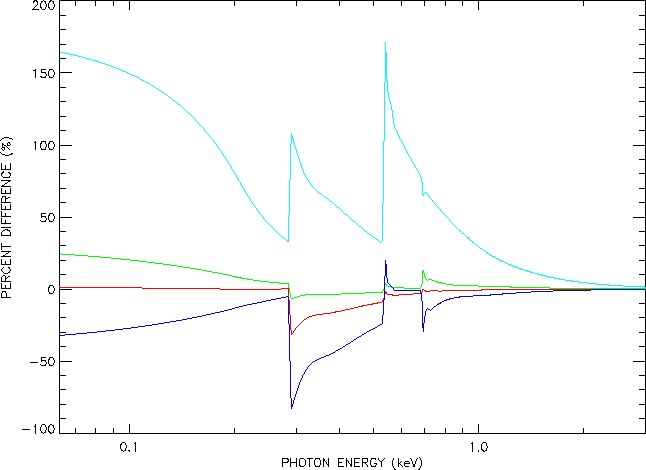
Fig. 2: The percent differences (relative to the average of the two) of the curves in Fig. 1. A positive value means the EA is higher for the N0011 case, meaning a reduction in the contamination effect in N0011 versus N0010. |
The changes in the specific TAU0, and TAU1 values are illustrated in Figures 3a and 3b below. For ACIS-S, the model remains the same; however we have extended the time base for CONTAM in both the I and S arrays, identically, until the end of calendar year 2021. This will allow predictive EAs to be generated for future proposal cycles through Cycle 22 (anticipated for December 2020).
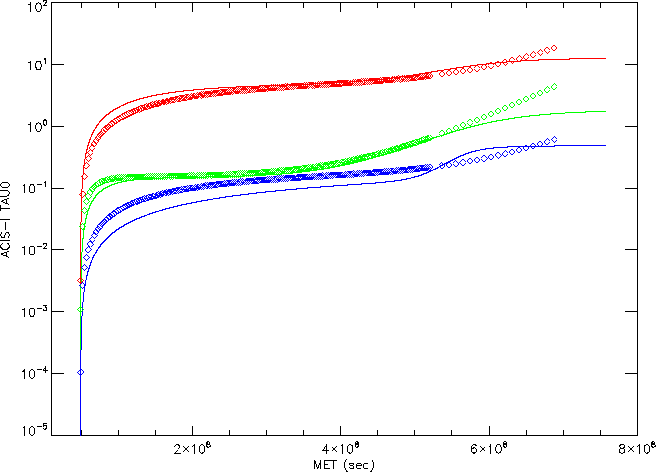
Fig. 3a: The alterations made to the N0011 time-dependent optical depth TAU0 compared with those of N0010 for ACIS-I. The extension of the time-base is also visible. |
|
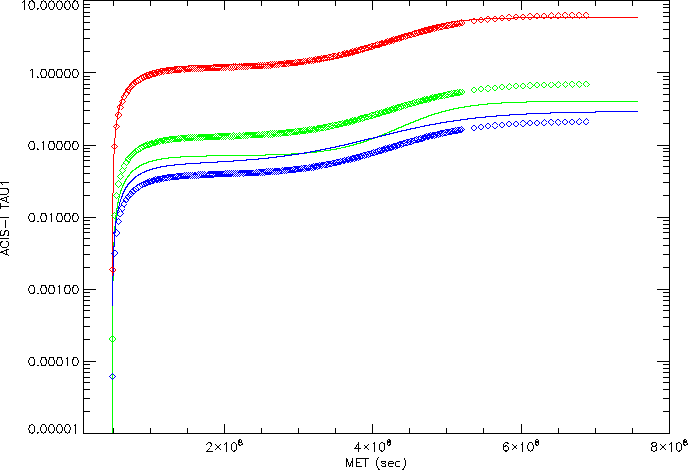
Fig. 3b: The alterations made to the N0011 time-dependent optical depth TAU1 compared with those of N0010, again for ACIS-I. |
|
|
|
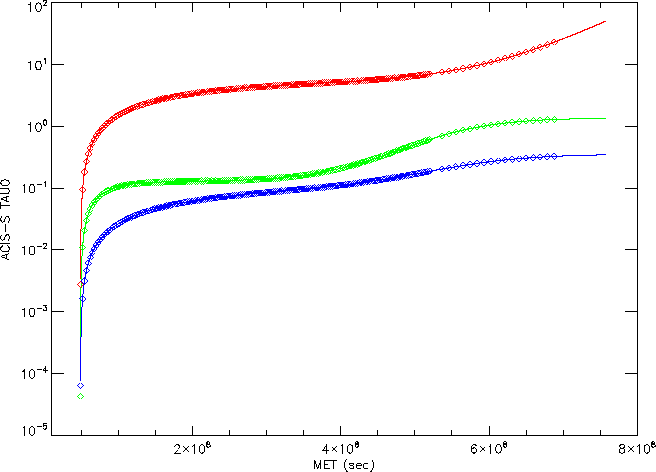
Fig. 3c: The extension of the time base for ACIS-S used in CONTAM file N0011 (curves) compared with that of CONTAM N0010 (diamond symbols), in the TAO0 optical depths. |
|

Fig. 3d: The extension of the time base (again for ACIS-S) used in CONTAM file N0011 (curves) compared with that of CONTAM N0010 (diamond symbols), in this case with the TAO1 optical depths. |
There is also known deviation of the CONTAM effect in the ACIS-S array since late 2017-early 2018; however the correction for that model is taking the calibration team some more time complete. A calibration database upgrade is anticipated for later in calendar year 2018, and it is hoped that the ACIS-S modifications will be ready for this later release, the date for which has not yet been determined. Stay tuned!
B. HRC-I QE version N0011
As with the HRC-I gain map, the quantum efficiency (QE) has been known to be decaying with time particularly since year 2011, as shown in Figure 4 below. For the first time, the HRC-I Calibration Team is releasing time-dependent corrections for this effect, as a series of 26 new time-displaced QE files in CalDB for the HRC-I. The files are annually displaced from 1999 through 2008, but become timed with the HZ 43 calibration source observations after the more rapid decay commences. Note there is a small offset seen with the old N0010 QE file, that is also corrected with the new N0011 datasets.
Fig. 4 below gives the measured count rate relative to that predicted by the fiducial HZ 43 model used as the LETGS flux calibration standard, in the HRC-I/LETG zeroth order. The source has been regularly observed in this configuration since the beginning of the mission. The HRC calibration team has elected to correct for the decrease, as well as an existing offset between launch date and ~2007, using a series of new HRC-I QE files with time-displaced effective dates, which are determined by the dates of the HZ43 observations. See the Summary of Changes Section B above for the filenames, which include the effective dates. The new set of files effectively removes the apparent decline in the HZ43 count rate since 2011, as well as the early mission offset, as shown in the figure.
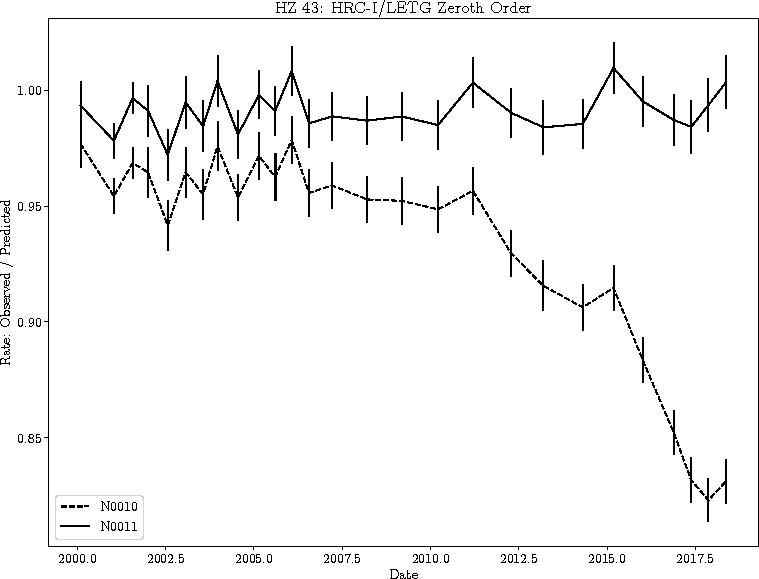
Fig. 4: Measured count rates from the LETG/HRC-I zeroth order, placed at the aimpoint of HRC-I, normalized to the predicted count rate as determined by the fiducial HZ 43 model. |
C. HRC-S QE Uniformity N0009
A new set of calibrations for the HRC-S QE Uniformity has been released by the Cal group. (For HRC-S, the time-dependence of the quantum efficiency has been absorbed into the QEU, as there are secular variations along the length of the array.)
Incorporating the latest HZ 43 observations into the calibration, the best-fit post HV change (2012-03-29 and onwards) QE decline has been updated from 2.40 -> 2.49% / year for zeroth order, and from 2.02 -> 2.27% per year for dispersed orders.
After 2009, additional wavelength-dependent empirical corrections are necessary for dispersed orders. The attached plots show observed deviations from the fiducial HZ 43 model for each calibration observation, as well as the derived continuous autoregressive-moving-average model which was applied to S1 (black) and S3 (red) for that observation's QEU file.
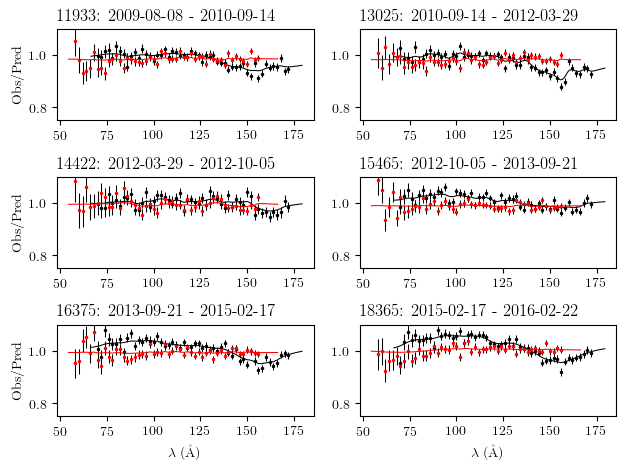
Fig. 5: Observed deviations from the HZ 43 fiducial model for a series of observations since 2009, when empirical
corrections became necessary for dispersed orders. These data were used to derive the new QEU files.
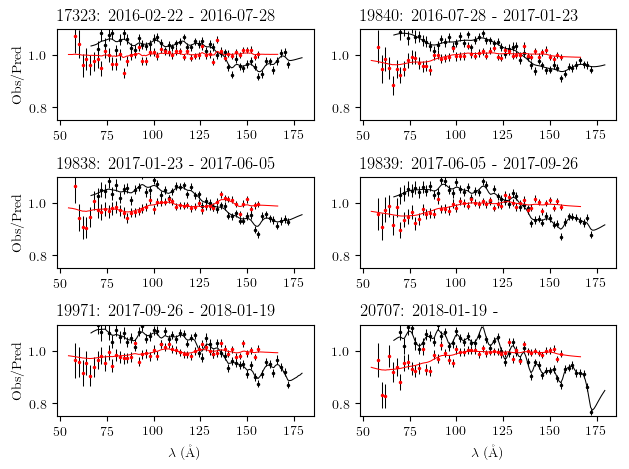
Fig. 6: Continuing from Figure 5, with observations extending from 2016 through early 2018.