CalDB 4.7.4 Public Release Notes
Public Release Date: 04 MAY 2017
SDP Installation Date: 2017-05-04T18:22:52 (UTC)
I. INTRODUCTION
CalDB 4.7.4 is an upgrade to the Chandra CalDB, which includes the following items:
- ACIS T_GAIN Epochs 67 + 68
- HRC-I QE Version 10
- HRC-S BADPIX Version 4
- HRC-S QEU Version 8
- FILES BEING RETIRED from the DISTRIBUTION
For the CIAO 4.9 / CalDB 4.7.4 release notes see How CalDB 4.7.4 Affects Your Analysis.
II. SUMMARY OF CHANGES
A. ACIS T_GAIN Epochs 67 + 68
| Location: | $CALDB/data/chandra/acis/t_gain/ |
| Filenames: | acisD2016-05-02t_gainN0005.fits acisD2016-05-02t_gainN0006.fits acisD2016-11-01t_gainN0002.fits acisD2016-11-01t_gain_biN0002.fits |
The ACIS Calibration team has released new time-dependent gain corrections derived from the External Calibration Source (ECS) during quarterly Epochs 67 (August-October 2016) and 68 (November 2016-January 2017), which have been combined to obtain sufficient counting statistics. With this release, the combined epoch 65 + 66 CalDB files may be finalized. Users with observations taken between 2016-02-01 and 2016-11-01 are advised to reprocess with their data with finalized versions of the applicable T_GAIN files.
Users with observations taken since 2016-11-01 will have access to an updated provisional T_GAIN file (one of the version N0002 filenames above); They will not however have a finalized file until after Epoch 70 (May-Jul 2017) is completed.
Hence, observations with DATE-OBS as given in Table 1 below will have these T_GAIN files applied to them:
| DATE-OBS Range | T_GAIN Filename | DATAMODE | EPOCH1 (MET, s) |
CVSD* (UTC) |
EPOCH2 (MET, s) |
CVED* (UTC) |
| 2015-11-01 - 2016-05-02 | acisD2015-11-01t_gainN0005.fits acisD2015-11-01t_gainN0006.fits |
GRADED, CC33_GRADED FAINT, VFAINT, CC33_FAINT |
566697668.184 | 2015-11-01T00:00:00 | 578534468.184 | 2016-06-02T00:00:00 |
| 2016-05-02 - 2016-11-01 | acisD2016-05-02t_gainN0005.fits acisD2016-05-02t_gainN0006.fits |
GRADED, CC33_GRADED FAINT, VFAINT, CC33_FAINT |
578534468.184 | 2016-05-02T00:00:00 | 594345668.684 | 2016-12-01T00:00:00 |
| 2016-11-01 - | acisD2016-11-01t_gainN0002.fits acisD2016-11-01t_gain_biN0002.fits |
GRADED, CC33_GRADED FAINT, VFAINT, CC33_FAINT |
594345668.684 | 2016-11-01T00:00:00 | 610113669.184 | N/A |
| DEPROCATED FILES: | acisD2016-02-01t_gainN0002.fits acisD2016-02-01t_gain_biN0002.fits |
GRADED, CC33_GRADED FAINT, VFAINT, CC33_FAINT |
578534468.184 | 2016-02-01T00:00:00 | 594345668.684 | 2016-02-01T00:00:00 |
With the current T_GAIN upgrades, the CXC is implementing a modification to the ACIS T_GAIN CalDB files, wherein the Calibration Validity Start Date is being set equal to the UTC conversion of the EPOCH1 value in the file header, rather than the beginning of the period of the calibration data. This prevents the files from being used in an extrapolation mode between the beginning of the epoch and the EPOCH1 value, which had been the previous policy.
For basic information concerning the ACIS Time-dependent Gain Correction, See ACIS Time-dependent Gain why page. For a more detailed explanation, see the Technical Details section below.
PIPELINES/TOOLS AFFECTED:
ACIS Level 1 pipeline tool acis_process_events.
CIAO script chandra_repro uses acis_process_events to reprocess ACIS observation data.
THREADS AFFECTED:
Reprocessing Data to Create a New Level=2 Event File
B. HRC-I QE Version 10
| Location: | $CALDB/data/chandra/hrc/qe/ |
| Filename: | hrciD1999-07-22qeN0010.fits |
The HRC-I QE has been maintained via cross-calibration between the HRC-I and the LETGS (LETG/HRC-S) for some time (since CalDB 2.17, released 2002-10-01.) As a result of the HRC-S QEU modifications included in this release, an incumbent change to the HRC-I QE is also ready for release. For calibration details see the technical details section below.
PIPELINES/TOOLS AFFECTED:
The CIAO script fluximage, which uses the tool mkinstmap.
THREADS AFFECTED:
HRC-I Exposure Map and Exposure-corrected Image
C. HRC-S BADPIX Version 4
| Location: | $CALDB/data/chandra/hrc/badpix/ |
| Filename: | hrcsD1999-07-22badpixN0004.fits |
The above modified HRC-S BADPIX map has been released to mitigate issues with "vestigial" events near the plate gaps when the LETGS configuration is used. The old (N0003) BADPIX file for HRC-S already excludes data from three of the six plate edges, due to the CsI photocathode coating not extending to those edges; however the remaining three edges were not excluded before, in hopes that events located there might be found useful. This has not panned out in practice, and the LETGS team has recommended the remaining plate edges be excluded as well.
The LETGS team has further discovered that events near the plate edges have been being mis-located due to a failure of the DEGAP solution, as well as having distorted pulse-height distributions. An improved DEGAP Lookup Table is in preparation; however most of these residual events may be excluded at this point by further improvements in the BADPIX file for HRC-S. See the Technical Details section below for further information.
PIPELINES/TOOLS AFFECTED:
HRC Level 1 processing, which includes hrc_build_badpix, which uses the CalDB BADPIX file to generate an observation-specific hrcf*_bpix1.fits file. The HRC L1 event processing tool hrc_process_events uses the *bpix1 file to set bit 17 in the STATUS field. The HRC-S/grating pipeline then uses the hrcf*_bpix1 file in hrc_build_mask, which generates the standard output file hrcf*_msk1.fits.
The CIAO script chandra_repro includes the tool hrc_build_badpix as well as hrc_process_events. However, since hrc_build_mask is not part of standard CIAO, the *_msk1.fits file cannot be regenerated in CIAO. Hence the original *_msk1.fits file must be used in the threads as needed.
The CIAO script mktgresp uses both the *bpix1 and *msk1 files to generate LETGS grating responses (GARFs and GRMFs). These files are also needed in mkinstmap to generate exposure maps and fluxed images.
THREADS AFFECTED:
For LETGS grating responses: LETG/HRC-S Grating ARFs (and RMFs)
For HRC-S exposure maps: HRC-I Exposure Map and Exposure-corrected Image
D. HRC-S QEU Version 8
| Location: | $CALDB/data/chandra/hrc/qeu/ |
| Filenames: | hrcsD1999-07-22qeuN0008.fits hrcsD2000-01-01qeuN0008.fits hrcsD2001-01-01qeuN0008.fits hrcsD2002-01-01qeuN0008.fits hrcsD2003-01-01qeuN0008.fits hrcsD2004-01-01qeuN0008.fits hrcsD2005-01-01qeuN0008.fits hrcsD2006-01-01qeuN0008.fits hrcsD2007-01-01qeuN0008.fits hrcsD2008-01-01qeuN0008.fits hrcsD2009-01-01qeuN0008.fits hrcsD2010-01-01qeuN0008.fits hrcsD2011-01-01qeuN0008.fits hrcsD2012-01-01qeuN0008.fits hrcsD2012-03-29qeuN0008.fits hrcsD2013-01-01qeuN0008.fits hrcsD2014-01-01qeuN0008.fits hrcsD2015-01-01qeuN0008.fits hrcsD2016-01-01qeuN0008.fits hrcsD2017-01-01qeuN0008.fits hrcsD2018-01-01qeuN0008.fits hrcsD2019-01-01qeuN0008.fits hrcsD2020-01-01qeuN0008.fits hrcsD2021-01-01qeuN0008.fits hrcsD2022-01-01qeuN0008.fits hrcsD2023-01-01qeuN0008.fits |
Cuncurrent with the updates to the HRC-S BADPIX map, the HRC-S QEU files have been modified to extend their resultant grating ARFs to the full range of good LETGS PHA2 spectral data. The HRC-S net quantum efficiency is time-varying, and hence the QEU files include annually spaced files, which account for a consistent ~0.5% per year drop in the QE across the first-order LETG spectrum since the mission launch. One extra QEU file is included for March 29th, 2012, when the HRC-S high-voltage was adjusted to recover some lost gain. The new N0008 file set includes three extra projected years (2020 through 2023). See the technical details section below.
To generate the appropriate exposure maps or grating ARFs, the N0008 QEU files should be used in tandem with the new HRC-S BADPIX N0004 file, included in this release. Hence, if the N0004 BADPIX has NOT been applied in processing of your data, chandra_repro should be run before proceeding with analysis using the new QEU N0008 files.
For basic introduction to the HRC-S QE/QEU, see the links at the HRC-S QE / QE Uniformity why page.
PIPELINES/TOOLS AFFECTED:
The CIAO tool fluximage, which employs mkinstmap.
The CIAO tool mktgresp, which generates LETGS grating ARFs and RMFs.
THREADS AFFECTED:
For LETGS grating responses: LETG/HRC-S Grating ARFs (and RMFs)
For HRC-S exposure maps: HRC-I Exposure Map and Exposure-corrected Image
E. FILES BEING RETIRED from the DISTRIBUTION
| Location: | $CALDB/data/chandra/acis/t_gain/ |
| Filenames: | acisD2015-02-01t_gainN0002.fits acisD2015-02-01t_gain_biN0002.fits acisD2015-05-01t_gainN0002.fits acisD2015-05-01t_gain_biN0002.fits acisD2015-08-01t_gainN0002.fits acisD2015-08-01t_gain_biN0002.fits acisD2015-11-01t_gainN0002.fits acisD2015-11-01t_gain_biN0002.fits |
The above T_GAIN files are versions "N0002", which means that they are provisional, non-interpolating files used as temporary substitutes for the finalized T_GAIN files (versions N0005 for GRADED data modes, and versions N0006 for non-GRADED). These files are routinely removed from the distribution after they have been included for a minimum of one year. If your observation data have been processed with any of the above files, i.e. the header keyword TGAINFIL in the *evt2* file(s) is set to one of the above filenames, you should reprocess your data with an updated CalDB.
| Location: | $CALDB/data/chandra/hrc/qeu/ |
| Filenames: | hrcsD1999-01-01qeuN0006.fits hrcsD2000-01-01qeuN0006.fits hrcsD2001-01-01qeuN0006.fits hrcsD2002-01-01qeuN0006.fits hrcsD2003-01-01qeuN0006.fits hrcsD2004-01-01qeuN0006.fits hrcsD2005-01-01qeuN0006.fits hrcsD2006-01-01qeuN0006.fits hrcsD2007-01-01qeuN0006.fits hrcsD2008-01-01qeuN0006.fits hrcsD2009-01-01qeuN0006.fits hrcsD2010-01-01qeuN0006.fits hrcsD2011-01-01qeuN0006.fits hrcsD2012-01-01qeuN0006.fits hrcsD2013-01-01qeuN0006.fits hrcsD2014-01-01qeuN0006.fits |
The above version N0006 HRC-S QEU files were originally released in CalDB 4.4.5 on 2011-06-30. Since that time, they have been upstaged twice, including by versions N0007 with CalDB 4.6.5 (2014-12-16), with versions N0008 in this release (CalDB 4.7.4). With the permission of the LETGS Calibration team, the above files will no longer be circulated with the CalDB, and should no longer be used.
III. TECHNICAL DETAILS
A. ACIS T_GAIN Epochs 67 + 68
The ACIS T_GAIN epoch 67+68, combining two quarterly epochs, and covering the period of August 2016 through January 2017 has recently been completed, and the ACIS External Calibration Source (ECS) radiation zone data has been reduced as per some modified procedures, to generate the time-dependent gain correction tables for this epoch. The procedural modifications were made to address the decreasing statistics available from the ECS due to its natural decay in count rates. The two epochs are being combined to produce a single new T_GAIN correction update.
The original method of derivation for the ACIS T_GAINs is given in the memorandum "Corrections for time-dependence of ACIS gain", posted on ACIS Calibration web page ACIS TGAIN.
The magnitudes (in eV) of the new gain corrections, versus photon energy, are given in Figs. 1-3 below. The corrections are of the usual order in magnitude, specifically less than 2.0% of the photon energy value. Fig. 1 below gives the corrections for the ACIS-I aimpoint on chip ACIS-3, for the CTI-corrected case, which is the only one applicable to FI chips. Figure 2 gives the corrections for the ACIS-S aimpoint on ACIS-7, for the case where the BI chips are CTI-corrected. Finally Fig. 3 gives the corrections for ACIS-7 for NON-CTI-corrected BI chips. These would be relevant to GRADED DATAMODE observations with ACIS-S, for example.
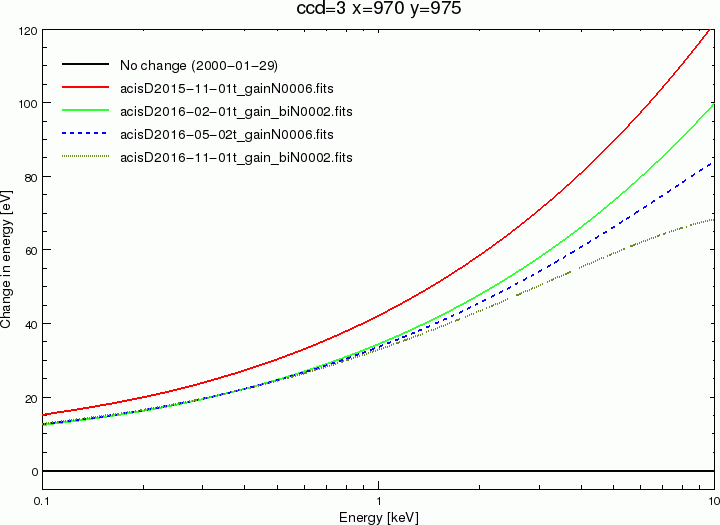
Fig. 1: Time dependent gain corrections versus photon energy for the ACIS-I aimpoint on
ACIS-I3 (CHIPX=970, CHIPY=975) for the new and recent comparable T_GAIN files in CalDB.
The parallel CTI correction for the FI chips has been applied to all data.
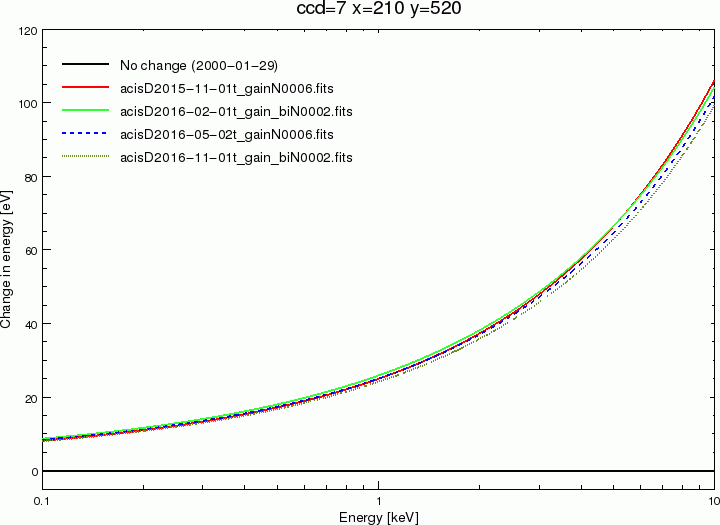
Fig. 2: Time-dependent gain corrections versus energy for the ACIS-S aimpoint on ACIS-7
(CHIPX=210, CHIPY=520) for the new and recent comparable CalDB T_GAIN files. For these data,
the series and parallel CTI correction for the BI chips has been applied.
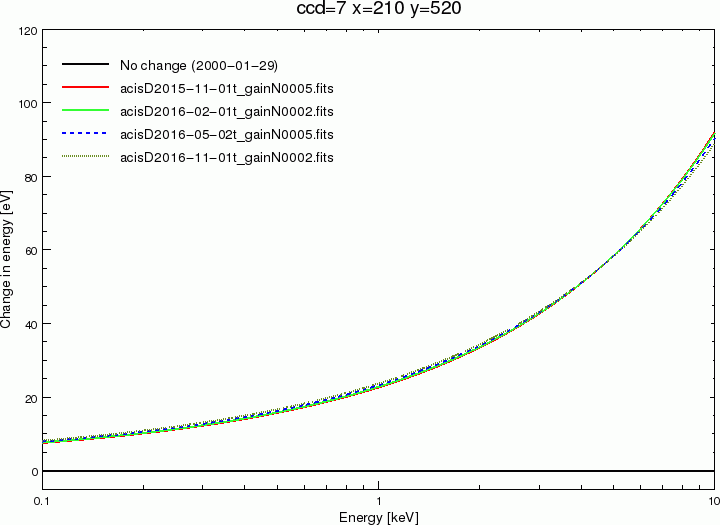
Fig. 3: T_GAIN correctons versus energy for the ACIS-S aimpoint on ACIS-7, this time with
no CTI correction applied to the data, as would be the case for GRADED DATAMODE observations.
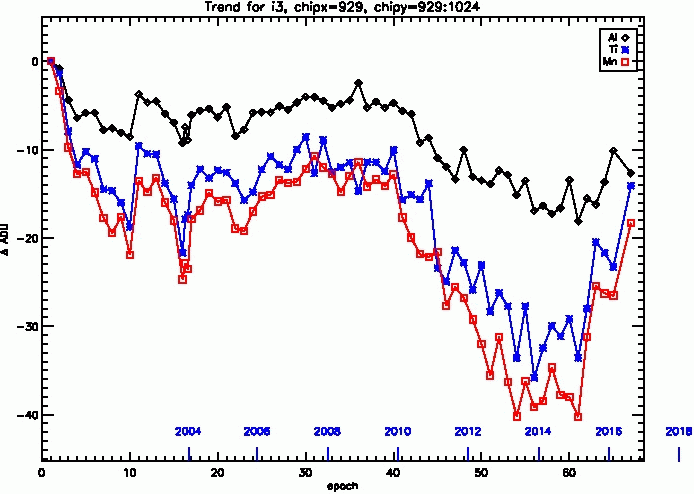
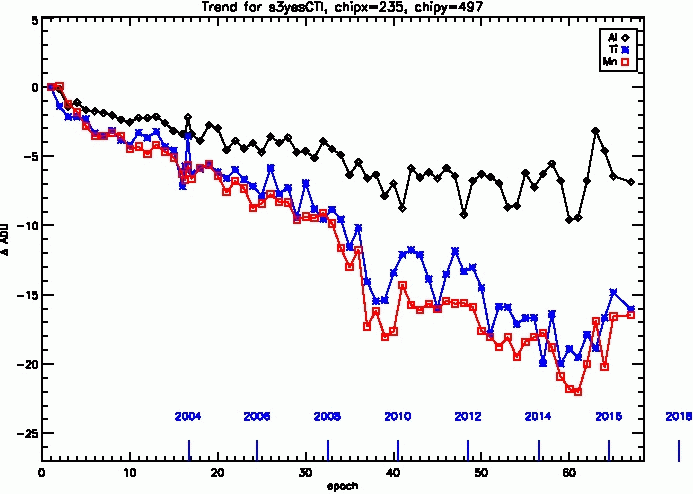
Long term trends for chips I3 and S3 are plotted below in Figure 4a and b, through Epoch 67+68, which includes the latest release. The chip locations for these plots are given in the respective labels above the plots. The chip locations selected are near the aimpoints, as with Figs 1 and 3 above. The full CTI correction has been applied to the data in both figures.
Figures 1 and 4a show a strong reduction in the T_GAIN correction at high photon energies for the most recent epochs. This seems to correlate with the increased particle background rate which corresponds with the current decrease in solar activity. This is not unexpected for the FI chips, which are more affected by the particle background. Note that this trend is not nearly as evident in the BI chips (Figs. 2, 3, and 4b), which is also to be expected.
|
|
| Figs 4a and 4b: Long term gain trends for specific ECS line energies from Epoch 1 to Epoch 67+68 inclusive, and for the positions on the respective chips given in the figure labels. (Click on images to expand the plots.) | |
B. HRC-I QE Version 10
There is an interim update to the HRC-I QE to bring the resultant calibrated fluxes closer to those of the HRC-S. The current HRC-I QE (N0009) produces fluxes that are approx 20% below the updated HRC-S QE early in the mission and then the EA from there. The Cal team has managed to account for about 15% of the change -- 10% comes from an ad hoc correction that was included in 2011, and 4-5% from using a larger source region. They have decided to (a) remove the original ad hoc correction, and (b) make a smaller 5% ad hoc adjustment in the opposite direction, which brings the HRC-I flux within a few percent of the HRC-S flux at low E before 2006. The LETGS team has also had indications from comparisons of simultaneous observations of RT Cru with SWIFT that the high-E QE is overestimated, though the exact measure is hard to pin down because of the lack of spectral resolution in the HRC-I. In any case, this correction will keep the high-E QE within a couple percent of the previous version. Hence HRC-I QEU version N0010 is being released.
Figure 5 below gives a plot of the counts-to-model ratio for a HZ43 observations using the LETG Zeroth Order on HRC-I (taken approximately annually, for calibration purposes). Evident is the ~15% overestimated model for the N0009 QE over years 2000-2006, and a much better ratio over the same period for the new N0010 QE being released herewith.
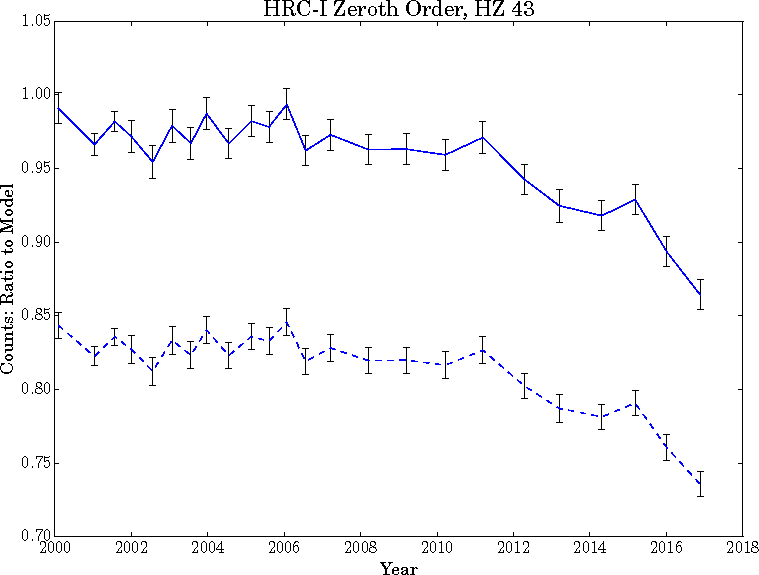
Fig. 5: The HRC-I/LETG HZ 43 zeroth order rates compared to those predicted by the WD model.
The solid line are responses generated using the new HRC-I N0010 QE, and dashed line for those
using the previous N0009 QE.
C. HRC-S BADPIX Version 4
The LETGS Calibration Team has been aware for some time that there were problems with the instrumental effective area near the plate gaps, and have released new analysis of these issues. Their results are currently posted at the following sites, whence suggestions for changes to the HRC-S BADPIX file have been derived:
From the SUMMARY section of the "HRC-S BADPIX STUDY" page, we have the following:
- The high event densities on the edges of taps 66, 125, and 128 are caused by events in
real space being crammed into a narrower range of RAWY pixels, not by an intrinsically
higher rate of background emission. While it is theoretically possible to stretch out
those events via the degapping procedure, this would require a major change to the degap
map (higher order polynomials and two-dimensional coordinate transformations instead of
two one-D maps) and there would still be a significant loss of imaging resolution.
- The sloping "foothills" rising toward the peaks at the edges are presumably also the result of poor position conversions and should be smoothed out in CHIP coordinates by revised degapping.
- V amplifier saturation, flagged by status bit 29, affects a higher proportion of events at plate ends than elsewhere. This saturation distorts pulse height distributions above PHA=142. Pulse height distributions in the problematic regions also tend to have an anomalous peak at low PHA values.
- Events with CRSV=64 should be removed by badpix/bpix filtering but are not, suggesting a problem with RAW-to-CHIP coordinate conversion in hrc_build_badpix. Those events have extremely large position errors, but only a very small fraction of events are affected.
The LETGS team has generated a badpix map that adjusts the two specs suggested in the HRC-S Badpix Study link above, as follows:
- RAWX=581:3504 RAWY=16384:17066, formerly 581:3504 16384:16978
- RAWX=581:3504 RAWY=32171:32979, formerly 581:3504 32250:32928
Otherwise the map is unchanged from version N0003, preserving historical continuity and information, specifically three hot pixel regions that are now made redundant with the above changes. In the future, with an improved DEGAP model, for example, the newly-excluded regions might be re-activated, and knowledge of the presence of those hot spots would be critical.
D. HRC-S QEU Version 8
The HRC-S QEU upgrade, concurrent and mutually dependent on the BADPIX update, is designed to cover the full range of the available PHA2 spectrum of the LETGS. The new data sets were derived as a result of the HRC-S near-edge BADPIX Study, discussed in the previous section.
See also the LETG page Wavelength Coverage Adjustments at HRC-S Plate Ends.Figure 6 below gives HRC-S/LETG observed HZ 43 rates, compared to those predicted by the fiducial HZ 43 model used as the LETGS flux calibration standard. The colors are red and black for negative and positive dispersed orders, respectively, and blue for zeroth order. Solid lines are using responses generated with the new N0008 QEU. Dashed lines are from QEU N0005, which did not correct for the secular decline. For the new QEU we have included all new HZ 43 observations after 2011, in order to re-derive the wavelength-independent slopes.
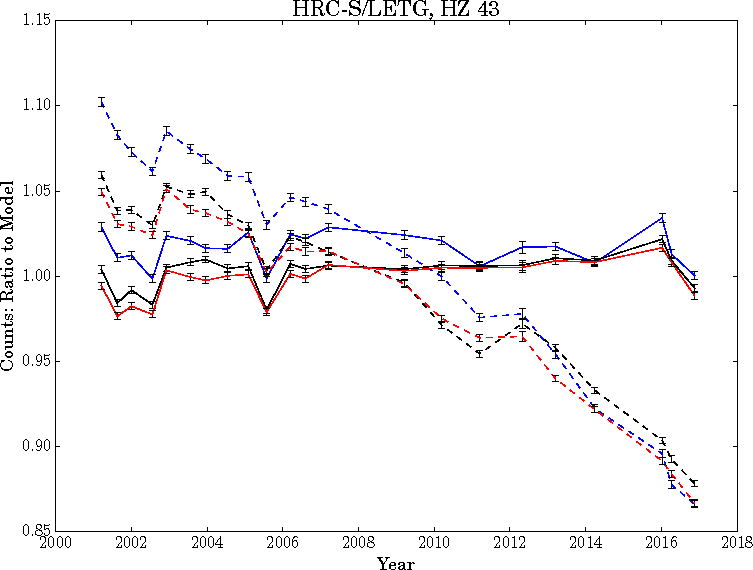
Fig. 6: The HRC-S/LETG HZ 43 zeroth order rates compared to those predicted by the WD model.
Figure 7 below gives the LETGS effective areas for positive (black) and negative (red) first orders for an HZ43 observation taken in 2016. The solid curves are the ones derived from the new N0008 QEU; the dashed are derived from the N0007 QEU. Note the changes in the wavelength-space positions of the plate gaps and edges for the negative spectrum by comparing the corresponding solid and dashed curves.
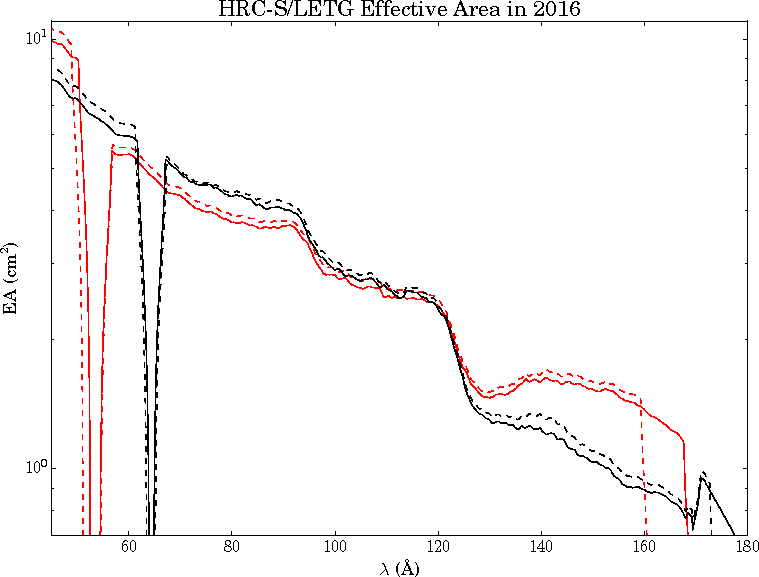
Fig. 7: This is an example of the new QEU, compared to the previous, for an observation
in 2016. Red and black solid lines are negative and positive responses, respectively,
generated using the N0008 QEU. Dashed lines are from responses generated using the previous N0007 QEU.