CalDB 4.6.9 Public Release Notes
Public Release Date: 23 SEP 2015
SDP Installation Date: See CalDB 4.6.10a Release Notes.
I. INTRODUCTION
CalDB 4.6.9 is an upgrade to the Chandra CalDB, which includes the following items:
- ACIS T_GAIN Epoch 62, with finalizations for Epoch 61
- ACIS DET_GAIN and P2_RESP N0007 with modified S1 data
- LETGS +/-1st Order LSFPARM N0004 Files
- HRC-S QE N0014 Files
- HRC-I QE N0009 File
- ACIS GROUP F BKGRND DTCOR Correction
For the CIAO 4.7 / CalDB 4.6.9 release notes see How CalDB 4.6.9 Affects Your Analysis.
II. SUMMARY OF CHANGES
A. ACIS T_GAIN Epoch 62, with finalizations for Epoch 61
| Location: | $CALDB/data/chandra/acis/t_gain |
| Filenames: | acisD2014-11-01t_gainN0005.fits acisD2014-11-01t_gainN0006.fits acisD2015-02-01t_gainN0002.fits acisD2015-02-01t_gain_biN0002.fits |
The periodic ACIS T_GAIN correction upgrade for May-Jul 2015 (Epoch 62) has been released. Modifications have also been made to the previously released Epoch 61 T_GAIN corrections (Feb-Apr '15). The corrections are at nominal/expected levels of less than 4% of the energy value. This upgrade as usual affects observation data taken over the two most recent T_GAIN Epochs (61 and 62), and so would update PHAs for OBS_IDs taken since 01 Feb 2015. Users with such datasets are encouraged to revalidate their analysis results after reprocessing their data with the upgraded CalDB files. For specific details of the new calibrations in this release, see the technical details section below.
See the ACIS T_GAIN why page for more information.
PIPELINES/TOOLS AFFECTED:
DS and CIAO level 1 (re)processing tool acis_process_events
Also: CIAO reprocessing script chandra_repro
THREADS AFFECTED:
Reprocessing Data to Create a New L2 Events File
B. ACIS DET_GAIN and P2_RESP N0007 with modified S1 data
| DET_GAIN File Location: | $CALDB/data/chandra/acis/det_gain |
| Filename: | acisD2000-01-29gain_ctiN0007.fits |
| P2_RESP File Location: | ${CALDB}/data/chandra/acis/p2_resp |
| Filename: | acisD2000-01-29p2_respN0007.fits |
A new position-dependent gain map has been developed for the back-illuminated chip ACIS-5 (ACIS-S1) which makes significant improvements on what has been a problematic calibration since the launch date. The new S1 gain map removes most of the irregularities that distort the order-sorting event distribution, allowing for better order separation and hence much improved spectral extraction and source modeling on the S1 chip. The LETGS calibration team also reports the new gains give a better cross calibration between LETG/ACIS-S and LETG/HRC-S over wavelengths covered by the S1 chip. NOTE: The new S1 calibrations are only for the case where the BI chips are serial and parallel CTI corrected (CTI_APP = PPPPPBPBPP). Hence observations with GRADED datamodes are not affected by this change.
The new version N0007 DET_GAIN file above completely replaces the N0006 DET_GAIN file previously used in ACIS Level 1 processing (acis_process_events) and in CIAO reprocessing with chandra_repro. However, only the ACIS-S1 gains are modified; Gains for the other nine chips are unchanged.
With the new S1 gain values, a corresponding change in the P2_RESP file for ACIS-S1 only is in order. We include a new P2_RESP with the same version number (N0007) to go with the new DET_GAIN file above. This would be applicable only for imaging spectroscopy, where an RMF generated by mkacisrmf is required. As with the DET_GAIN, the new N0007 P2_RESP completely replaces the N0006 P2_RESP file in applicable cases (CTI_APP = PPPPPBPBPP).
To see some supporting plots of the improvement in the ACIS-S1 spectral extraction as a result of the new gains, see the technical details section below.
PIPELINES/TOOLS AFFECTED:
GAIN file: DS and CIAO level 1 (re)processing tool acis_process_events
Also: CIAO reprocessing script chandra_repro
P2_RESP file: CIAO scrip specextract, which uses the tool mkacisrmf
THREADS AFFECTED:
For IMAGING Spectroscopy:
GAIN file: Reprocessing Data to Create a New L2 Events File
P2_RESP file: Extract Spectrum and Response Files for a Pointlike Source
Extract Spectrum and Response Files for an Extended Source
For GRATING Spectroscopy, non-GRADED DATAMODE cases (Only the GAIN file applies):
C. LETGS +/-1st Order LSFPARM N0004 Files
| Location: | $CALDB/data/chandra/hrc/lsfparm |
| Filenames: | hrcsleg-1D1999-07-22lsfparmN0004.fits hrcsleg1D1999-07-22lsfparmN0004.fits |
The LETGS Calibration team, with the help of the CXC Science Data Systems (SDS) team, has produced and released new Line spread function (LSF) parameter files (CODENAME = LSFPARM in the CalDB) for the LETG/HRC-S configuration. These new files, which are inputs to the CIAO mkgrmf routine incorporate new encircled energy fraction tables, which were generated as a result of efforts to improve signal-to-background ratio in extraction of LETGS spectra. A modification of the LETGS spectral extraction thread is needed to take full advantage of the improved calibrations; however users may continue to with the default extraction region if their data do not require the improved S/N.
See the technical details section below for more information concerning the new EEFRACS tables and improving the LETGS signal-to-background ratio.
PIPLINES/TOOLS AFFECTED:
CIAO script mktgresp, which uses the tool mkgrmf.
THREADS AFFECTED:
D. HRC-S QE N0014 Files
| Location: | $CALDB/data/chandra/hrc/qe |
| Filenames: | hrcsD1999-07-22qeN0014.fits hrcsD2012-03-29qeN0014.fits |
Because the modifications to the LETG/HRC-S Grating RMFs in Item 3 above are not an indication of a change in the overall LETGS Grating RMF X Grating ARF (to say EEFRACS X QE) response, a corresponding adjustment in the grating ARF is called for. The appropriate adjustment is to modify the HRC-S QE to compensate for the GRMF changes, leaving the overall grating response for LETGS unchanged. See the technical details section below for spectral details of the changes. The deltas versus energy range from +14% at .06 keV to less than -1% at 11.0 keV.
PIPLINES/TOOLS AFFECTED:
CIAO script mktgresp, which uses the tool mkgarf.
THREADS AFFECTED:
E. HRC-I QE N0009 File
| Location: | $CALDB/data/chandra/hrc/qe |
| Filename: | hrciD1999-07-22qeN0009.fits |
The same modification procedure applied to the HRC-S QE has been applied to the HRC-I QE, because the QE calibrations of the two detectors are programmatically linked since the release of CalDB 2.25, on 2003-12-15, wherein the HRC-I QE was linked going forward to that of HRC-S via on-orbit calibrations where replaced the original ground-based calibrations for HRC-I. In order to keep the LETG/HRC-I and LETG/HRC-S cross-calibration consistent, it is necessary to modify them both over applicable wavelengths as well.
See the technical details section below for spectral details of the changes. The deltas versus energy range from 14% at 0.06 keV to about 1% at 11.0 keV.
PIPLINES/TOOLS AFFECTED:
The CIAO script fluximage, which uses the tool mkinstmap.
THREADS AFFECTED:
HRC-I Exposure Map and Exposure-corrected Image
F. ACIS GROUP F BKGRND DTCOR Correction
| Location: | $CALDB/data/chandra/acis/bkgrnd/ |
| Filenames: | acis*D2009-09-21bkgrnd*N000*.fits acis*D2009-09-21bgstow*N0001.fits |
Yet one more problem has been discovered with the ACIS Group F background and stowed background files. Specifically, the DTCOR keyword for these files was found to be set to an INT4 data type, whereas the previous BKGRND sets have DTCOR set to REAL8 format. The values are all set equal to unity, but when executing the ACIS thread for the using the blank-sky files, users have found that a WARNING message occurs when merging these events lists with those from the other blank-field file groups with dmmerge. Since it would be nice to eliminate this otherwise meaningless warning from users' as-run procedures, we are correcting this problem with the current CalDB 4.6.9 release.
PIPLINES/TOOLS AFFECTED:
NONE.
THREADS AFFECTED:
III. TECHNICAL DETAILS
A. ACIS T_GAIN Epoch 62, with finalizations for Epoch 61
The ACIS time-dependent gain corrections (T_GAIN) have recently been updated for current changes from the previous T_GAIN epoch, specifically Epoch 62, which was May-Jul 2015. With the addition of these new corrections, derived from ACIS External Cal Source (ECS) data taken during radiation zone passes, the CalDB files extending from Feb through Apr 2015 (i.e. Epoch 61) have been finalized, and new non-interpolating T_GAIN files are now implemented for Epoch 62.
The magnitudes (in eV) of the new gain corrections, versus photon energy, are given in Figs. 1-3 below. The corrections are of the usual order in magnitude, specifically less than 2.0% of the photon energy value. Fig. 1 below gives the corrections for the ACIS-I aimpoint on chip ACIS-3, for the CTI-corrected case, which is the only one applicable to FI chips. Figure 2 gives the corrections for the ACIS-S aimpoint on ACIS-7, for the case where the BI chips are CTI-corrected. Finally Fig. 3 gives the corrections for ACIS-7 for NON-CTI-corrected BI chips. These would be relevant to GRADED DATAMODE observations with ACIS-S, for example.
Fig. 1: ACIS-I3 aimpoint T_GAIN corrections in eV versus photon energy.
Fig. 2: ACIS-S3 CTI-corrected aimpoint T_GAIN corrections in eV versus photon energy.
Fig. 3: ACIS-S3 non-CTI-corrected aimpoint T_GAIN corrections in eV versus photon energy.
Long term trends for chips I3 and S3 are plotted below in Figure 4a and b, through Epoch 62, the latest release. The chip locations for these plots are given in the respective labels above the plots. Note that the locations are not the aimpoint positions, as with Figs. 1-3 above, but are near the centers of each chip. The full CTI correction has been applied to the data in both figures.
|
|
| Figs 4a and 4b: Long term gain trends for specific ECS line energies from Epoch 1 to Epoch 62 inclusive, and for the positions on the respective chips given in the figure labels. (Click on images to expand the plots.) | |
B. ACIS DET_GAIN and P2_RESP N0007 with modified S1 data
The ACIS-S1 Gain calibration has been problematic essentially since the Launch Date. However recent efforts on the part of the ACIS Calibration Team (R. Edgar, Terry Gaetz) have produced a modified ACIS-S1 position-dependent gain table (DET_GAIN in CalDB) that, at least for grating configurations, is markedly improved. After some testing and verification with both grating and imaging observations on S1, the updated gain table is now ready for release. The new S1 gains have been integrated with the unchanged gain tables for the other nine chips into a new DET_GAIN file, applicable to the case where the back-illuminated chips (ACIS-S1 and S3) are fully CTI-corrected. Hence the new file does not affect observations with GRADED data modes.
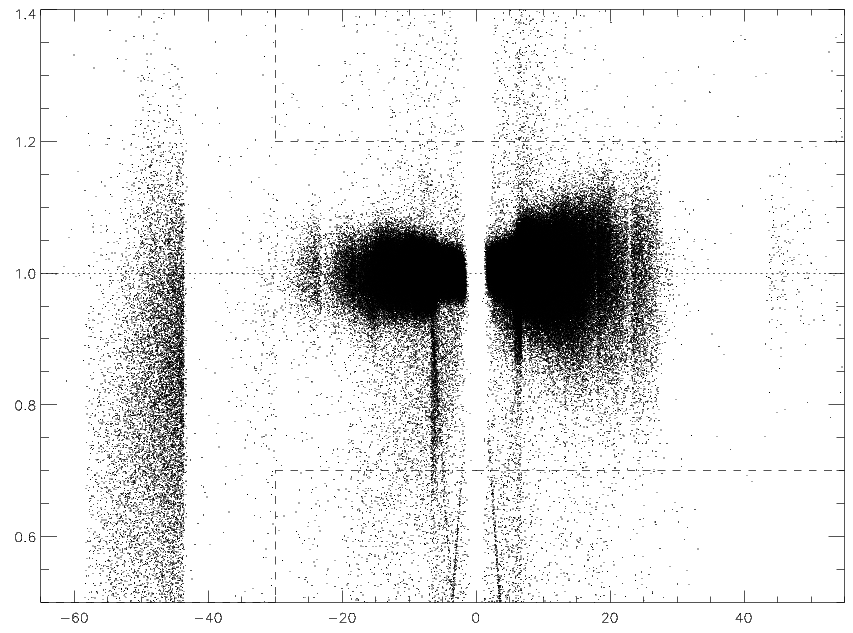
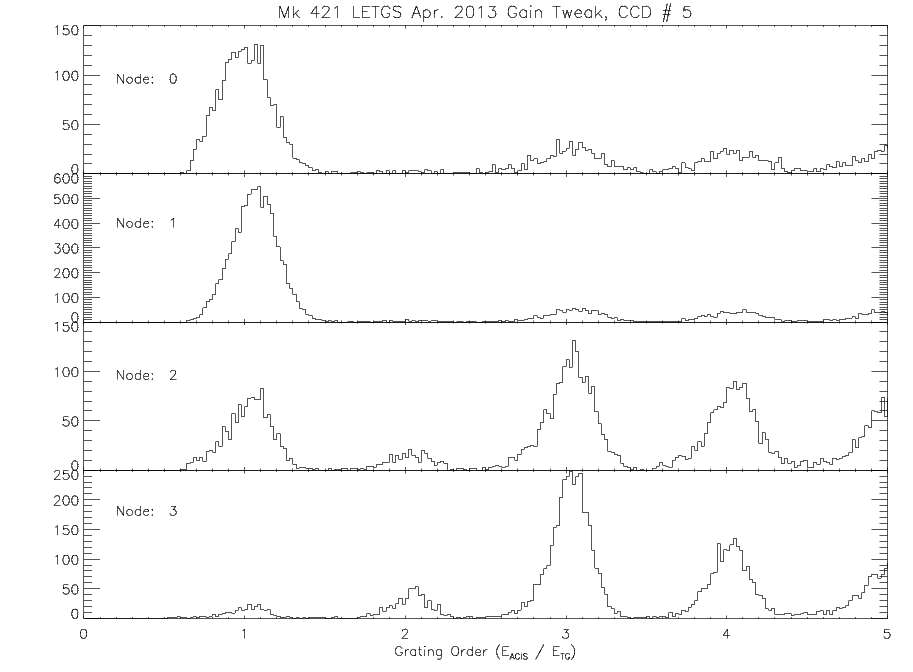
The new S1 gains were derived from nine LETG/ACIS-S observations of broad-band calibration source PKS 2155, as well as one of XTE J1118 (in its high state). With the appropriate time-dependent gains (T_GAIN) applied, the ACIS Cal team has been able to produce much-improved event order-sorting maps on ACIS-S1, which allows for improved spectral extraction. Additionally, it has been determined that no new order-sorting and integrated probability CalDB file (OSIP) will be necessary for the new S1 gain map. As illustrated in Figs. 5 and 6 below, there is noticeable improvement in the first order spectral extraction for Mkn 421 (OBS_ID 15476, 2013-APR-03 particularly below the Carbon edge (Node 0 of ACIS-S1).
|
|
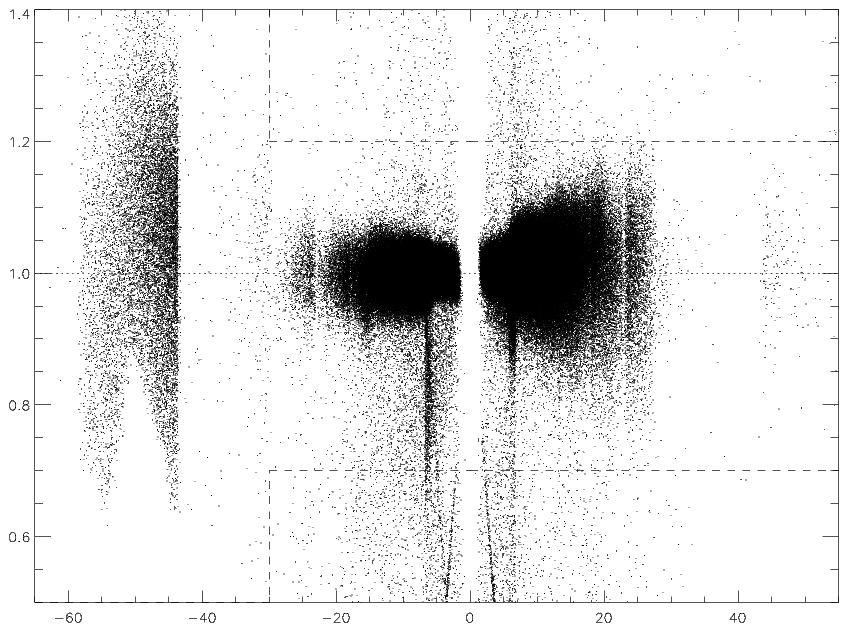
| Fig. 5a: Order-sorting plot for m=1 of events from an LETG/ACIS-S observation of Mkn421, using the ACIS CTI-corrected DET_GAIN file N0006. Note the first order events for the ACIS-S1 chip (-60 < λ < -45) the pattern of events goes off the m=1 order scale. | Fig. 5b: The same plot as Fig. 5a, but with the new N0007 CTI-corrected DET_GAIN file applied. Note the ACIS-S1 events are now better centered on order m=1. |
|
|
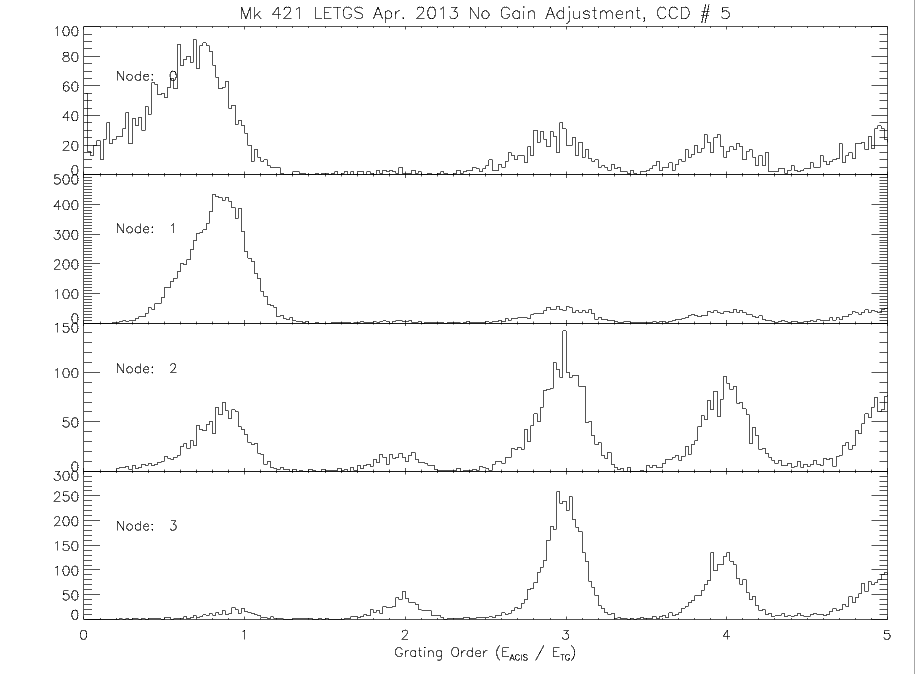
| Fig. 6a: A node-by-node histogram of events versus grating order from the same Mkn421 observation using the ACIS CTI-corrected DET_GAIN file N0006. In this case the distribution of first order events is clearly displaced from m=1 on all four notes, but particularly distorted on Node 0, corresponding to wavelengths below the C-K edge. | Fig. 6b: The same plot as Fig. 6a, but with the new N0007 CTI-corrected DET_GAIN file applied. Note improvements in the placement of the various orders on Nodes 0-2, in particular m=1 on Node 0. |
Furthermore, using the new ACIS-S1 gains on OBS_IDs in ACIS-S/HRC-S interleaved mode with the LETG deployed, gives a much improved cross calibration between those two configurations. See for example the fitting results from Mkn421 interleaved mode observation from 2010-MAR-13 in Fig. 7 a and b below. NOTE: Clicking on either of the two graphics in Fig. 7 will download a corresponding Postscript file with figures from five examples of interleaved mode observations of Mkn421 over dates from 2010 through 2014. The three panels on each page give the power-law fitted results for photon index (top), normalization (middle), and the flux (bottom). The improvement in the tracking of the fitted values and fluxes is quite clear when the new S1 gains are used. While it is difficult to put a fixed number on the flux calculations with the old versus the new S1 gains, users might be able to estimate the affects on their results relative to the past several years from these results on Mkn421.
|

|
| Fig. 7a: Plots of fitted results for a power-law fit of an LETG/ACIS-S observation from 2013 MAR 13 derived from interleaved LETG/ACIS-S (black symbols with error bars) and LETGS/HRC-S (blue symbols). In this case, the ''old'' CTI-corrected N0006 DET_GAIN file was used. | Fig. 7b: The same plot as Fig. 7a, but with the new N0007 CTI-corrected DET_GAIN file applied. |
A note on the energy dependence of the gain upgrade: At some level the whole range could be affected since the gains are recalculated from the adjusted P2_RESP SCATTER peaks which are shifted according to an analytic gain tweak. The effects are minimal above 2 keV and typically small above ~1 keV. For 0.5 - ~1 keV, the E0102 observations indicate changes, with the larger changes more at the lower end (i.e., the oxygen lines); some were better, some were worse. Below 0.5 keV, it looks like the gains are systematically better in both imaging and grating observations.
C. LETGS +/-1st Order LSFPARM N0004 Files
See Optimized LETG/HRC-S Extraction Region and Recalibrated EEFRACs soon to be posted permanently here, dated September 2015. The line-spread function parameter files (codename = LSFPARM in CalDB) are the inputs to the CIAO function mkgrmf. which produces the grating RMFs to be used along with grating ARFs in spectral analysis.
Summarizing the above web page, the current LETG/HRC-S spectral extraction region file in CalDB is the so-called "bowtie" region filter, specified early in the mission to optimize (roughly) the X-ray spectral signal to the detector particle background. The subject upgrade is to further optimize the signal-to-noise ratio by correcting known deviations (from ideal) in the LETG/HRC-S grating dispersion region, and fine-tuning the extraction region and the grating RMF to be applied thereto. Fig. 8 below (taken from Fig. 11 of the Cal page link above) gives the new enclosed energy fraction contours derived from the corrected spectra of numerous observations of calibration sources with the LETGS. These new EEFRACS data, and their supporting Gaussian and Lorentzian parameters, are what populate the new LSFPARM files. In particular the very evident left-right asymmetry of the cross-dispersion pattern will now be addressed in the grating RMFs.
|
|
|
| Fig. 8a: Cumulative count fractions from four continuum sources. Overlapping data on the center plate are distinguished by line thickness. The cross-dispersion 1st order is shown in light gray (also seen as the faint "whiskers" in Fig. 1). Solid black lines mark the current spectral extraction region (bowtie). The red and magenta "Uncorrected" curves show the medians for two ObsIDs with extreme tilts (before correction--see Fig. 3). The gray band in the middle has a half-width of 1 pixel; typical deviations from a perfectly straightened spectrum (arising from errors in 0th order position, residual time-dependent spectral curvature, etc.) are ±0.5 pixels or less. (Captions taken directly from Cal Web page above.) | Fig. 8b: "Corrected" version of Fig. 11a including more contours in the LSF core and using only the best data for the central plate, forcing the 6% and 94% contours to follow their assumed true values, and then drawing piecewise linear curves for all contours. Contours short of ~6 Å are approximate; final EEFRAC results at short wavelengths incorporate MARX modeling of Xdisp orders and scattering. |
For CalDB, this means new refinements to the LETG/HRC-S LSFPARM files in the EEFRACs column, with appropriate adjustments to the gaussian and lorentzian parameter grids to accommodate the increased number of widths (from 10 to 23) in the EEFRACS table. The grid of wavelengths (2048) remains unchanged.
|
|
|
||
| Fig. 9: EEFRACs for the standard bowtie extraction region using data from the old CALDB data (red), roughly rescaled CALDB data (orange), calibration measurements (blue, using data from Fig. 8b, and new CALDB (black). The ratio of new and old CALDB EEFRACs (and the inverse of new/old HRC-S QE) is shown in gray. | Fig. 10: New EEFRAC values for the ten original tg_d values. Values interpolated from calibration measurements are plotted with thick lines, those based on rescaled old CALDB data (from raytrace simulations) are thin (at short wavelengths). Dotted connecting lines follow trends in the old CALDB data. | Fig. 11: Final EEFRAC curves for the complete set of 23 tg_d values, with the 13 new curves shown in black. |
The EEFRACs from this work differ from those in the previous version of the CALDB because of deviations from the simulated LSF, 2% lower Xdisp intensity, and the previous incorrect normalization of flux to the detector area rather than to 2π. The net change in bowtie-region EEFRACs is typically several percent, and about 12% at the longest wavelengths (Fig. 16). Note that the overall absolute uncertainty in the LETG/HRC-S EA is unchanged at approximately ±10% (somewhat larger at long wavelengths because of complications from recent changes in HRC-S gain and QE).
Visually, the result of all this work to improve the signal to background ratio for the LETG/HRC-S is given in Fig. 12 below. With the updated LSFPARM files in CalDB 4.6.9, the resulting grating response matrix files (gRMFs) incorporate the appropriate EEFRACs for the new region in the lower plot. With the modfied HRC-S QE (see the next subsection), the grating ARFs generated from the LETG/HRC-S Grating ARFs thread will be appropriate for the new gRMFs. NOTE: The thread will be modified in the near future when scripts to correct tilts and wiggles in the LETG/HRC-S spectra are made available to users. Until then, users may employ the new gRMFs and gARFs to data extracted using the current bowtie region filter without introducing any errors.
Fig. 12: Standard bowtie and optimized EEFRAC=78% extraction regions for spectra and background. Total background area
is 10 times the spectral area in both cases. The optimized regions are not symmetric for - vs + wavelengths (c.f. Fig. 8).
D. HRC-S QE N0014 Files
Because the modifications to the LETG/HRC-S Grating RMFs in Item 3 above are not an indication of a change in the overall LETGS GRMF X GARF response, a corresponding adjustment in the grating ARF is called for. The appropriate adjustment is to modify the HRC-S QE to compensate for the GRMF changes, leaving the overall grating response for LETGS unchanged. Figure 7 below illustrates the QE(E) change in logarithmic (a) and percent-difference (b) plots for the HRC-S. The deltas versus energy range from +14% at .06 keV to less than -1% at 11.0 keV.
|
|
| Fig. 7a: HRC-S aimpoint effective areas versus energy. The dashed curve was made using the N0013 QE file; the red curve used the new N0014 QE. Both are the files effective 2012-03-29. | Fig. 7b: The percent difference of the two curves in Fig. 7a to the left. |
E. HRC-I QE N0009 File
The same modification procedure applied to the HRC-S QE has been applied to the HRC-I QE, because the QE calibrations of the two detectors are programmatically linked since the release of CalDB 2.25, released 2003-12-15, wherein the HRC-I QE was linked going forward to that of HRC-S via on-orbit calibrations where replaced the original ground-based calibrations for HRC-I. Figure 8 below gives the comparison of the previous (N0008) and new (N0009) HRC-I QE files in CalDB, again sans the QE uniformity modifications. While the percent difference in Fig. 8b below is similar in character to Fig 7b above, the values are not identical, owing to the convolution with the extraction region and effective area required in the HRC-S QE adjustment.
|
|
| Fig. 8a: The aimpoint effective area for HRC-I using the N0008 QE (dash curve) and the N0009 new QE (red curve). | Fig. 8b: The percent difference between the curves in Fig. 8a. |