
[Last Change: 28 Feb 2011 (rev 1)]
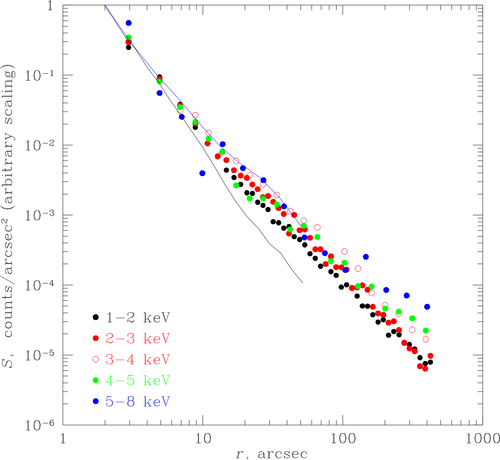 For comparison, the colored lines show the brightness profiles derived from the model images found in the current CALDB (limited to r=64") at 1.5 keV and 6.4 keV (same color as corresponding dots). Since the model is not affected by pileup, the normalizations are arbitrarily selected so that each line fits the 2 corresponding data points inside the 6" radius. At high energies, the model describes the slope of the data amazingly well; a 4.5 keV model, not shown for clarity, also fits very well. Apparently, the model underestimates scattering at low energies (but the real diffuse emission in the field may also be responsible).
The conclusion is that the PSF radial brightness profile declines approximately as r-2 at all energies over the radial range of a few arcsec to a few arcmin, and whenever the observer discovers a round nebula with such brightness profile around a bright point source, it is probably the PSF.
For comparison, the colored lines show the brightness profiles derived from the model images found in the current CALDB (limited to r=64") at 1.5 keV and 6.4 keV (same color as corresponding dots). Since the model is not affected by pileup, the normalizations are arbitrarily selected so that each line fits the 2 corresponding data points inside the 6" radius. At high energies, the model describes the slope of the data amazingly well; a 4.5 keV model, not shown for clarity, also fits very well. Apparently, the model underestimates scattering at low energies (but the real diffuse emission in the field may also be responsible).
The conclusion is that the PSF radial brightness profile declines approximately as r-2 at all energies over the radial range of a few arcsec to a few arcmin, and whenever the observer discovers a round nebula with such brightness profile around a bright point source, it is probably the PSF.
A quick check of PSF wings
Maxim Markevitch (maxim@head-cfa.harvard.edu), 10/24/0
The figure below shows surface brightness profiles of LMC X-1 in different energy bands (dots of different color). They are derived from the 4 ks on-axis ACIS-I observation (obsid 1422) taken for calibration of the PSF wings. From each image, the background was subtracted, the image was divided by the exposure map which included the QE nonuniformity and dither but did not include mirror vignetting. The LMC X-1 readout streak, a couple of point sources, and the interchip gaps were excluded from the region of the radial profile derivation (the latter to avoid inaccuracy due to low photon counts in the gaps). The profiles are normalized to their integrated flux inside the 6" radius. Since the brightness peak is heavily piled up, it is fair to call this arbitrary normalization, so the resulting profiles are only useful for qualitative comparison of the profile shapes at large radii. At the lowest energies, there is an apparent irregular diffuse emission around LMC X-1 which is probably real, so I do not show the 0.5-1 keV profile. Some of this emission is still apparent in the 1-2 keV band (the lowest energy band shown). The background becomes comparable to the source brightness around r=200" at the highest energies (it is subtracted so only its uncertainty is relevant).