SAOImageDS9: New Features, Tips, and Tricks
Kenny J. Glotfelty, William Joye, Antonella Fruscione
SAOImageDS9 and CIAO, together again
SAOImageDS9, aka ‘DS9’, was first released in 1999 (the same year the Chandra X-ray Observatory was launched!) as the successor to the already popular SAOImage and SAOtng astronomical visualization applications (Joye & Mandel 1999, Joye & Mandel 2003). It was originally funded by NASA Applied Information Systems Research Program and later by HEASARC, JWST, and the High Energy Astrophysics division of the Center for Astrophysics | Harvard & Smithsonian.
Today, DS9 is being developed by the Chandra X-ray Center’s (CXC) Science Data Systems (SDS) group; the same group that, in collaboration with the Data Systems and MIT/SDS team, brings you CIAO (Chandra Interactive Analysis of Observations; Fruscione et al. 2006). While DS9 continues to be an independent project serving all fields of astronomy (and beyond), the collaboration with the SDS group has led to several exciting updates specifically of interest to the Chandra/CIAO community (see also our previous newsletter article “CIAO and DS9: a powerful pair through DAX” by Glotfelty et al. 2020). In this article, we will highlight some of these recent updates.
Tip: Having problems drawing or selecting regions? Go to Edit → Region
A new look for a new generation
Some of the most immediately recognizable updates to DS9 are to the user interface. In version 8.2, released in 2020, DS9 added support for several themes; themes provide a unified interface such as choice of fonts, colors, spacing, and how buttons look. With the rise in popularity of operating systems supporting Dark Mode, the traditional light-gray background DS9 used stood out from other applications. Now, with themes, users can select one of the dark mode choices and the DS9 application will now complement the rest of the desktop applications.
Tip: To change the theme, go to Edit → Preferences, and from the General tab, select the choice of Color/Theme from the pull down menu.
In version 8.3, DS9 implemented separate color bars for each individual frame. For CIAO users that means we can now display exposure maps and counts images side by side each with their own color bars rather than having to pick just one.
In the soon-to-be-released version 8.4, DS9 gets a whole new look: the Advanced View. Once users get to know DS9’s capabilities, they quickly tire of having to click through so many levels of menus to access the feature they want. With the Advanced View, DS9 has implemented icons that provide one-click access to many of the most common tasks: file open, region shape, bin/block/zoom, frame controls, and so much more. For example, changing the zoom level in the magnifier is an option buried in the Preferences, but with the Advanced view these zoom levels can be changed quickly with buttons directly under the magnifier itself.
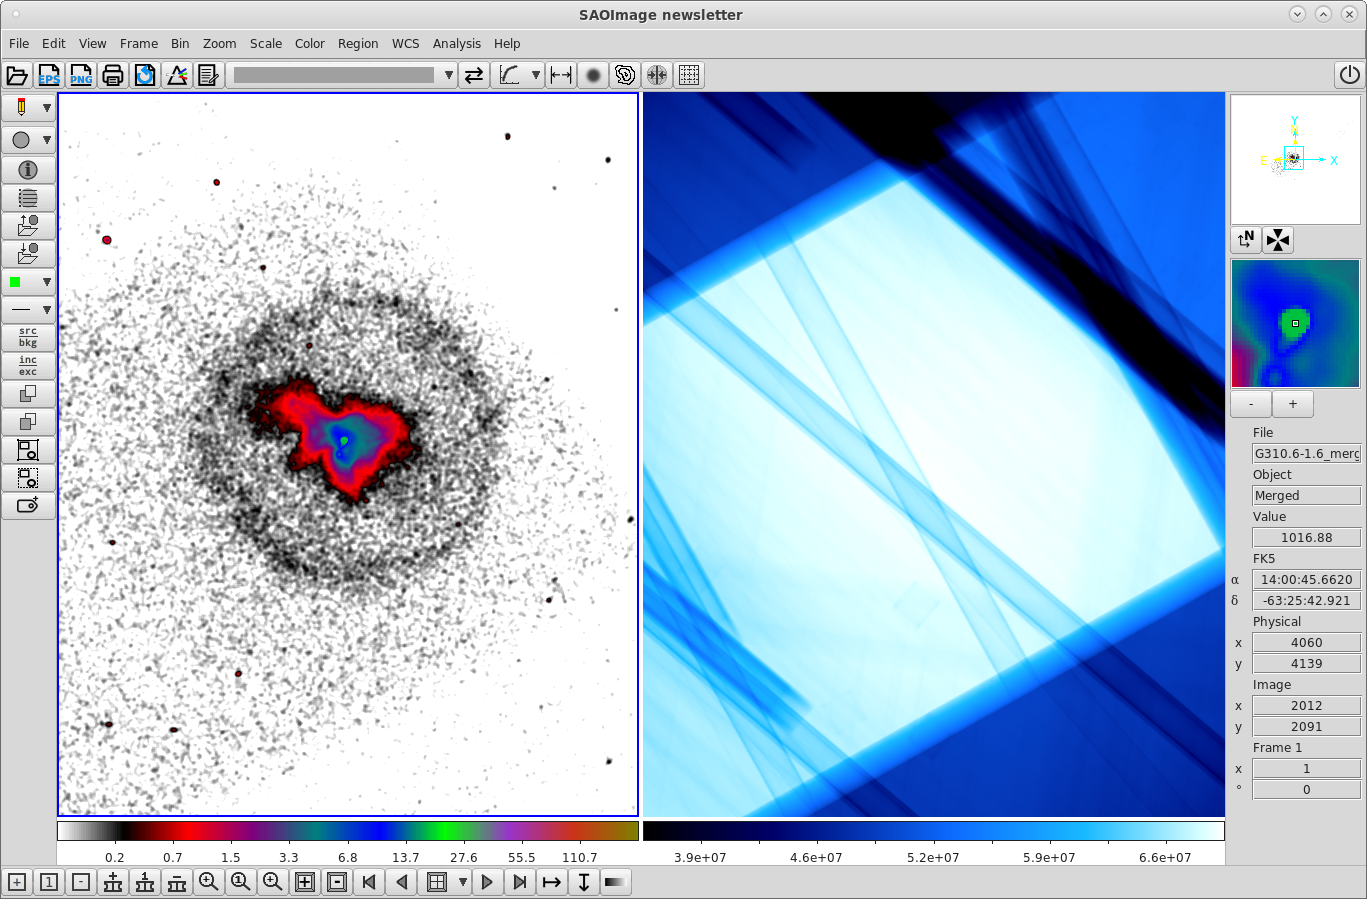
Figure 1. DS9 Advanced view provides one-click button access to many of the essential features. All the icons have tooltips. The multiple colorbars for each frame are also visible. Shown is a merge of G310.6-1.6 observations with the counts image on the left and the combined exposure map on the right.
Catalogs: more than just an imager
Tip: Advanced DS9 users know: Many of the most interesting features are under the “Analysis” menu.
One of the most underutilized features of DS9 is its support for catalogs. DS9 can now import FITS format tables as catalogs. This includes the output from CIAO’s wavdetect, celldetect, and vtpdetect tools, as well as importing catalogs like those created by the srcflux script. To launch the catalog tool and import a FITS table go to Analysis → Catalog Tool then File → Import → FITS… , or from the command line:
$ ds9 img.fits -catalog import fits wavdetect.src
The catalog tool also allows users to create scatter plots from columns and interact with the data; selecting points in the plot will highlight the row in the catalog table and recenter the imager to that location. While plotting itself is not new in DS9, it became much easier in version 8.2 with the introduction of the Plot Control Panel. The Control Panel provides a single place to modify all the plot properties that were previously only accessible through multiple layers of menus. It can be launched by going to the plot window’s menu Control Panel → Open option.
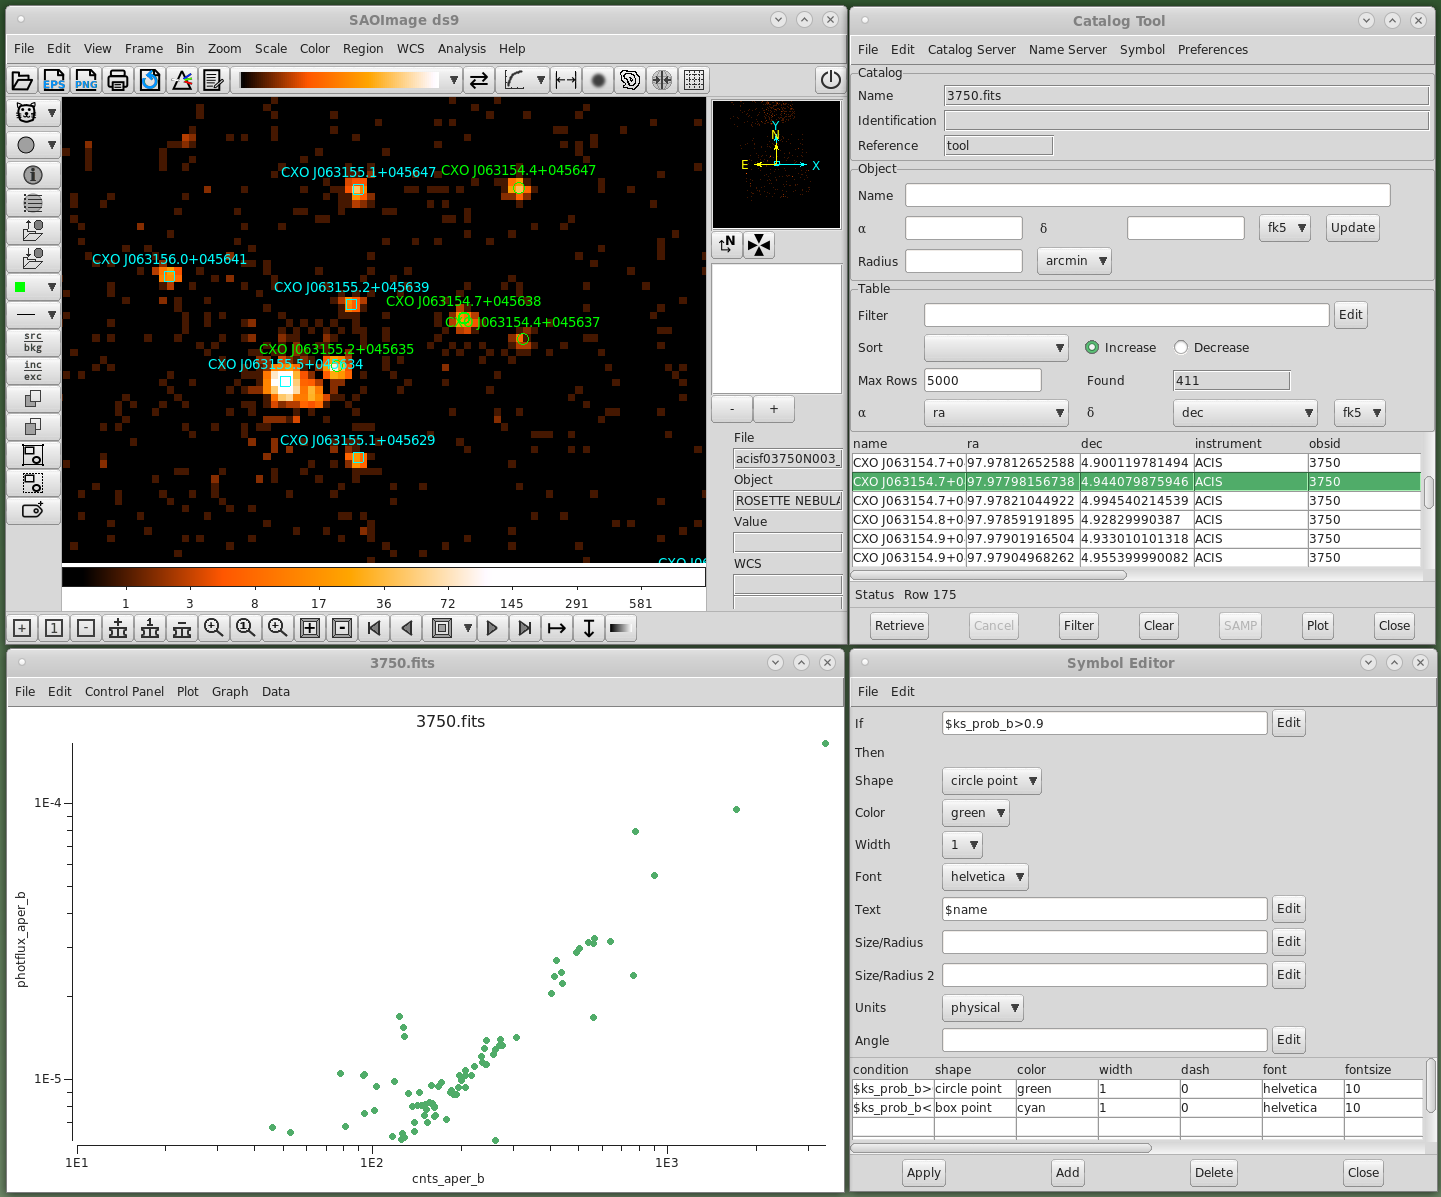
Figure 2: DS9 catalog tool (upper right). The imager (upper left) automatically pans to the coordinates of the highlighted row. The catalog markers are drawn based on the rules in the Symbol Editor (lower right). Plotted in the lower left are the counts vs photon fluxes taken from the catalog.
Tip: Want to click+drag to pan around like in Google Maps? Edit → Preferences, Pan Zoom (left), Drag to Center (right).
Prism is retired, Welcome Prism
Circa 2020 the CIAO team decided to drop support for its Prism graphical file browser. At the time it was noted that the DS9 catalog tool provides much of the same functionality, though specifically to catalog tables. The DS9 prism tool was developed based largely on the existing catalog tool design with a similar look and feel to the CIAO prism application. To launch prism from the GUI, go to File → Prism or from the command line
$ ds9 -prism my_table.fits
DS9 prism allows users to display tabular data and the associated meta-data (headers), plot individual columns, create histograms, and bin columns into images.
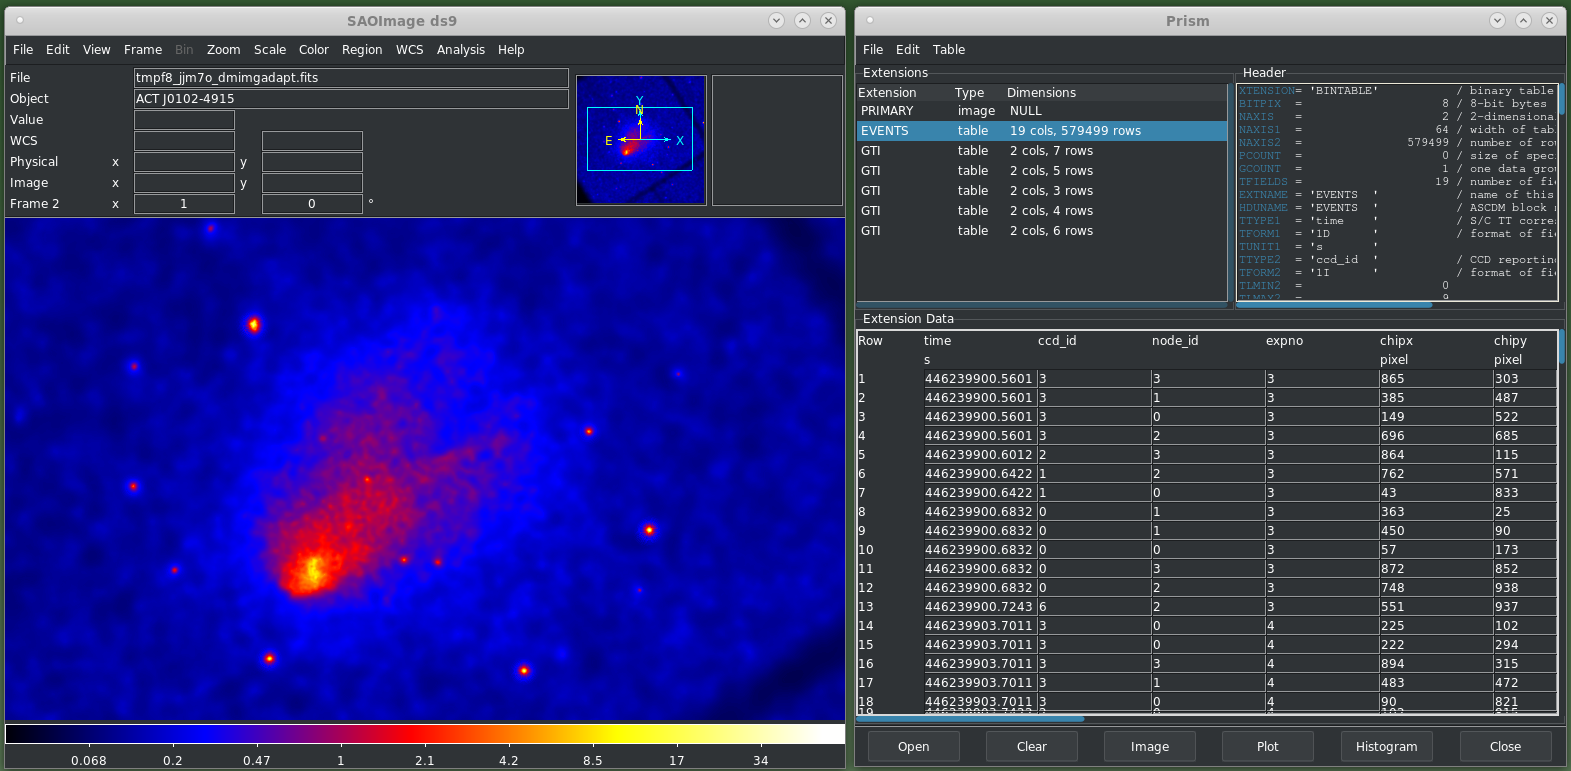
Figure 3: DS9 using the awbreezedark theme showing the Prism tool (right). Prism loads the currently displayed frame, in this case the event file for OBS_ID 14022: ACT J0102–4915
Footprints in the sky
Often, Chandra observers will be displaying data from other observatories in DS9 and want to know if there are any Chandra observations of the same field of view. While this information is easily obtainable from the Chandra Data Archive’s Footprint Viewer, it can be immediately accessed directly from within DS9 using the new Footprint Servers tool. Just go to Analysis → Footprint Servers → Chandra (NASA/CXC), or from the command line
$ ds9 img.fits -footprint cxc
The footprint tool looks similar to the catalog tool and shares some of the same features. Clicking on a row in the table will highlight the footprint in the imager, and when in Edit → Footprint mode, you can select a footprint in the image and it will be highlighted in the table.
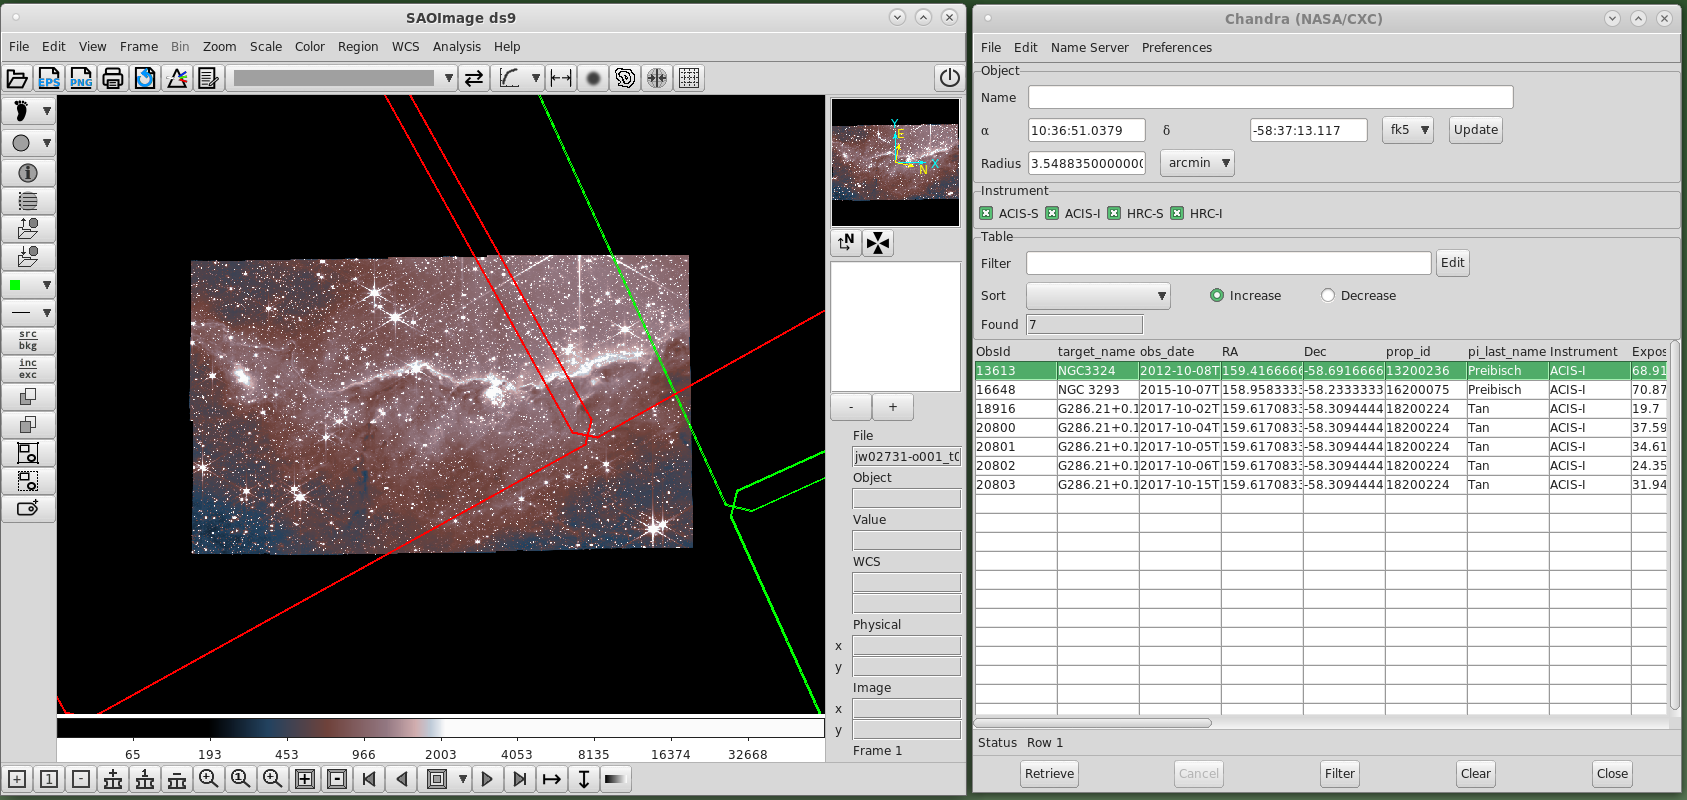
Figure 4: DS9 displaying the JWST F200W NIRCam clear image with the Chandra footprints shown. The selected footprint is drawn in red and highlighted in the table. A user can quickly see that only one public Chandra observation overlaps the JWST field-of-view.
Cubes, Movies, and More
When developing CIAO, the CXC made many conscious decisions to respect the fact that Chandra data are, by their very nature, multidimensional. While traditional data analysis still relies on separating spatial, spectral, and temporal axes, much can be learned by looking at some datasets in higher dimensions. DS9 has supported multidimensional datasets (cubes) for a long time, with 3D rendering capabilities added in v7.0. However, until recently it has been difficult to publish such multidimensional results. As of version 8.1, DS9 can now export movies in GIF format, which makes it much easier to share results, using the File → Create Movie option. To load a data cube, first create a new 3D frame using Frame → New Frame 3D and then File → Open to load the image. From the command line
$ ds9 -3d CasA_cube.fits
Figure 5: DS9 displaying a 3D view of a 168 ks observation of Cas A, ObsId 4638. The image is binned by 8 in both X and Y, and goes from 0.2 keV to 7.0 keV in 0.1 keV steps in energy along the 3rd, Z-axis. Contours have been overlaid on the counts image. Click on image for the animation, which has been saved as a GIF image using the Slice Movie option.
Users can create movies of slices through a 3D dataset, from a sequence of individual frames, and by automatically rotating a cube through azimuth and elevation changes.
Conclusion
These are just a few of the highlights of features that have been developed since DS9 has come within the CXC SDS group. The synergy between DS9 and CIAO has never been stronger, and we believe that it brought major benefits to the Chandra community.
The DS9 website is the ultimate reference for all DS9 documentation and to download the latest version. DS9 also comes bundled with each new CIAO release. Questions about DS9 can be submitted through the CXC Helpdesk by choosing “DS9 question” as the Help Topic. You can view several tutorials about DS9 and DAX on the CIAO YouTube page.
SAOImageDS9 development has been made possible by funding from the Chandra X-ray Science Center (CXC), the High Energy Astrophysics Science Archive Center (HEASARC) and the JWST Mission office at Space Telescope Science Institute. To cite SAOImageDS9 in your paper, please use 2003adass..295..489J.
References
Fruscione et al. 2006, SPIE Proc. 6270, 62701V, D.R. Silvia & R.E. Doxsey, eds. 2006SPIE.6270E..1VF
Glotfelty, K.J. & Fruscione A., for the CIAO team, Chandra Newsletter, Issue 28, Fall 2020, id.7 2020ChNew..28….7G
Joye, W. & Mandel, E. 1999, in ASP Conf. Ser., Vol. 172, Astronomical Data Analysis Software and Systems VIII, eds. D. M. Mehringer, R. L. Plante, & D. A. Roberts, 429
1999ASPC..172..429J
Joye, W. & Mandel, E. 2003 in ASP Conf. Ser., Vol. 295, Astronomical Data Analysis Software and Systems XII eds. H. E. Payne, R. I. Jedrzejewski, and R. N. Hook, 489
2003ASPC..295..489J