HETG Update
David Principe, for the HETG Team
Pushing the Limits of High Resolution X-ray Spectroscopy
The High Energy Transmission Grating Spectrometer (HETGS) continues to perform well and is utilized by the community for a broad range of scientific investigations. The Chandra Gratings Catalog and Archive (TGCat) contains 1,463 extractions of HETG/ACIS-S spectra for 477 unique sources utilizing 1,379 observations (some observations have multiple sources) and a total observing time of ~ 60 Ms. In 2019, we had 44 new gratings observations, totaling 1.2 Ms; this is slightly smaller than the average annual usage because of a large allocation for Targets of Opportunity which did not trigger. We expect that the community will continue to utilize the unique capabilities of the HETGS. Here we report calibration/software updates and a selection of recent science highlights.
Calibration and Software Updates
Zeroth Order Response: The zeroth order effective area of the HETGS has never been verified in orbit. Ground calibration at the X-Ray Calibration Facility at the Marshall Space Flight Center conducted some verification for energies above 800 eV, but these measurements had large systematic uncertainties due to photon pileup in the detectors (Schulz et al., 1998). Verification in orbit is extremely difficult because HETGS observations require bright enough sources to detect sufficient counts in the first order spectra. Hence, the zeroth order spectra are often severely saturated. The catalog of HETGS observations now includes fainter sources with long exposures, such as stellar clusters and galaxies of the local group, allowing us to obtain faint (and un-piled) zeroth order spectra. Once properly calibrated, these zeroth order spectra can be used to complement the first order spectral analysis.
To cross-calibrate the zero-order effective area against the first order, we simultaneously fit each spectrum with a common model and then evaluated the residuals between the normalizations. This spectral analysis assumes that the shapes of the effective area curves are well known. From analysis of about 8 suitable sources, we found that the ratio of normalizations of the zeroth to first orders to be 0.98±0.05% from 0.5 to 1.1keV, 1.02±0.02% from 1.1 to 2.4 keV, and 0.987±0.013% from 2.4 to 7.7 keV (Chandra Cycle 22 Proposers Observatory Guide). This small discrepancy is within our calibration uncertainties, and we can assume that the zeroth order and first orders responses are self-consistent.
ACIS Contamination: The HETGS effective area continues to suffer from increasing contamination buildup on the ACIS-S filter. This contaminant has been increasing linearly over the past five years and the CALDB model continues to be sufficient for HETGS analysis.
Pipeline, Archive, & Analysis: There have been no major changes to the analysis or processing software. In 2020, reprocessing of the entire Chandra archive will occur (REPRO V); during the reprocessing we will add HETGS responses (first, second, and third order "ARFs" and "RMFs") for the observer’s target to the Chandra archive (first order responses are already available in TGCat).
Selected Science Highlights
HETGS Unambiguously identifies Coronal Mass Ejection on a star other than the Sun
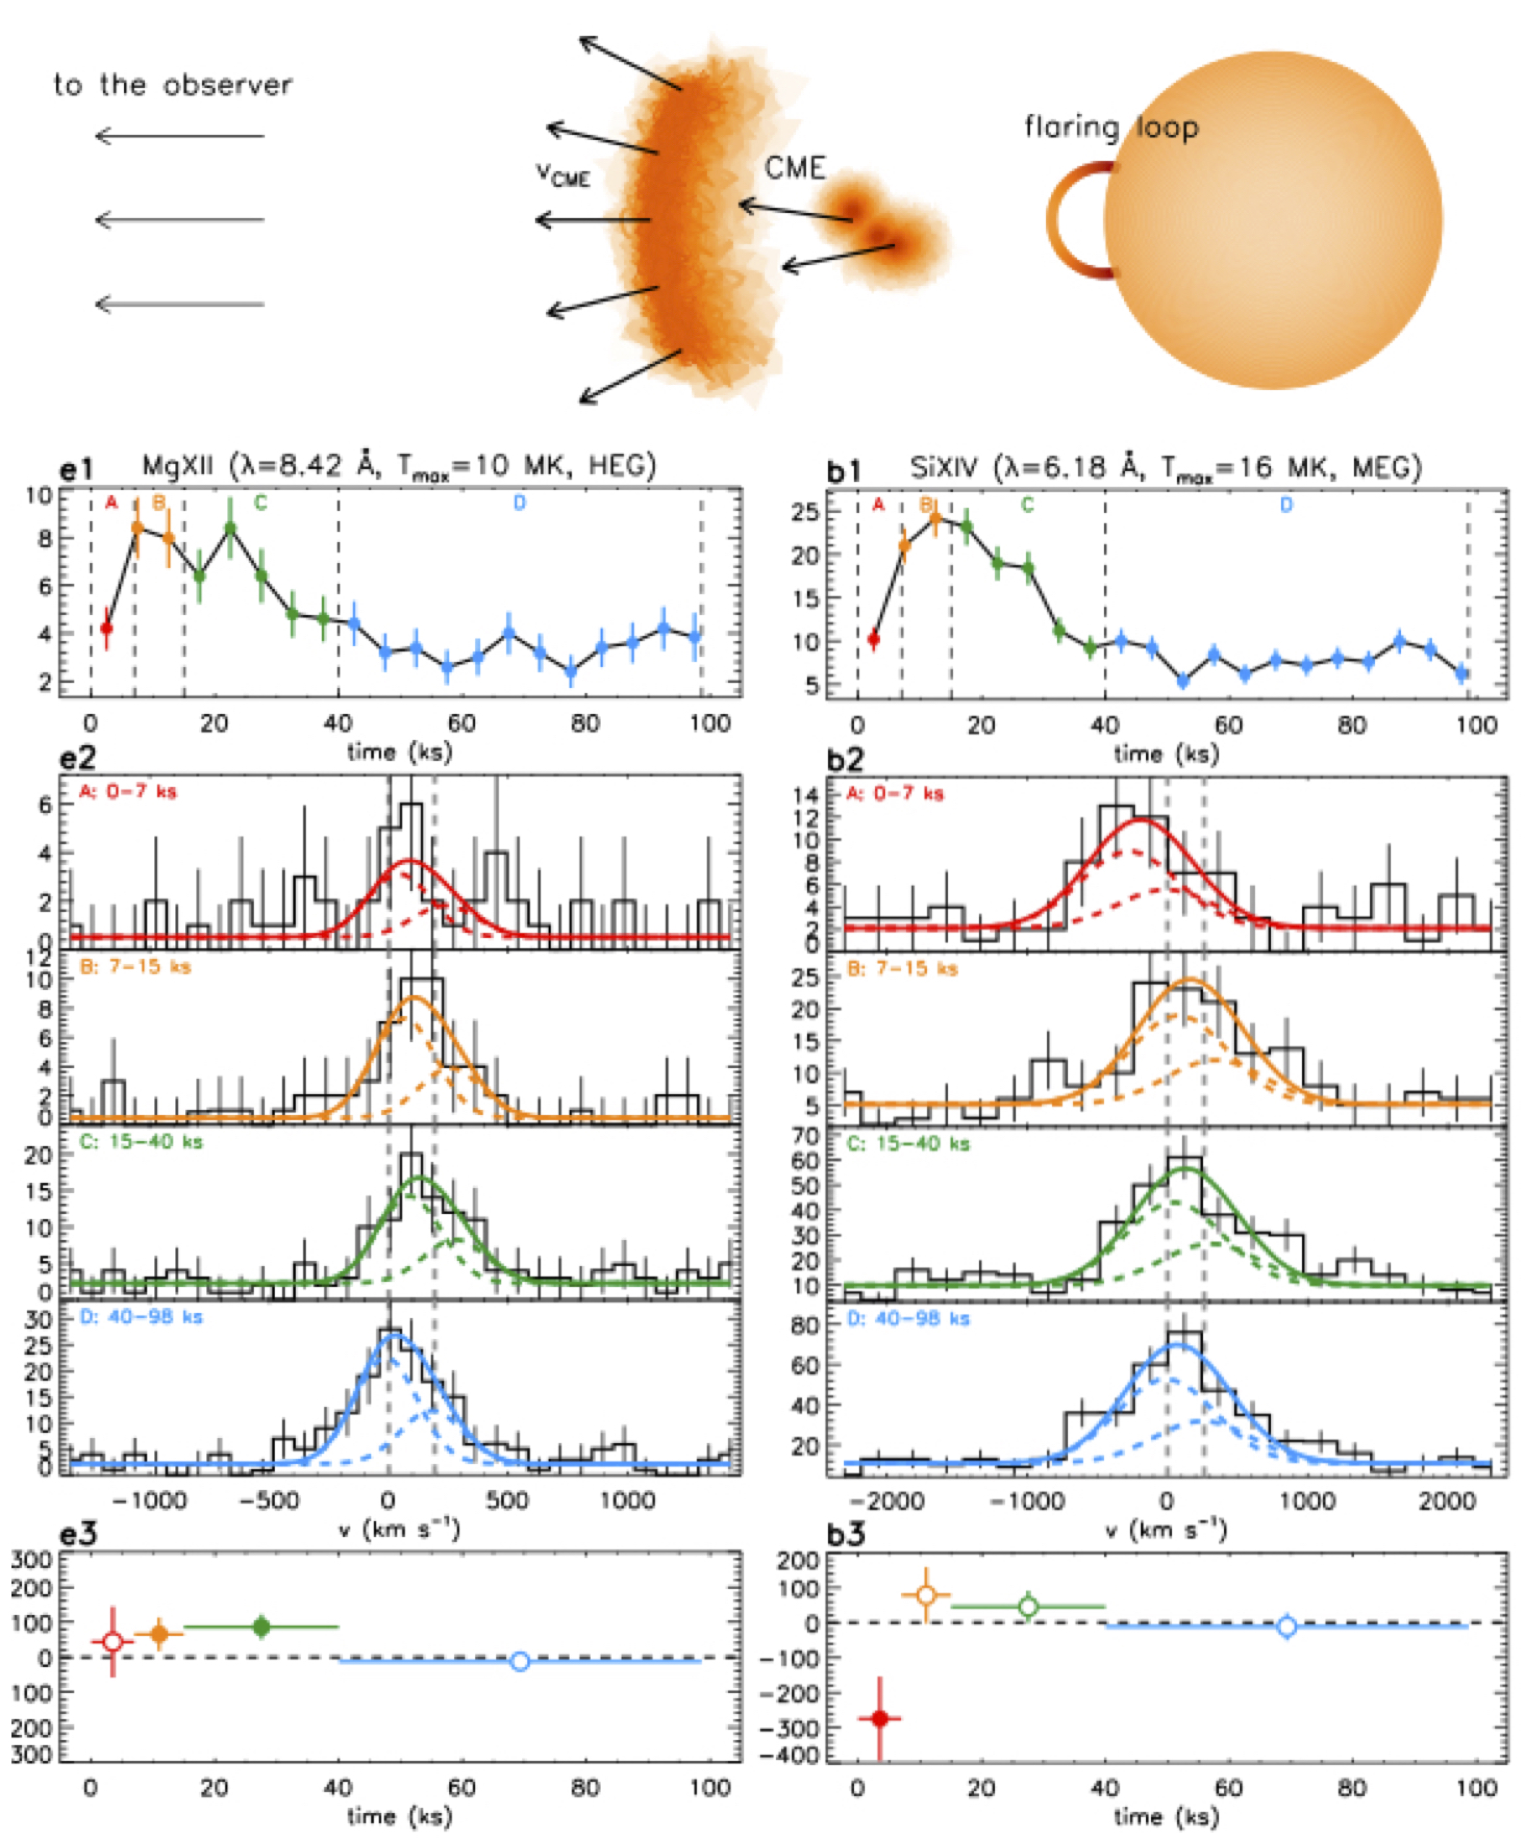
Figure 1: Schematic of a flaring event from the active giant star HR 9024. Below the schematic are HETGS light curves for the time-resolved Mg XII (left) and Si XIV (right) emission lines (Figure from Argiroffi et al., 2019). These features constrain the velocities of redshifted material in the coronal loop falling back onto the star and the blueshifted CME material coming towards the observer. Each color corresponds to a different moment in the light curves (flare evolution). These red- and blue-shifted features are consistent with hydrodynamic models of coronal ejecta and are used to constrain the geometry, mass and energy of this explosive event on a magnetically active star.
Magnetically active stars like our Sun exhibit a host of phenomena observable in the X-rays. Coronal Mass Ejections (CMEs) are events where large amounts of stellar plasma are ejected from the surface of a star as a result of magnetic-induced flaring. These events have been observed in exquisite detail in our Sun but are difficult to observe in other magnetically active stars due to their rapid variability and the small spatial-scales involved. Magnetic activity is ubiquitous among stars playing an essential role in stellar evolution yet there are still questions concerning how these stars generate and sustain their underlying magnetic dynamo. Many such stars have stronger magnetic fields than our Sun and their magnetic activity, as measured by the ratio of LX/Lbol, can be 104 higher than Solar. To date, our best understanding of magnetic phenomena comes from spatially-resolved observations of the Sun and it is thought that the origin of stellar activity in other stars may be scaled-up versions. Direct observations of magnetic phenomena of stars can test this theory.
As reported in a recent Nature paper by Argiroffi et al. (2019), the authors detect a CME from the active single giant star (G1 III) HR 9024 using Chandra-HETGS. A flare was detected during a 100 ks observation and a wealth of spectral information was used to constrain the mass, kinetic energy, and velocity of the ejected material. The authors used hydrodynamic modeling in conjunction with temperature-sensitive emission features and their velocities to verify this as a CME event. In particular, velocity shifted lines of S XVI, Si XIV, Mg XII, and O VIII were used as tracers of multi-temperature plasma during and after the flaring event to constrain the geometry of the flaring coronal loop and the ejected material (Figure 1). The velocities derived from some of these emission features were as low as 90 ± 30 km s−1. The observed plasma velocities were then compared to those predicted from their model flaring event demonstrating good agreement.
The authors compare the CME mass and X-ray flare energy from HR 9024 to the correlation observed for CMEs from the Sun and find that it is in reasonable agreement. Given the high activity level of this star, this means that the total amount of mass ejected can be a major source of mass and angular momentum loss. However, when comparing the HR 9024 data to another known correlation for Solar CMEs between X-ray flare energy and CME kinetic energy the authors find the HR 9024 CME kinetic energy is 104 times less than the Solar correlation would imply. This suggests that the mechanism responsible for accelerating CMEs in this source is less efficient than on the Sun and that the energy fraction carried out of the system by CMEs may be reduced for high activity levels. This implies that the large magnetic energy budget from Solar extrapolation is not present in this highly-active star and that at most the magnetic energy extracts ~10−3 of the stellar bolometric luminosity (Argiroffi et al., 2019).
New limit on Axion-like Particles Set by HETGS Spectrum.
The nature of dark matter remains a mystery. One of the extensions to the Standard Model of particle physics is a postulated particle called the axion, proposed to address some issues in quantum chromodynamics. If they exist and have a small mass, they could be a component of cold dark matter. Axions can be converted to X-rays as the axion traverses a magnetic field, but the reverse can also happen: X-rays propagating through a magnetic field can be converted to axions — they are lost, and in an energy- dependent way: this scattering can leave a signature in an X-ray spectrum.
There are many experiments looking for empirical evidence of axions via X-ray signals. The CERN Axion Solar Telescope is looking for X-rays as axions hypothetically generated in the solar core traverse a strong magnetic field in a laboratory here on Earth. The X-ray observatory, NuSTAR, is also searching for Solar X-rays from axions, but those converted to X-rays by the local Solar magnetic field, which would yield a strongly centrally peaked X-ray image of the sun. Recently, Chandra/HETGS spectra were used to place the most stringent limits to date on a light-axion-like particle coupling constant.
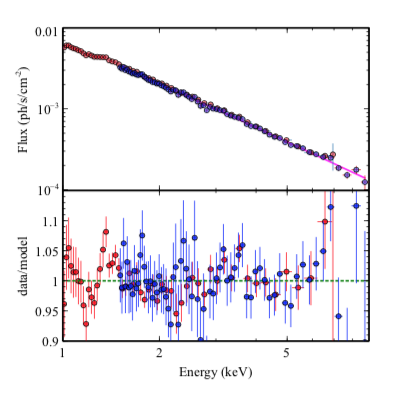
Figure 2: From Reynolds et al. (2020), the 490 ks HETGS spectrum of NGC 1275 nucleus in the Perseus cluster, fit with an absorbed powerlaw spectral model (top). The residuals (bottom) allowed more stringent limits to be established on the axion coupling parameter.
Reynolds et al. (2020) used a deep exposure of the X-ray bright nucleus NGC 1275 in the Perseus galaxy cluster to search for spectral signatures from axion-like particle scattering. Under reasonable models of the magnetic fields in the surrounding inter-galactic-medium, they predicted spectral distortions in the 1–9 keV region as expected from models of light axion-like particle interactions (and did many Monte-Carlo realizations of this energy-dependent signature). Due to the highly accurate calibration of the HETGS effective area and the featureless nature of the source spectrum, the limits on the amplitudes of observed spectral distortions allowed them to place limits on the axion coupling constant. Figure 2 shows their spectrum overlaid with the featureless best model, and the residuals which are likely dominated by the calibration uncertainty. Another conclusion the authors reached is that any improvement on this limit by future X-ray observatories will need even better calibrations than Chandra, to 1% or better in the effective area vs energy.
A Clumpy Wind Powering the Black Hole Cyg X-1
The Cyg X-1/HDE 226868 high mass X-ray binary system is one of the brightest known X-ray sources and is composed of a ∼15 M☉ black hole accreting material from the wind of its donor O9.7 Iab star. Such systems provide not only information about the high energy physics associated with black hole accretion but can also reveal conditions of the gas being transferred from the donor star. As part of a multi-paper effort to investigate the high resolution X-ray spectrum of the Cyg X-1/HDE 226868 binary, Hirsch et al. (2019) present Chandra-HETGS observations of the system taken close to superior conjunction. These ∼100 ks of data show significant variability in the form of dips corresponding to absorption features from the wind of the donor star.
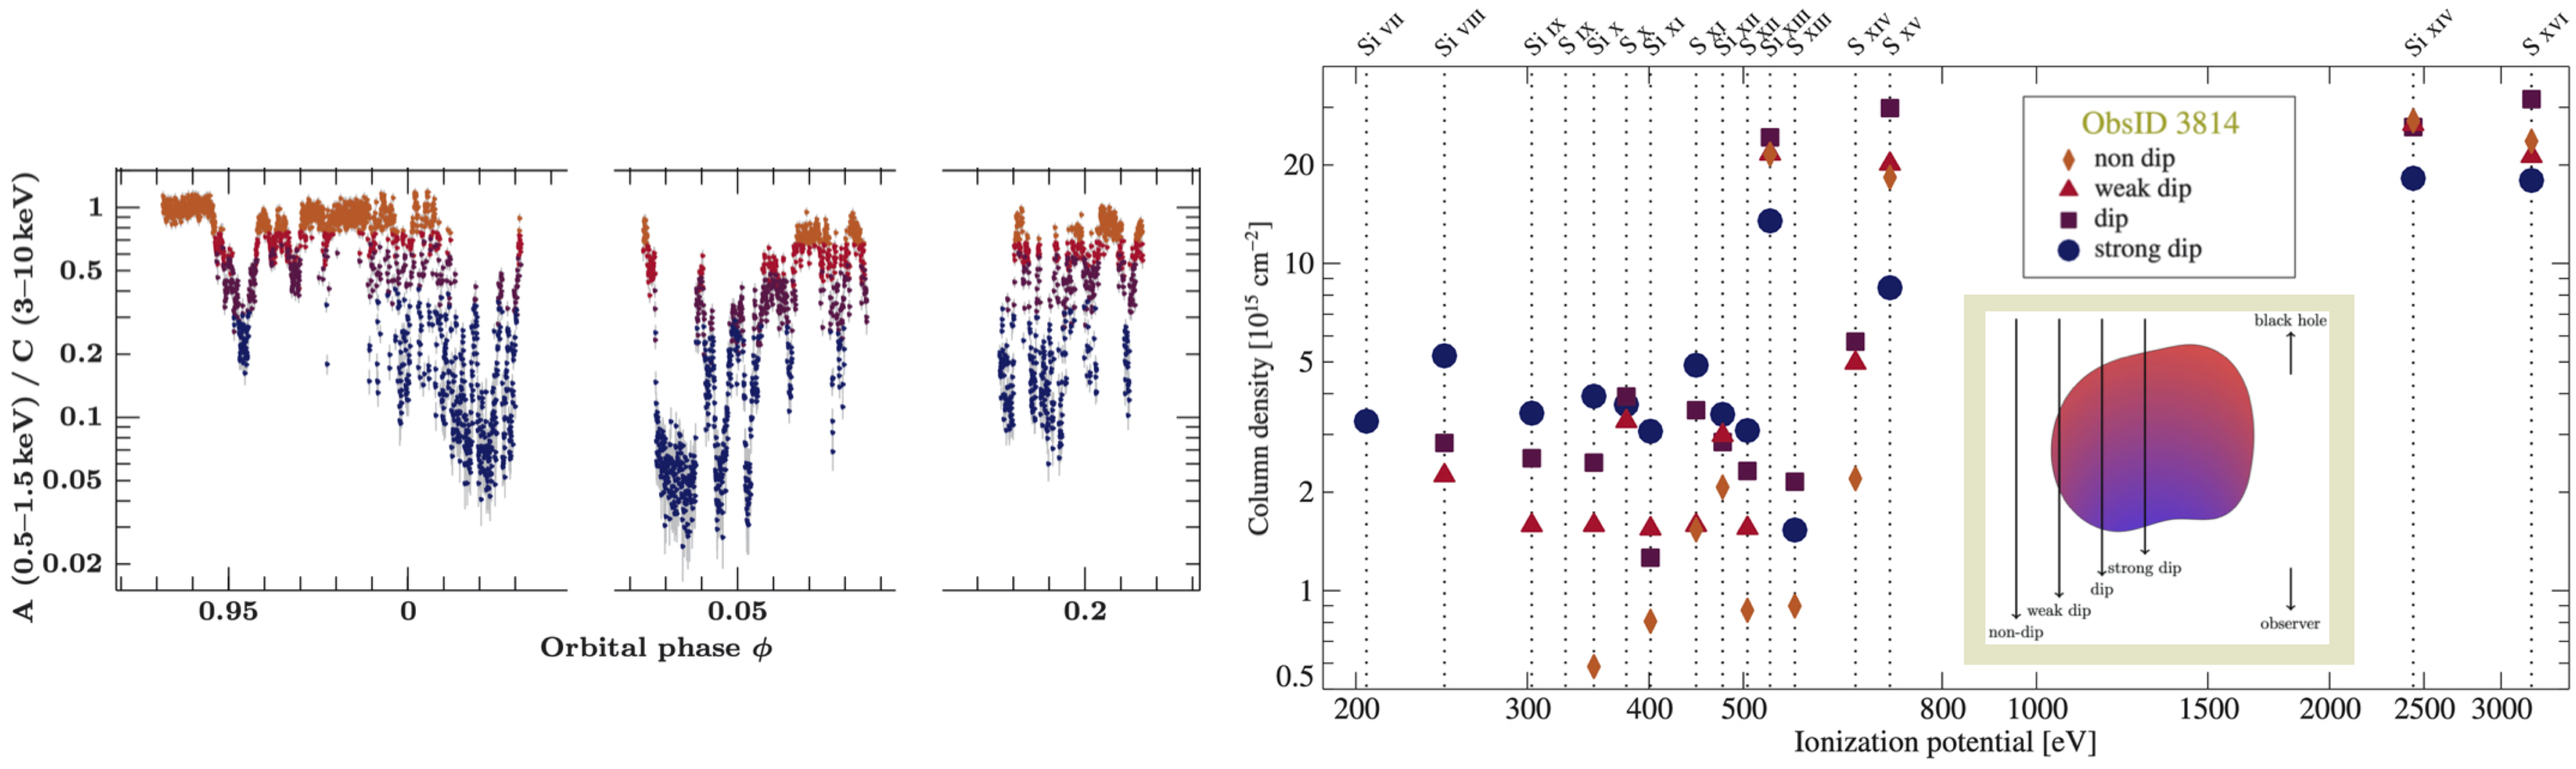
Figure 3: Left: X-ray hardness ratio light curve totaling ∼100 ks for the black hole binary Cyg X-1/HDE 226868. This ~15 M☉ black hole is powered by stellar wind from its donor O9.7 Iab star and exhibits prominent dips in its light curve attributed to variable obscuration from a clumpy wind. The colors in both figures represent different stages of obscuration with orange, red, purple, and blue increasing from no obscuration to strong obscuration in order. Right: Ionization potential versus column densities derived from the equivalent widths of absorption lines in Silicon and Sulfur for different dipping states (colors). The inset shows a wind clump sketch composed of regions with different ionizations (colors) as inferred from the ions with low ionization potential displaying high columns during the dip (relative to their non-dip state) and high ionization potential ions having low columns during the dip. Figures originally from Hirsch et al. (2019) have been modified for illustrative purposes.
The authors divide the X-ray light curve (Figure 3, left) into different dip stages with similar numbers of counts using color-color diagrams. For each stage, they find significant variations in the absorption line profiles of Si and S ions which they use to characterize the absorbing material (i.e, wind clumps). By measuring the change in equivalent widths of the absorption lines throughout the dip, they can infer a column density for that ion in the absorbing material. They find that the column densities of low ionization potential species (Figure 3, right) increases during the dipping state compared to its non-dipping state. They also find the reverse is true for high ionization potential species (i.e., low column density during the strong dipping state). This indicates that the absorbing wind material is highly structured with clumps of colder, denser material embedded in a highly ionized plasma (Figure 3, right inset). The Doppler velocities for each species was measured and displayed a similar trend within each observation suggesting the clump moves as a whole. While the orientation of this system does not show eclipses, a subset of the data was used to construct a ‘deep dip’ spectrum which revealed several emission features associated with the photoionized zone around the black hole.
The Role of X-ray Gas Outflows in the Seyfert Galaxy NGC 4151
Active Galactic Nuclei (AGN) feedback is a process by which relativistic jets and outflows from a central accreting supermassive blackhole interact with its host galaxy. Such a process can blow out material from the bulge of its host galaxy and as a result, quench star-formation. AGN winds have been detected as blueshifted absorption lines in the ultraviolet and X-rays with typical outflow speeds of ~ 100–1000s of km s−1. However, without knowledge of the extent and covering factor of the absorbing material, it is difficult to constrain how these outflows affect their host galaxies. Chandra HETGS is uniquely suited to investigate such outflows due to a combination of its high-spatial resolution in the 0th order image and its ability to observe with high spectral resolution Hydrogen- and Helium-like ions of C, N, O, Ne, Mg, Si emitted by the absorber.
A recent paper by Kraemer et al. (2020) used Chandra-HETGS to quantify the mass and outflow rate of ionized gas from the Seyfert 1.5 Galaxy NGC 4151. As described in a previous HETGS observation by Ogle et al. 2000, NGC 4151 displays a spatially extended narrow line region (NLR) with several emission features. The 240 ks observation presented in Kraemer et al. (2020) was performed such that the axis of the NLR was perpendicular to the HETGS dispersion direction allowing the mapping of extended emission line structure. They find results consistent with Ogle et al. 2000 that show much of the soft X-ray emission coming from the NLR. They determine the radial velocity of their strongest emission lines and compare them to their ionization potential (IP) in Figure 4. They find no clear relationship between radial velocity and IP and conclude that the X-ray emitting gas is a single kinematic component consistent with optical and UV results.

Figure 4: Top: Radial velocity measurements as a function of ionization potential (IP) for bright emission lines in the X-ray spectrum of the Seyfert 1.5 Galaxy NGC 4151 using HETGS (Kraemer et al. 2020) and XMM (Armentrout et al. 2007). While the X-ray line emitting gas is composed of multiple ionization components, the lack of a trend between radial velocity and IP suggests a single kinematic component. Bottom: Mass outflow rate as a function of deprojected radial distance for the X-ray (black) and optical/UV (red) components in NGC 4151. While the optical/UV mass outflow rate drops off > 100 pc, the X-ray component continues to increase indicating that X-ray gas may have a greater impact on its host galaxies at these distances. Figures from Kraemer et al. (2020).
The authors used CLOUDY to generate photoionization model grids in order to determine the physical properties of the global X-ray outflow from the first order spectra. Using the spatially-extended components in the 0th order images and the average velocity of the emission lines they calculate the mass outflow rate as a function of deprojected radial distance as shown in Figure 4. This X-ray outflow in NGC 4151 is compared to the optical/UV outflow reported for the same object in Crenshaw et al. 2015 from HST STIS data. The X-ray and optical/UV gas components have similar mass and peak mass outflow rate indicating they are both an important component in AGN-driven winds. Unlike the optical/UV component, the X-ray component does not drop in outflow rate for radii > 100 pc suggesting it may have a greater impact on its host galaxy at these distances.
Bibliography
- Argiroffi, C., Reale, F., Drake, J. J., et al. 2019, Nature Astronomy, 3, 742
- Armentrout, B. K., Kraemer, S. B., & Turner, T. J. 2007, ApJ, 665, 237
- Hirsch, M., Hell, N., Grinberg, V., et al. 2019, A&AP, 626, A64
- Kraemer, S. B., Turner, T. J., Couto, J. D., et al. 2020, MNRAS, 493, 3893
- Reynolds, C. S., Marsh, M. C. D., Russell, H. R., et al. 2020, ApJ, 890, 59
- Schulz, N. S., Dewey, D., & Marshall, H. L. 1998, Society of Photo-Optical Instrumentation Engineers (SPIE) Conference Series, Vol. 3444, Absolute effective areas of the HETGS, ed. R. B. Hoover & A. B. Walker, 160–176