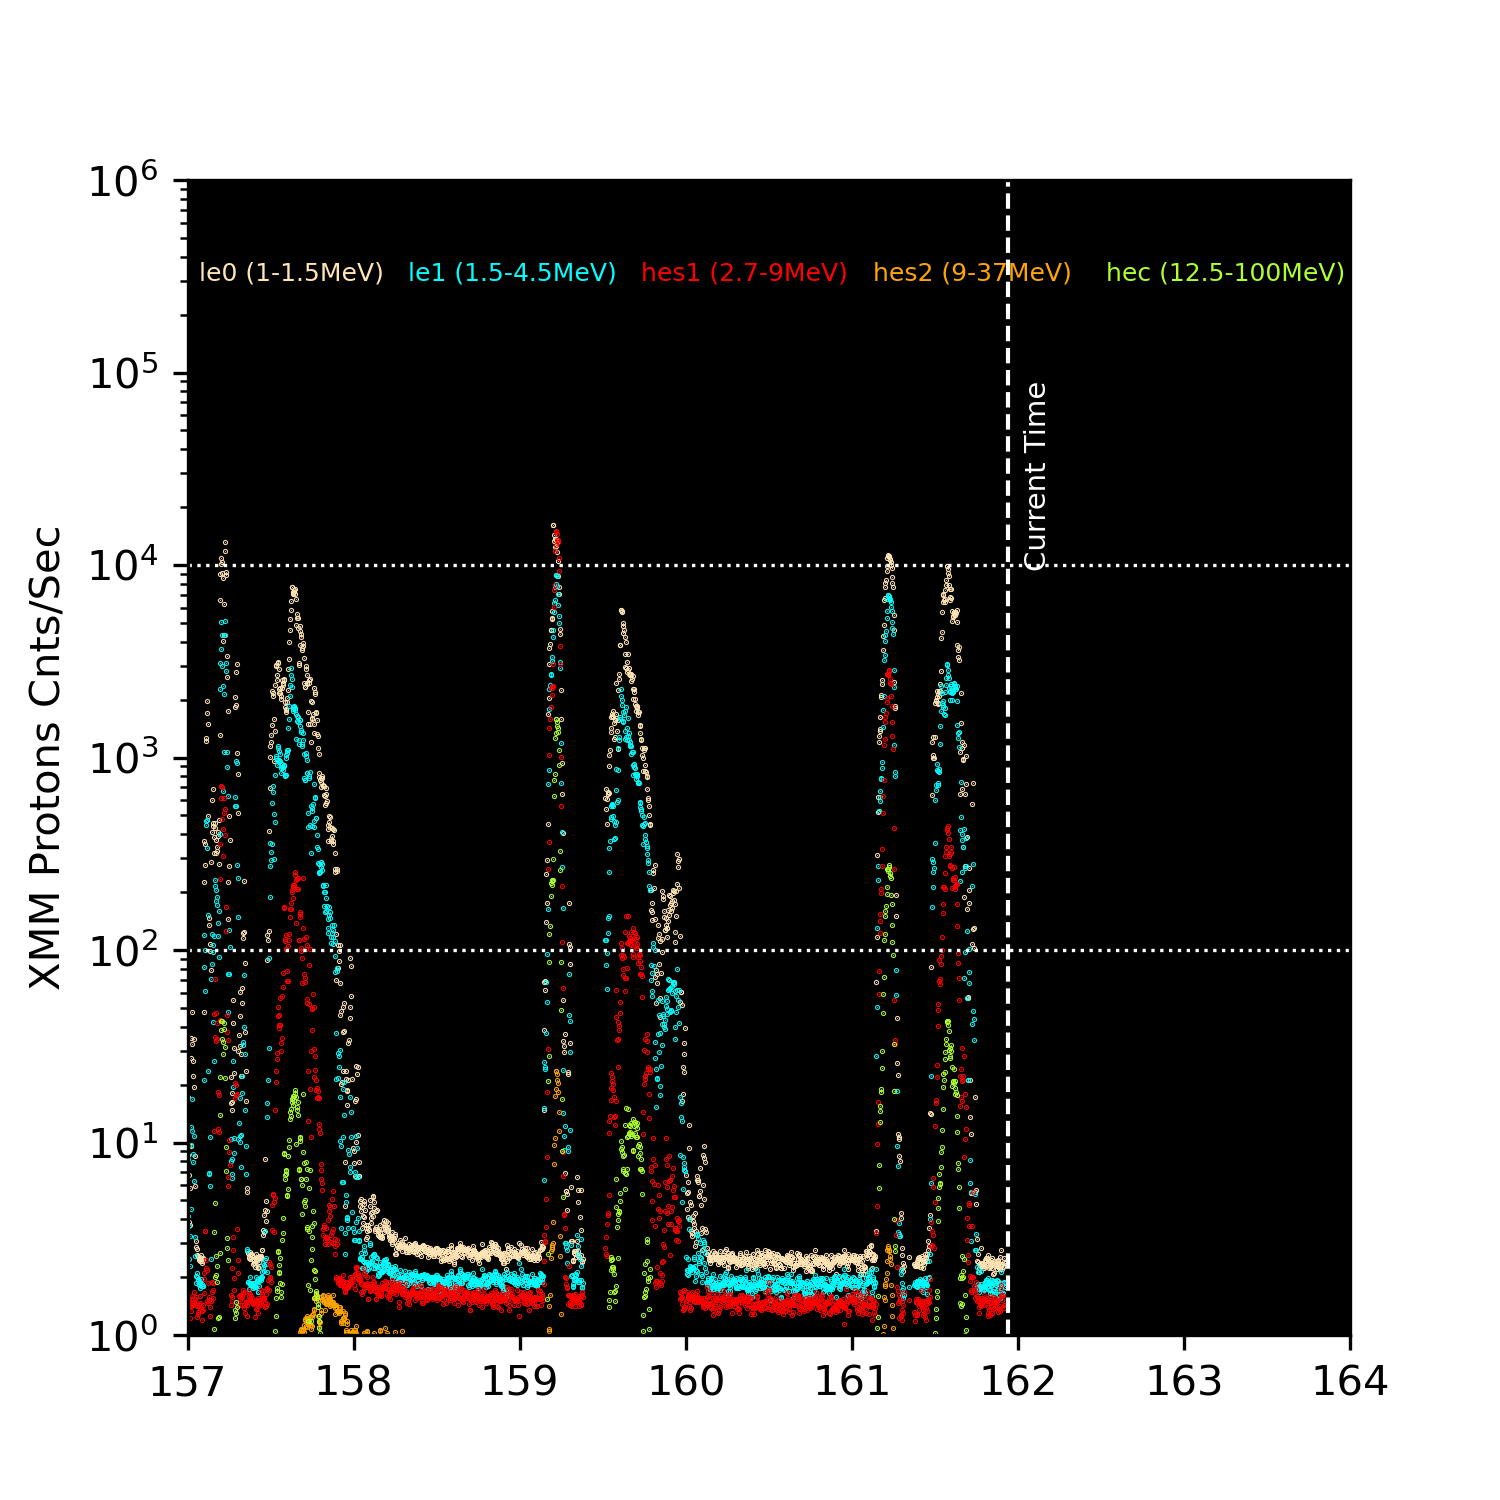
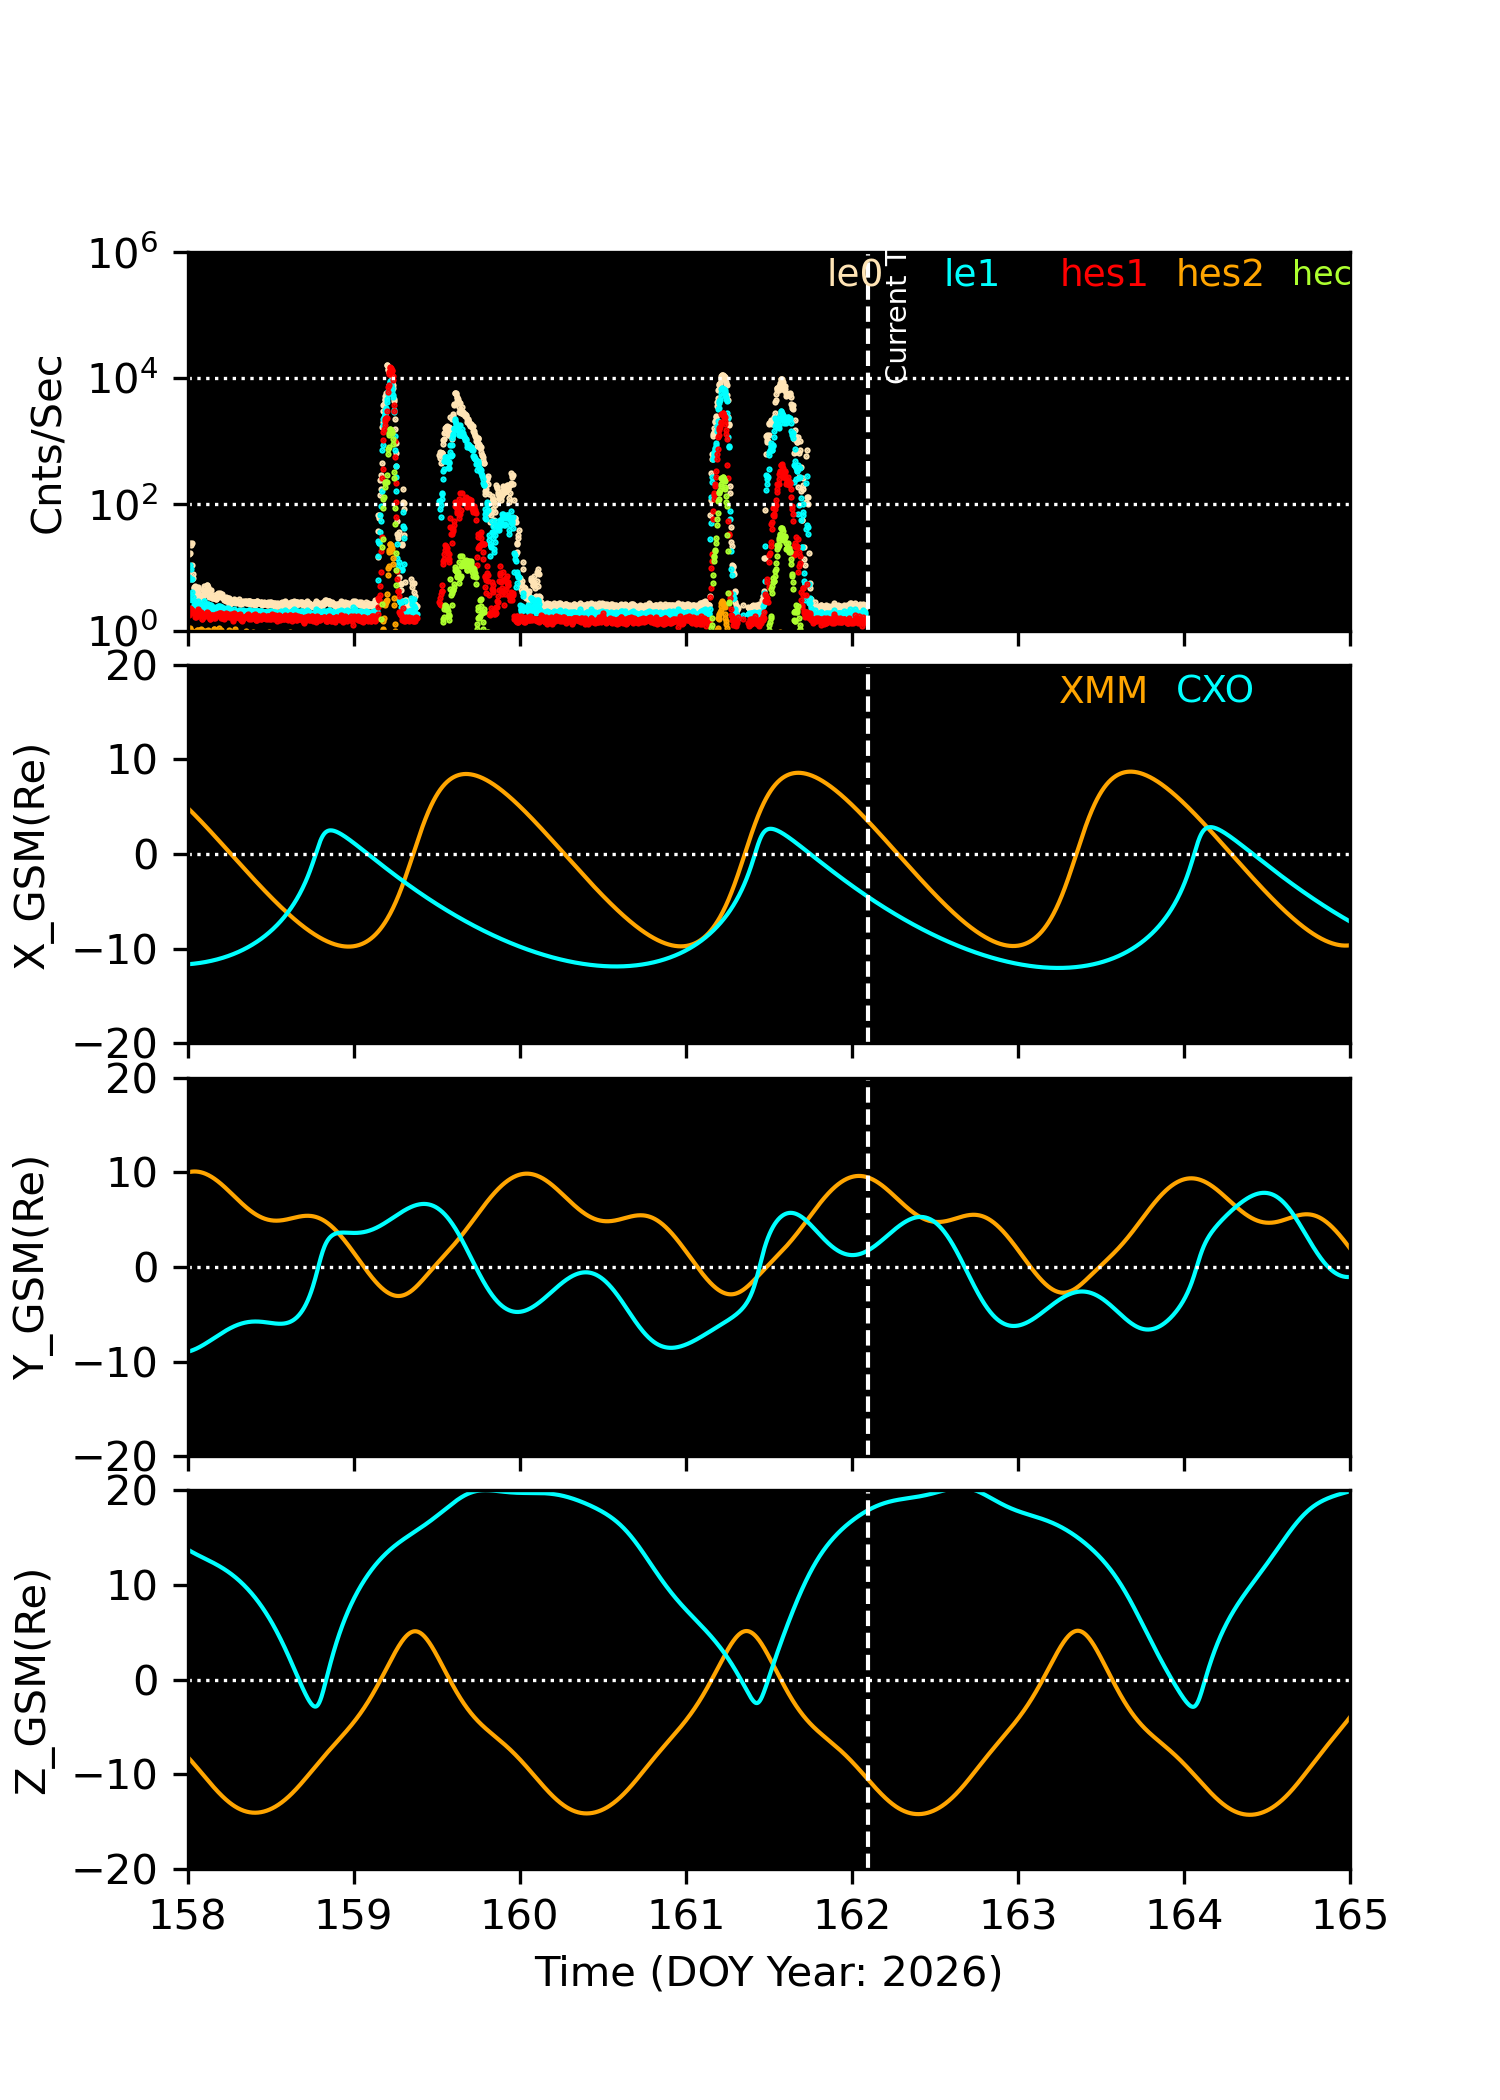
                                        Most recent XMM radiation observations
                                 Differential Flux particles/cm2-s-ster-MeV

 UT Date   Time    ---------------------------------- Protons MeV -------------------------------
                          LE1          LE2         HES1         HES2         HESC
  YR MO DA HHMM          1-1.5       1.5-4.5       2.7-9        9-37       12.5-100
2026-Jun09-22:30        1.902        0.465        1.433        0.535        0.394
2026-Jun09-23:30        1.880        0.429        1.465        0.556        0.417
2026-Jun10-00:30        1.842        0.463        1.498        0.495        0.396
2026-Jun10-01:30        1.762        0.444        1.462        0.503        0.397
2026-Jun10-02:30        1.932        0.413        1.436        0.495        0.390
2026-Jun10-03:30      127.276        0.445       13.788        0.549        1.521
2026-Jun10-04:30     2001.564        0.509      707.472        1.087       68.423
2026-Jun10-05:30     6059.969        0.703     2202.802        2.207      211.719
2026-Jun10-06:30      544.178        0.444       55.582        0.558        4.348
2026-Jun10-07:30        1.795        0.439        1.371        0.488        0.413
2026-Jun10-08:30        1.775        0.436        1.525        0.511        0.507
2026-Jun10-09:30        1.845        0.408        1.421        0.522        0.402
2026-Jun10-10:30        1.837        0.452        1.384        0.503        0.386
2026-Jun10-11:30      134.753        0.446        3.208        0.540        0.572
2026-Jun10-12:30     1111.429        0.452       53.695        0.553        4.762
2026-Jun10-13:30     2250.922        0.466      285.301        0.767       28.953
2026-Jun10-14:30     2273.331        0.478      269.584        0.704       25.322
2026-Jun10-15:30     1072.843        0.448       79.945        0.557        6.641
2026-Jun10-16:30      185.195        0.434       11.110        0.513        1.106
2026-Jun10-17:30       51.734        0.454        2.375        0.494        0.455
2026-Jun10-18:30        1.857        0.417        1.479        0.533        0.406
2026-Jun10-19:30        1.814        0.451        1.458        0.497        0.421
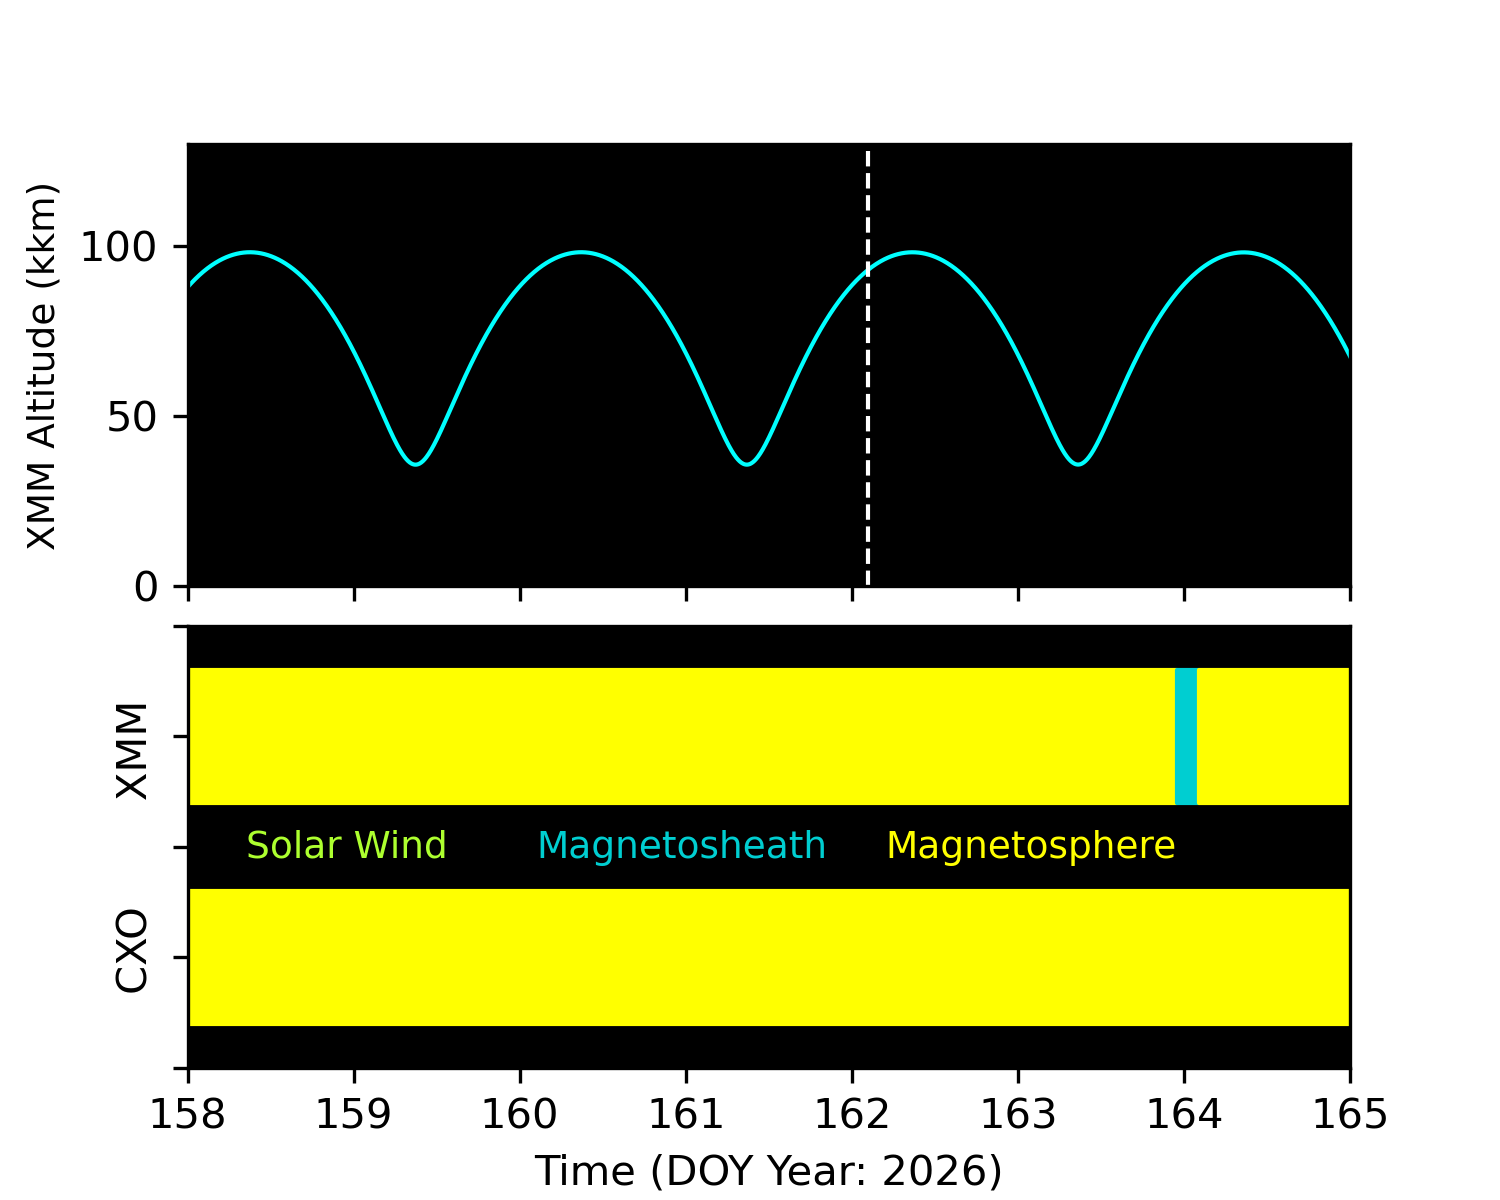
The following plots show the orbits of CXO and XMM in GSM coordinates. The left plot is in X-Y plane, and the right plot is in X-Z plane. If the orbit is in green, the satellite is in the solar wind area, if it is in light blue, the satellite is in magnetosheath, and if it is in yellow, the satellite is in magnetosphere.
The periods of the plotted orbits are +/-1.35 days from the current satellite positions (*), and the orange pentagon (*) mark the positions of one day ago.
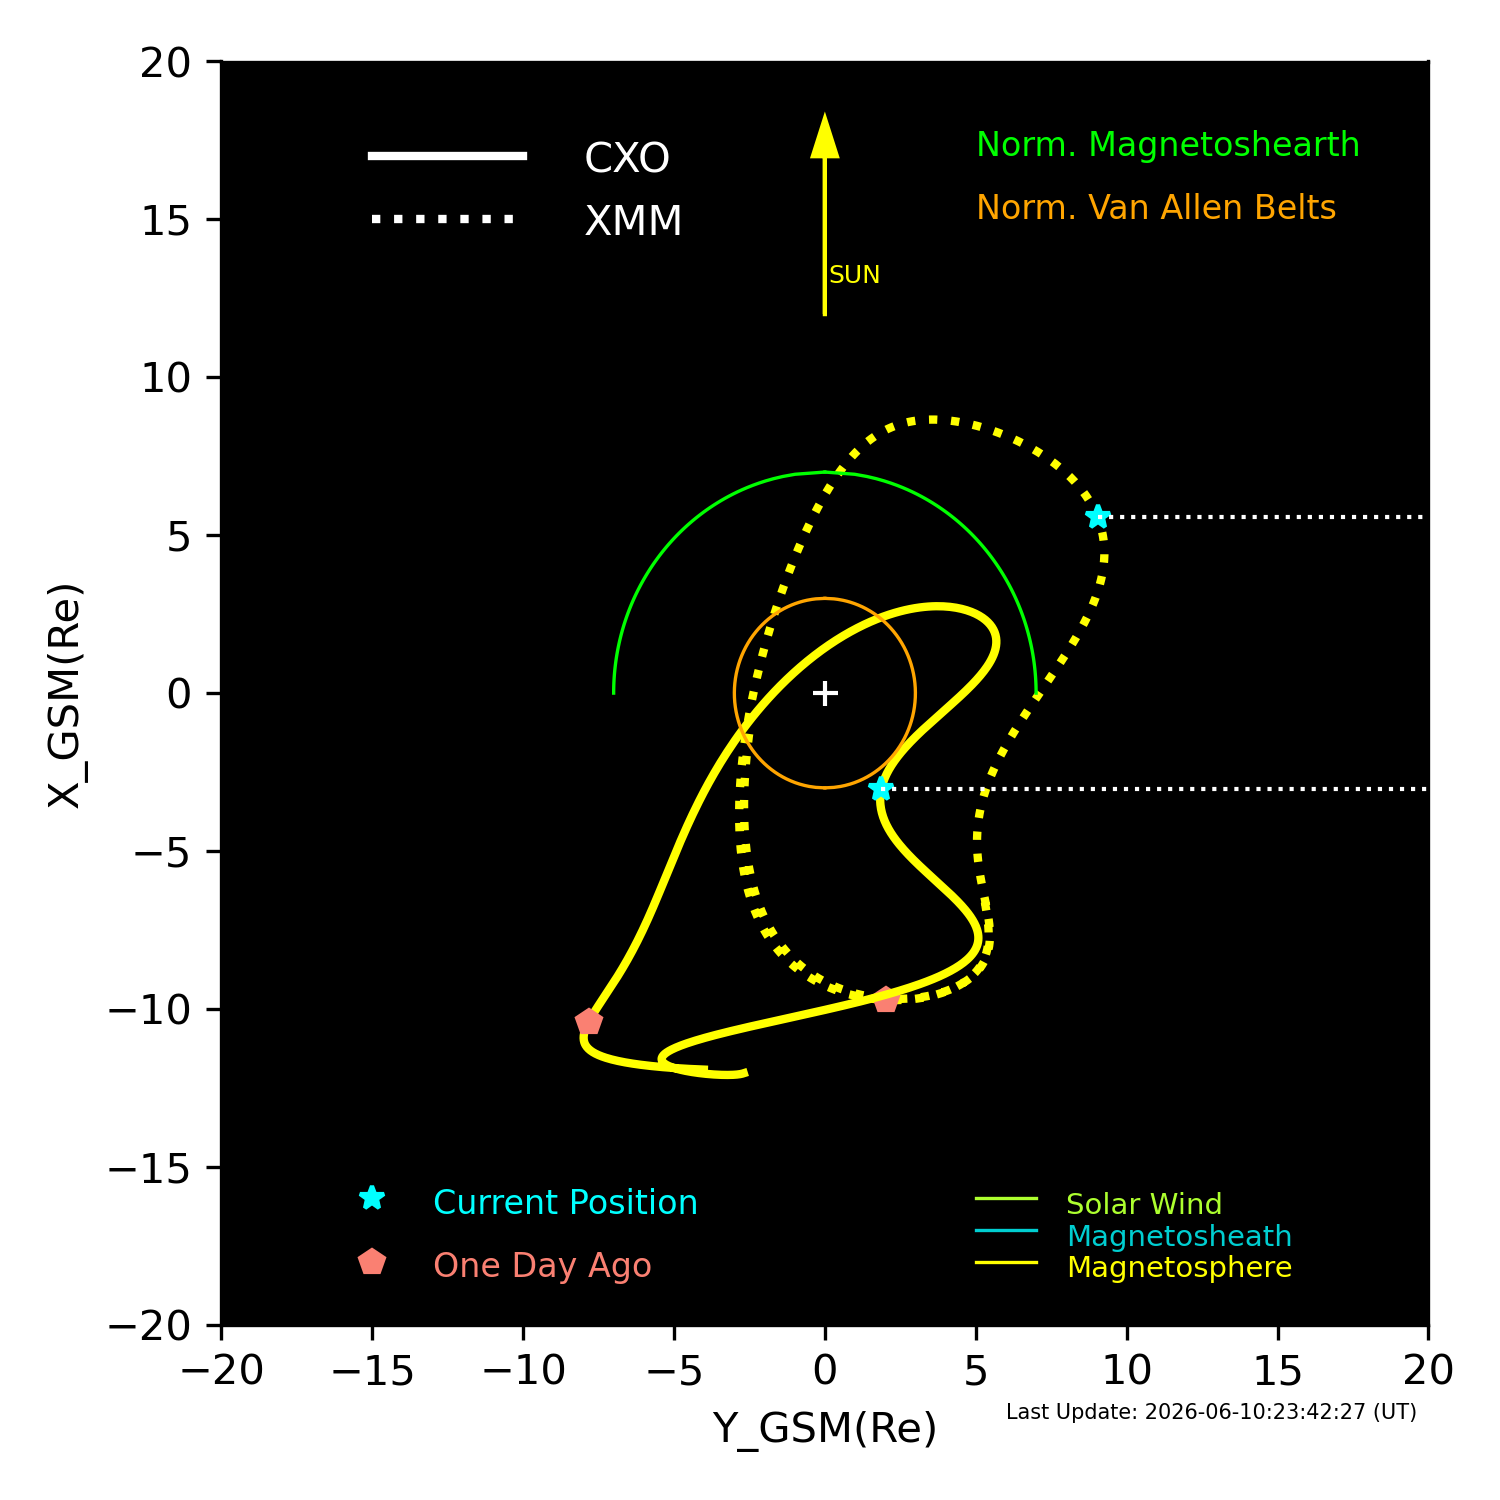
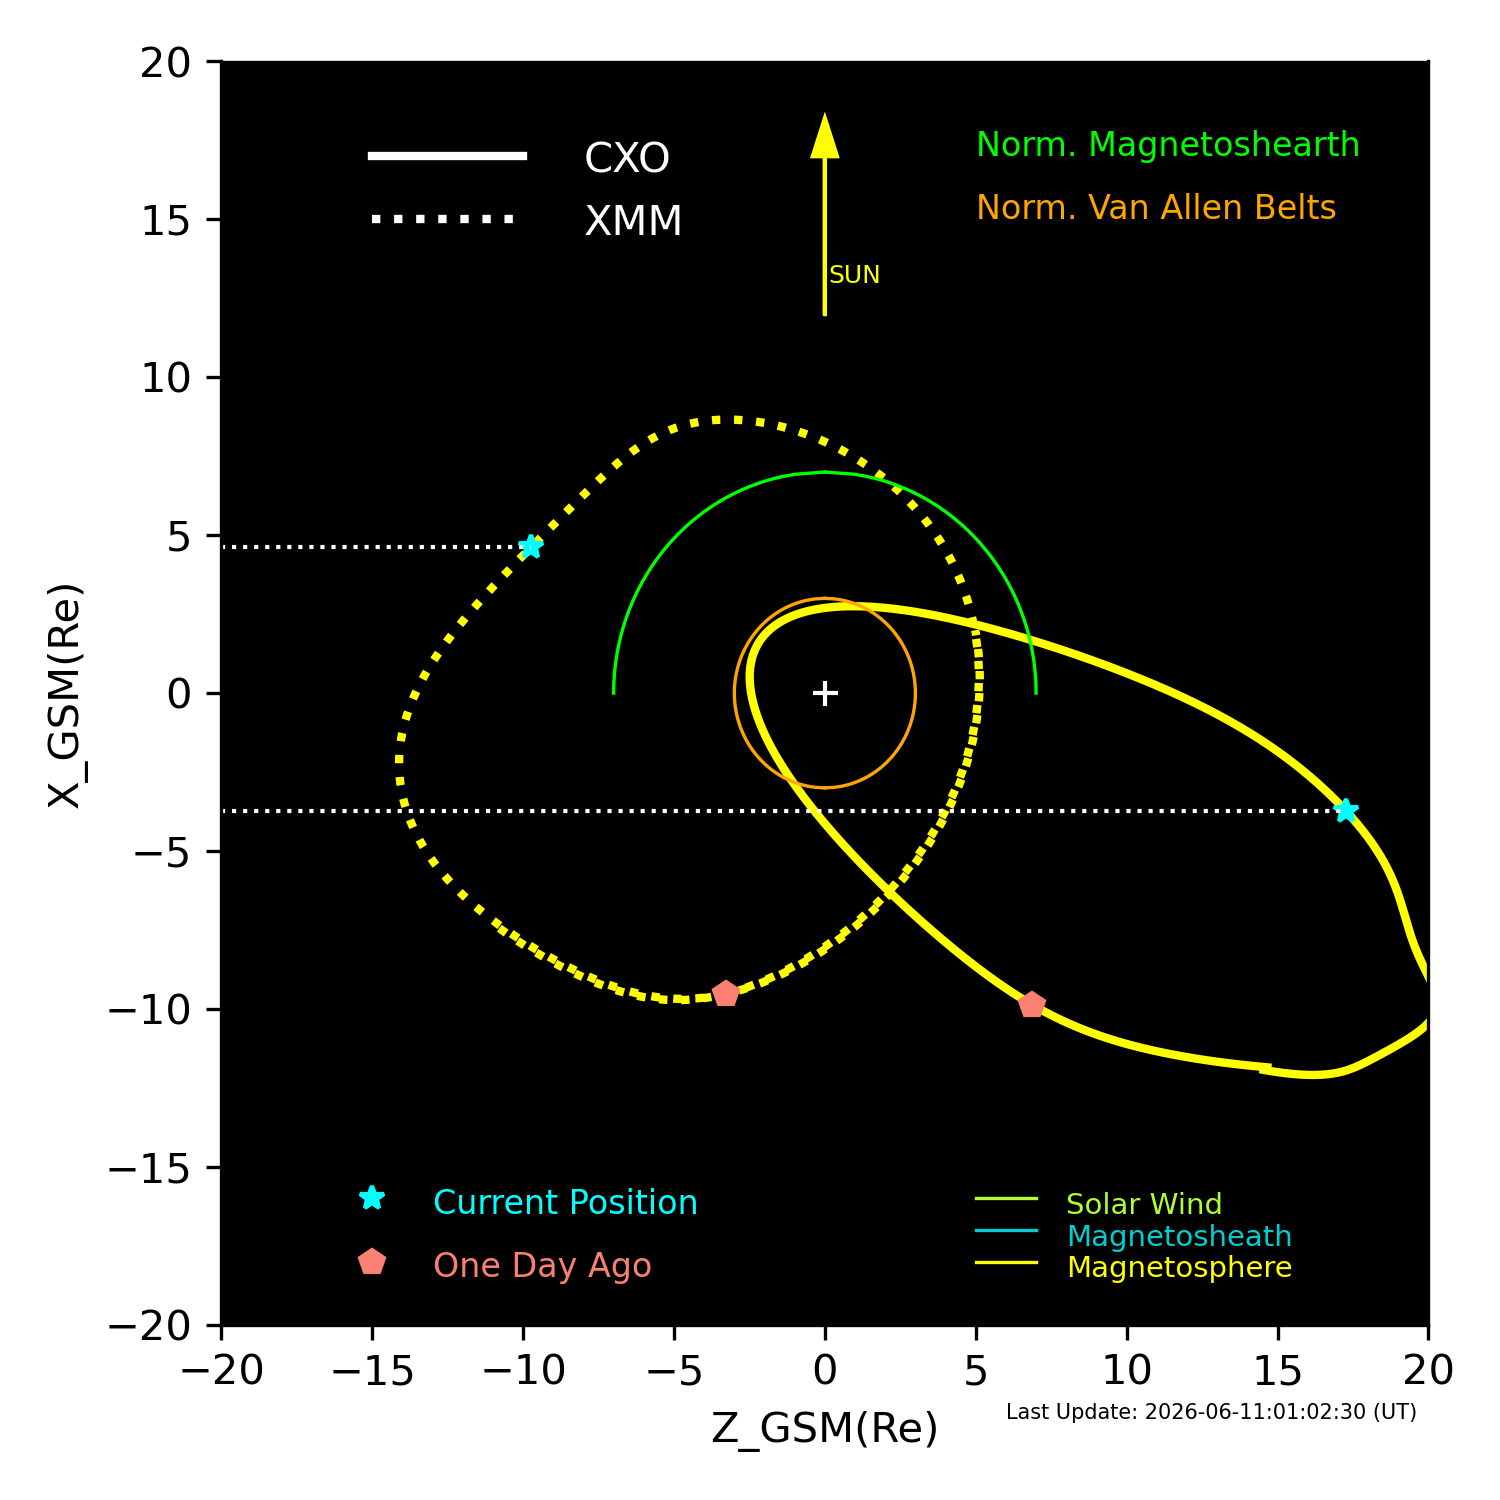
XMM and CXO orbits in GSM coordinates.
Email problems to: swolk
(Scott Wolk)
...it is all his fault