| Science Run Stop: | 2013:05:24:20:41 |
| Science Run Start: | 2013:05:25:11:56 |
| Interruption: | 54.0ks |
| Triggered by: | manual |
Go to:
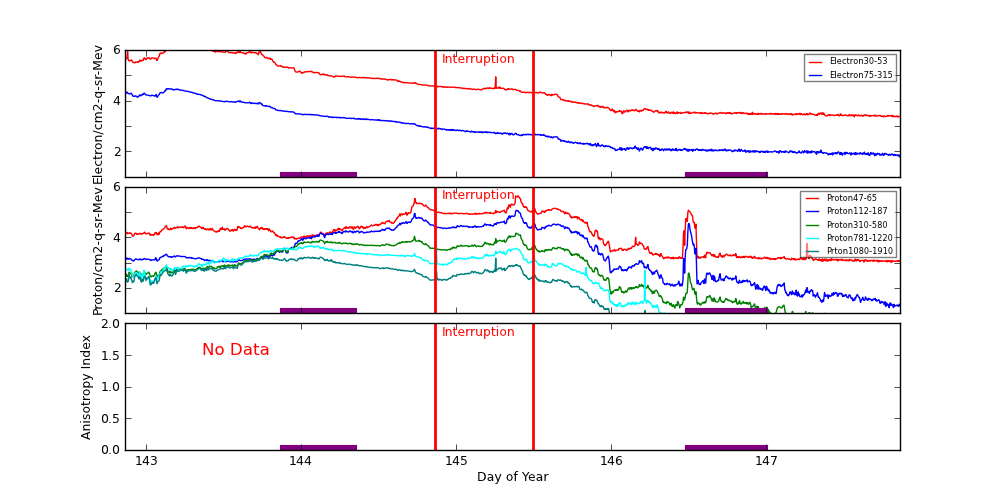
ACE Plot (E38/E175, P47/P112/P310/P761/P1060, Anisotopy)
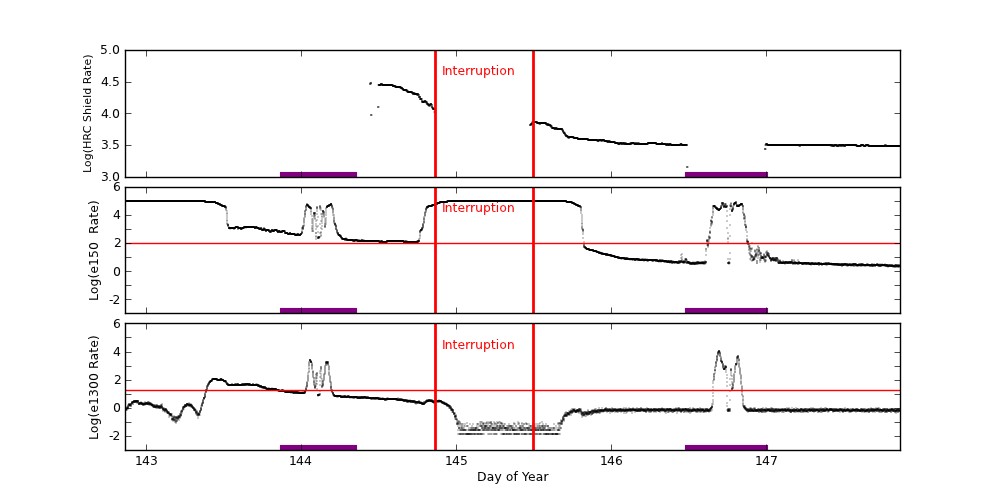
EPHIN Plot (HRC Shield Rate/E150/E1300)
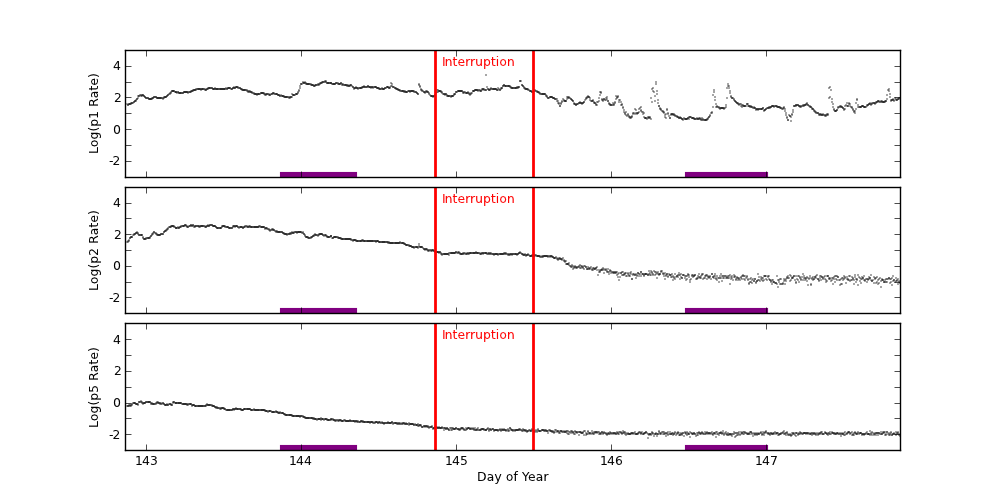
GOES-15 Plot (P1/P2/P5)
ACE radiation data are plotted around periods when science runs were interrupted. Plots start exactly 2 days before the interruption started. The top panel shows differential fluxes of electrons 38-53 and 175-315 (particles/cm2-s-ster-MeV), the middle panel shows differential fluxes of protons 47-65, 112-187, and 310-580 (particles/cm2-s-ster-MeV), and the bottom panel shows anisotropy ratio. The original data are prepared by the U.S. Dept. of Commerce, NOAA, Space Environment Center.
Data Period  (dom): 142.8618 - 147.8618
Interruption (dom): 144.8618 - 145.4972
			Avg		 Max		Time	Min		Time		Value at Interruption Started
--------------------------------------------------------------------------------------------------------------------------
e38 		1.963e+05+/-3.821e+05	1.690e+06	143.271 	2.230e+03	147.847		2.310e+03
e175		3.453e+03+/-6.423e+03	2.990e+04	143.139 	6.000e+01	147.858		6.410e+01
p47 		3.812e+04+/-5.706e+04	4.350e+05	145.396 	1.020e+03	147.806		1.140e+03
p112		1.101e+04+/-1.672e+04	1.170e+05	145.385 	1.670e+01	147.792		2.100e+01
p310		2.225e+03+/-2.725e+03	1.480e+04	145.385 	2.120e+00	147.826		2.930e+00
p761		1.045e+03+/-1.199e+03	4.700e+03	144.066 	7.370e-01	147.830		7.670e-01
p1060		3.718e+02+/-4.456e+02	1.650e+03	144.045 	2.180e-01	147.781		3.240e-01
anisotropy	0.000e+00+/-0.000e+00	0.000e+00	0.000 	1.000e+10	0.000		-1.000e+00

Hardness:
e38/e175	4.442e+01+/-1.830e+01	1.752e+02	145.254 	1.957e+01	142.889		3.604e+01
p47/p1060	9.641e+02+/-2.353e+03	2.518e+04	146.493 	6.125e+00	143.990		3.519e+03
p112/p1060	1.074e+02+/-3.849e+02	6.272e+03	146.496 	1.063e+00	143.795		6.481e+01
p310/p1060	1.067e+01+/-6.926e+00	7.094e+01	146.496 	1.059e+00	143.278		9.043e+00
p761/p1060	3.472e+00+/-1.507e+00	3.845e+01	146.215 	8.451e-01	143.014		2.367e+00

Steepest Rise
------------
	Time		Slope(in log per hr)
----------------------------------------
e1  	143.1285		619194.4185
e175	143.1215		11759.8940
p47 	145.3646		331197.0146
p112	145.3681		61199.4483
p310	145.3333		5351.9518
p761	144.8542		3178.7713
p1060	145.2361		1276.7885
Two vertical red lines indicate the start and the end of the interruption. Purple hatched areas indicate that the satellite is in the radiation belt.
EPHIN Data are used to trigger science run interruptions. The trigger levels are:
| HRC Shield Rate | NA | |
| E150 | 100 | Counts/cm2 sec sr eV |
| E1300 | 20 | Counts/cm2 sec sr eV |
		Avg			Max		Time		Min		Time		Value at Interruption Started
--------------------------------------------------------------------------------------------------------------------------
hrc	hrc	6.431e+03 +/- 7.030e+03		3.034e+04	144.444		1.424e+03	146.487		NA
e150	3.115e+04 +/- 4.215e+04		9.884e+04	145.119		1.720e+00	148.044		5.486e+04
e1300	8.467e+01 +/- 5.906e+02		1.027e+04	146.694		1.000e-04	145.028		2.932e+00
Two vertical red lines indicate the start and the end of the interruption. Red horizontal lines indicate SCS 107 limits. Purple hatched areas indicate that the satellite is in the radiation belt.
GOES-15 data are taken from NOAA site (http://goes.ngdc.noaa.gov).
| P1 | .8 - 4.0 | MeV protons (Counts/cm2 sec sr MeV) Uncorrected |
| P2 | 4.0 - 9.0 | MeV protons (Counts/cm2 sec sr MeV) Uncorrected |
| P5 | 40.0 - 80.0 | MeV protons (Counts/cm2 sec sr MeV) Uncorrected |
		Avg			Max		Time		Min		Time		Value at Interruption Started
--------------------------------------------------------------------------------------------------------------------------
p1	2.005e+02 +/- 2.197e+02		2.470e+03	145.194		3.310e+00	147.160		1.510e+02
p2	5.819e+01 +/- 1.012e+02		3.860e+02	143.417		4.840e-02	147.073		7.950e+00
p5	1.456e-01 +/- 2.616e-01		1.190e+00	142.965		6.100e-03	146.233		2.480e-02
Two vertical red lines indicate the start and the end of the interruption. Red horizontal lines indicate SCS 107 limits. Purple hatched areas indicate that the satellite is in the radiation belt.