| Science Run Stop: | 2001:10:02:06:40 |
| Science Run Start: | 2001:10:03:12:00 |
| Interruption: | 105.0ks |
| Triggered by: | auto |
Go to:
ACE Plot (E38/E175, P47/P112/P310/P761/P1060, Anisotopy)
EPHIN Plot (P4/P41/E1300)
GOES-11 Plot (P1/P2/P5)
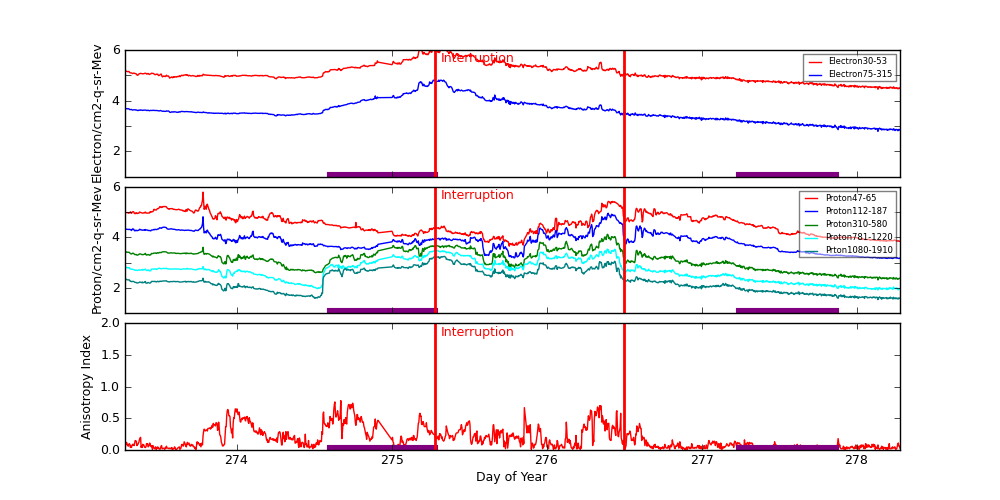
ACE radiation data are plotted around periods when science runs were interrupted. Plots start exactly 2 days before the interruption started. The top panel shows differential fluxes of electrons 38-53 and 175-315 (particles/cm2-s-ster-MeV), the middle panel shows differential fluxes of protons 47-65, 112-187, and 310-580 (particles/cm2-s-ster-MeV), and the bottom panel shows anisotropy ratio. The original data are prepared by the U.S. Dept. of Commerce, NOAA, Space Environment Center.
Data Period  (dom): 273.2778 - 278.2778
Interruption (dom): 275.2778 - 276.5000
			Avg		 Max		Time	Min		Time		Value at Interruption Started
--------------------------------------------------------------------------------------------------------------------------
e38 		1.783e+05+/-2.056e+05	1.440e+06	275.333 	2.820e+04	278.135		3.020e+04
e175		6.996e+03+/-1.082e+04	6.480e+04	275.302 	6.120e+02	278.135		6.880e+02
p47 		4.989e+04+/-4.973e+04	6.110e+05	273.781 	4.480e+03	275.757		7.130e+03
p112		1.019e+04+/-1.085e+04	8.920e+04	276.396 	1.460e+03	278.229		1.530e+03
p310		1.889e+03+/-1.720e+03	1.310e+04	276.389 	2.080e+02	278.135		2.350e+02
p761		7.373e+02+/-7.199e+02	3.420e+03	276.389 	8.300e+01	278.135		9.120e+01
p1060		3.170e+02+/-3.410e+02	1.770e+03	275.337 	3.470e+01	278.135		3.900e+01
anisotropy	1.763e-01+/-1.676e-01	7.800e-01	274.670 	1.000e-02	273.455		3.000e-02

Hardness:
e38/e175	3.303e+01+/-7.729e+00	4.867e+01	276.347 	1.372e+01	275.299		4.390e+01
p47/p1060	3.334e+02+/-2.996e+02	2.514e+03	273.781 	1.200e+01	275.417		1.828e+02
p112/p1060	5.577e+01+/-4.174e+01	2.667e+02	273.781 	4.867e+00	275.333		3.923e+01
p310/p1060	7.781e+00+/-3.710e+00	1.972e+01	274.226 	2.119e+00	274.559		6.026e+00
p761/p1060	2.551e+00+/-5.315e-01	4.286e+00	274.003 	1.031e+00	274.698		2.338e+00

Steepest Rise
------------
	Time		Slope(in log per hr)
----------------------------------------
e1  	275.3160		771604.3440
e175	275.1667		39600.2229
p47 	273.7639		602403.3914
p112	273.7639		55440.3121
p310	276.3750		6900.0388
p761	274.9931		2472.0139
p1060	274.9931		967.2054
Two vertical red lines indicate the start and the end of the interruption. Purple hatched areas indicate that the satellite is in the radiation belt.
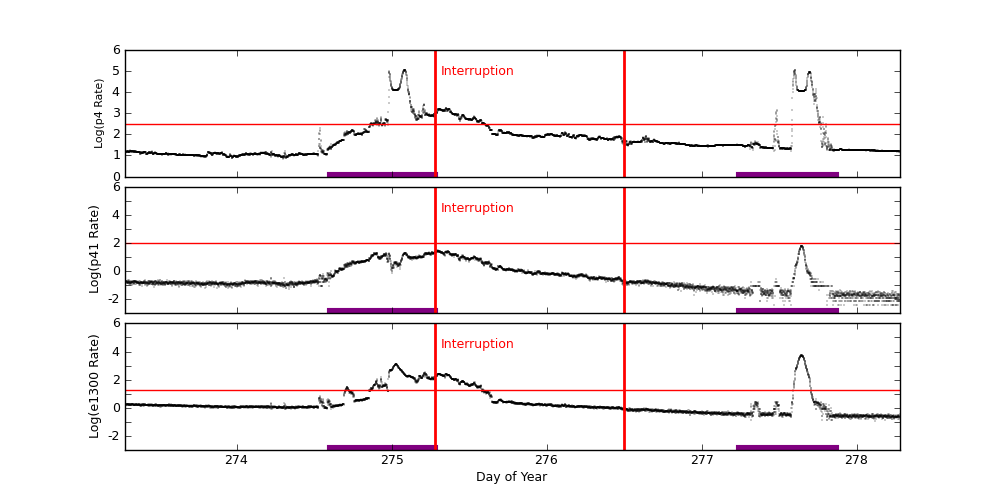
EPHIN Data are used to trigger science run interruptions. The trigger levels are:
| P4 | 300 | Counts/cm2 sec sr MeV |
| P41 | 10 | Counts/cm2 sec sr MeV |
| E1300 | 20 | Counts/cm2 sec sr MeV |
		Avg			Max		Time		Min		Time		Value at Interruption Started
--------------------------------------------------------------------------------------------------------------------------
p4	2.118e+03 +/- 1.110e+04		1.169e+05	275.084		7.177e+00	274.300		9.756e+02
p41	2.481e+00 +/- 5.998e+00		6.216e+01	277.640		1.000e-04	274.223		2.041e+01
e1300	6.895e+01 +/- 3.972e+02		5.285e+03	277.644		1.000e-04	277.372		1.560e+02
Two vertical red lines indicate the start and the end of the interruption. Red horizontal lines indicate SCS 107 limits. Purple hatched areas indicate that the satellite is in the radiation belt.
GOES-11 data are taken from NOAA site (http://goes.ngdc.noaa.gov).
| P1 | .8 - 4.0 | MeV protons (Counts/cm2 sec sr MeV) Uncorrected |
| P2 | 4.0 - 9.0 | MeV protons (Counts/cm2 sec sr MeV) Uncorrected |
| P5 | 40.0 - 80.0 | MeV protons (Counts/cm2 sec sr MeV) Uncorrected |
		Avg			Max		Time		Min		Time		Value at Interruption Started
--------------------------------------------------------------------------------------------------------------------------
p1	6.508e+02 +/- 4.898e+03		9.310e+04	275.333		1.690e+01	277.264		3.580e+02
p2	5.250e+01 +/- 9.158e+02		3.270e+04	277.924		2.580e-02	278.104		1.590e+02
p5	2.583e+01 +/- 9.156e+02		3.270e+04	277.924		3.360e-03	278.031		1.470e+00
Two vertical red lines indicate the start and the end of the interruption. Red horizontal lines indicate SCS 107 limits. Purple hatched areas indicate that the satellite is in the radiation belt.
