MARX vs. ChaRT
| Introduction |
| LSF Reference Data |
| Building LSFPARMS |
| Caveats |
| Validation |
| Summary |
| Other Links |
| isis |
| mit/cxc |
| ciao |
| caldb |
MARX vs. ChaRT
The internal HRMA model in marx is a simple ray tracing model with multi-conic sections. On the other hand, ChaRT (driven by SAOSAC) uses a finite-element method to perform ray traces more rigorously. Supposedly the ray trace with ChaRT could produce more articulate PSF. So we check to see if there are any noticeable difference between marx and ChaRT.Comparison of Integrated Line Profiles
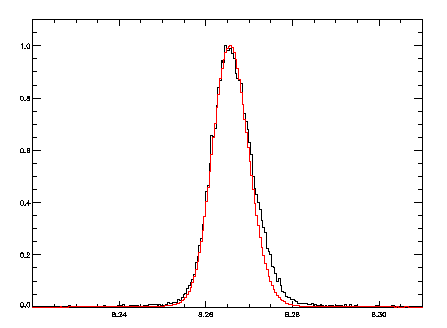
HEG
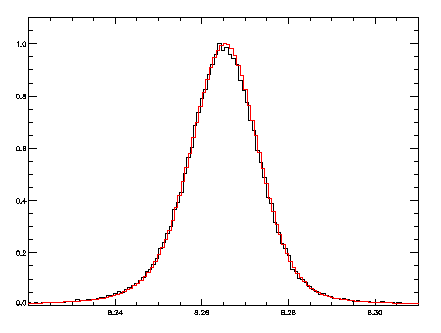
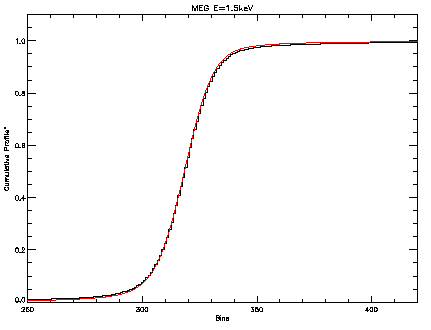
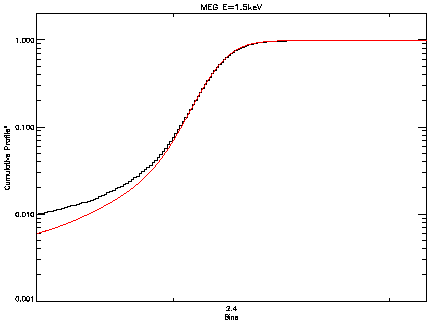
MEG
Notice that the whooping mismatch in the red wing of LSF for HEG in Figure 15. This probably results from a slightly misaligned HRMA mirror shell used for HEG, generating more assymetric line profile than anticipated with marx.
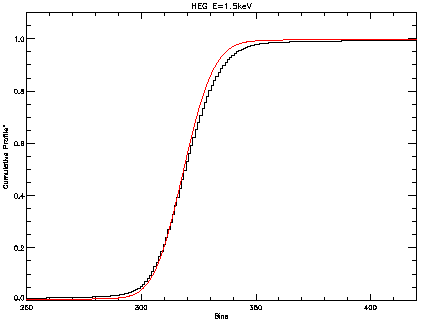
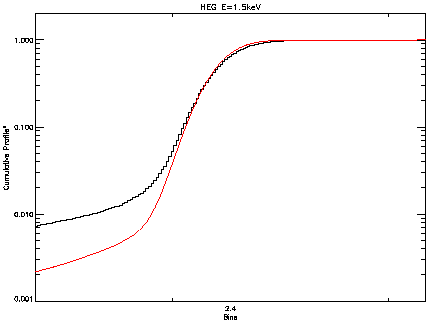
Plots of cumulative line fluxes (cumulated from left to right across the line profile) illustrates the same trend. In the middle panel of Figure 15, the difference between MARX and ChaRT grows most dramatically after the bin #320 (which nearly corresponds to the Gaussian center of the line profile) or after the cumulative power = 0.5. The cumulative plots are all normalized. Also notice in the bottom plot of Figure 15 that the wing of LSF in MARX simulation is also underestimated when compared with ChaRT. Figure 16 shows the same for MEG +1 order. While the difference in the core of LSF is small, it is also clear from the bottom panel that the wing of LSF is still underestimated in MARX. However, the magnitude of the difference is quite small; and therefore the detector background would be likely to swamp the difference. In any case, every user should be aware that the current LSF model may not be absolutely perfect.
At this point we are waiting for the HRMA Cal group to provide us the best calibration of PSF to show which model represents true PSF more accurately (From Priv. Comm.: apparently ChaRT gives a very slightly broader PSF wing compared to the flight calibration dataset, though that doesn't mean that marx gives more accurate PSF either. So ChaRT and marx would eventually have to come to an agreement. That's for future release, folks). On the positive note, the comparison of MEG line profiles looks fine (so does MEG -1, not shown here).
| Previous: Verification with Real HETG Dataset | Next: Summary |