Verification with Real HETG Dataset
| Introduction |
| LSF Reference Data |
| Building LSFPARMS |
| Caveats |
| Validation |
| Summary |
| Other Links |
| isis |
| mit/cxc |
| ciao |
| caldb |
Verification: Capella HETG/ACIS-S (ObsID: 1103) dataset
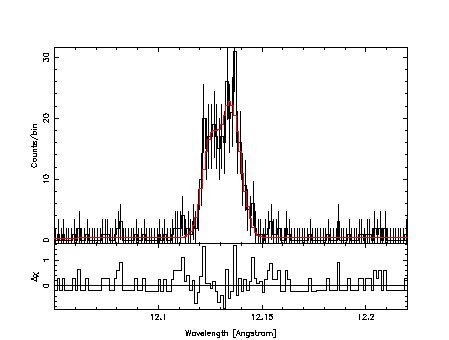
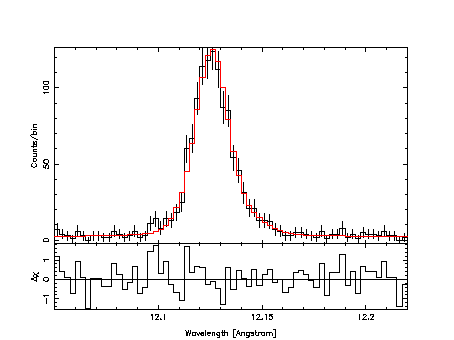
Finally we verify the validity of the LSF library with the real science dataset. In this example we use a 43 ksec Calibration/GTO observation of Capella (ObsID 1103) taken with Chandra HETG/ACIS-S.Similar to the earlier validation, we use isis to perform line profile fitting (using a delta function) here. Since the Capella spectrum exhibits a weak continuum, we add a 1st order polynomial function to adjust the baseline.
Since the plots themselves speak a thousand word, please look at the fitting results shown in the following figures.
Line Profile Fitting:
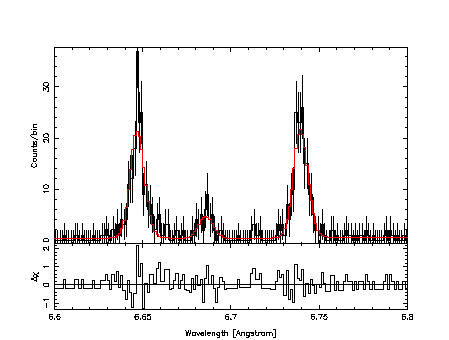
Fe XVII 
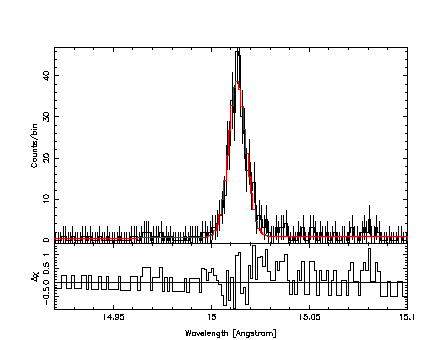
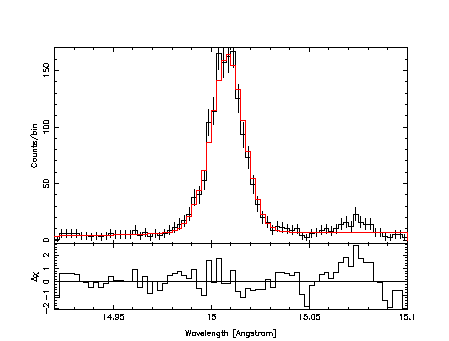
 is also displayed for your entertainment: (top) HEG; (bottom) MEG.
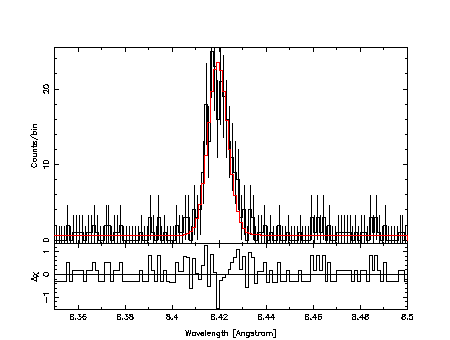
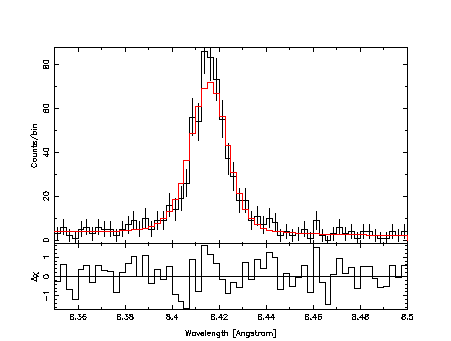
Mg XII 
Si XIII Triplet 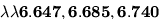
Fe XVII + Ne X Blend 
These results of line fitting are quite representative of line profile analyses we have performed on other lines in the same dataset. A couple of spot checks on flux estimate also show that the measured fluxes do not depend on a full width that is used to extract line spectra here.
This demonstrates that the new LSF library is valid for extensive spectroscopic analysis.
| Previous: Validation: Wavelength | Next: MARX vs. ChaRT |