Chandra/HRC-I Quantum Efficiency vN0012
Vinay Kashyap & Pete Ratzlaff
We have updated the QE files for the HRC-I, following on from the 2018 version (v11) which introduced a time-dependence into the HRC-I QE.
In this version, we extend the time dependence to include the latest epoch of observation.
During recent calibration observations, a steady decline has been seen in the observed count rates and estimated fluxes of the soft source whute dwarf system HZ43 (Figure 1) and the hard source SNR G21.5-00.9 (Figure 2).
We continue to tie the HRC-I low energy (E<626 eV) QE to the shape of the HRC-S QE (in this case v14), while being normalized to match the zeroth-order aimpoint count rates of HZ43.
The HZ43 rates are loess-smoothed with a 2nd-degree polynomial over ±5 nearest observations, in order to avoid overfitting the QE corrections to the measured rates.
This implies a retroactive change even at older epochs of ~0.5%, while newly predicted rates match the observed rates with an rms of 1% (Figure 3).
Additionally, we also impose a grey decline of 1.5% percent/year in the QE post-2016 before applying the HRC-S shape correction in order to account for the QE drop visible at high energies. This has the effect of correcting the drop in flux for G21.5-00.9 (Figure 4).
The update (Figure 5) applies to all previous epochs, and as before, QE files are provided for each epoch when a HZ 43 calibration observation is made.
Figure 1: Comparing observed and predicted HZ43 count rates prior to QE correction.
Upper panel: Absolute count rates as measured during each observation (red x) and statistical 1-sigma error bars on them (vertical bars), along with the count rate predicted by QE v11 (diamonds). The loess-smoothed curve used as the target for QE correction is also shown (cyan curve).
Lower panel: As the upper panel, but normalized by the measured counts averaged between 2002 and 2010 (green solid horizontal line; 1-sigma errors on the average are shown as green dashed horizontal lines). Note that the predicted QE shows a deficit of >10% in 2020. | 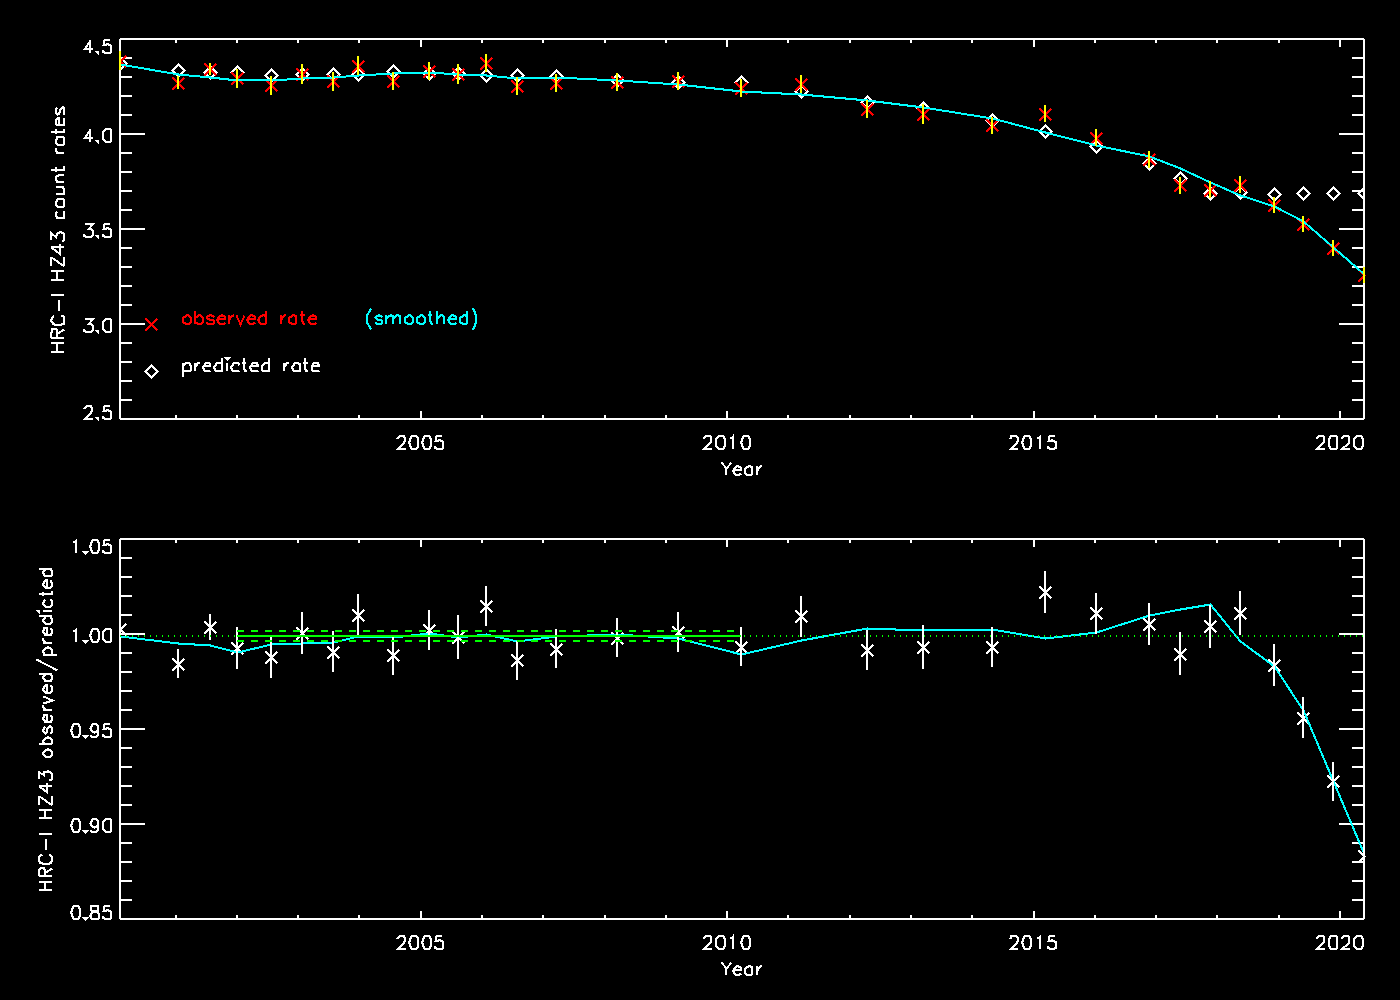 |
Figure 2: Measured Count rates and estimated fluxes of G21.5-00.9.
Upper panel: Count rates relative to the measurement in 2008, for the shell (blue curve with 1-sigma error bars) and the plerion (red curve with 1-sigma error bars). The most recent observations show a trend of decreasing count rates.
Lower panel: Estimated flux assuming an absorbed power-law spectrum, calculated using QE v11. Since the QE does not incorporate a temporal change at high-energy, the estimated flux also shows a decreasing trend, of approximately 1.5% per year. | 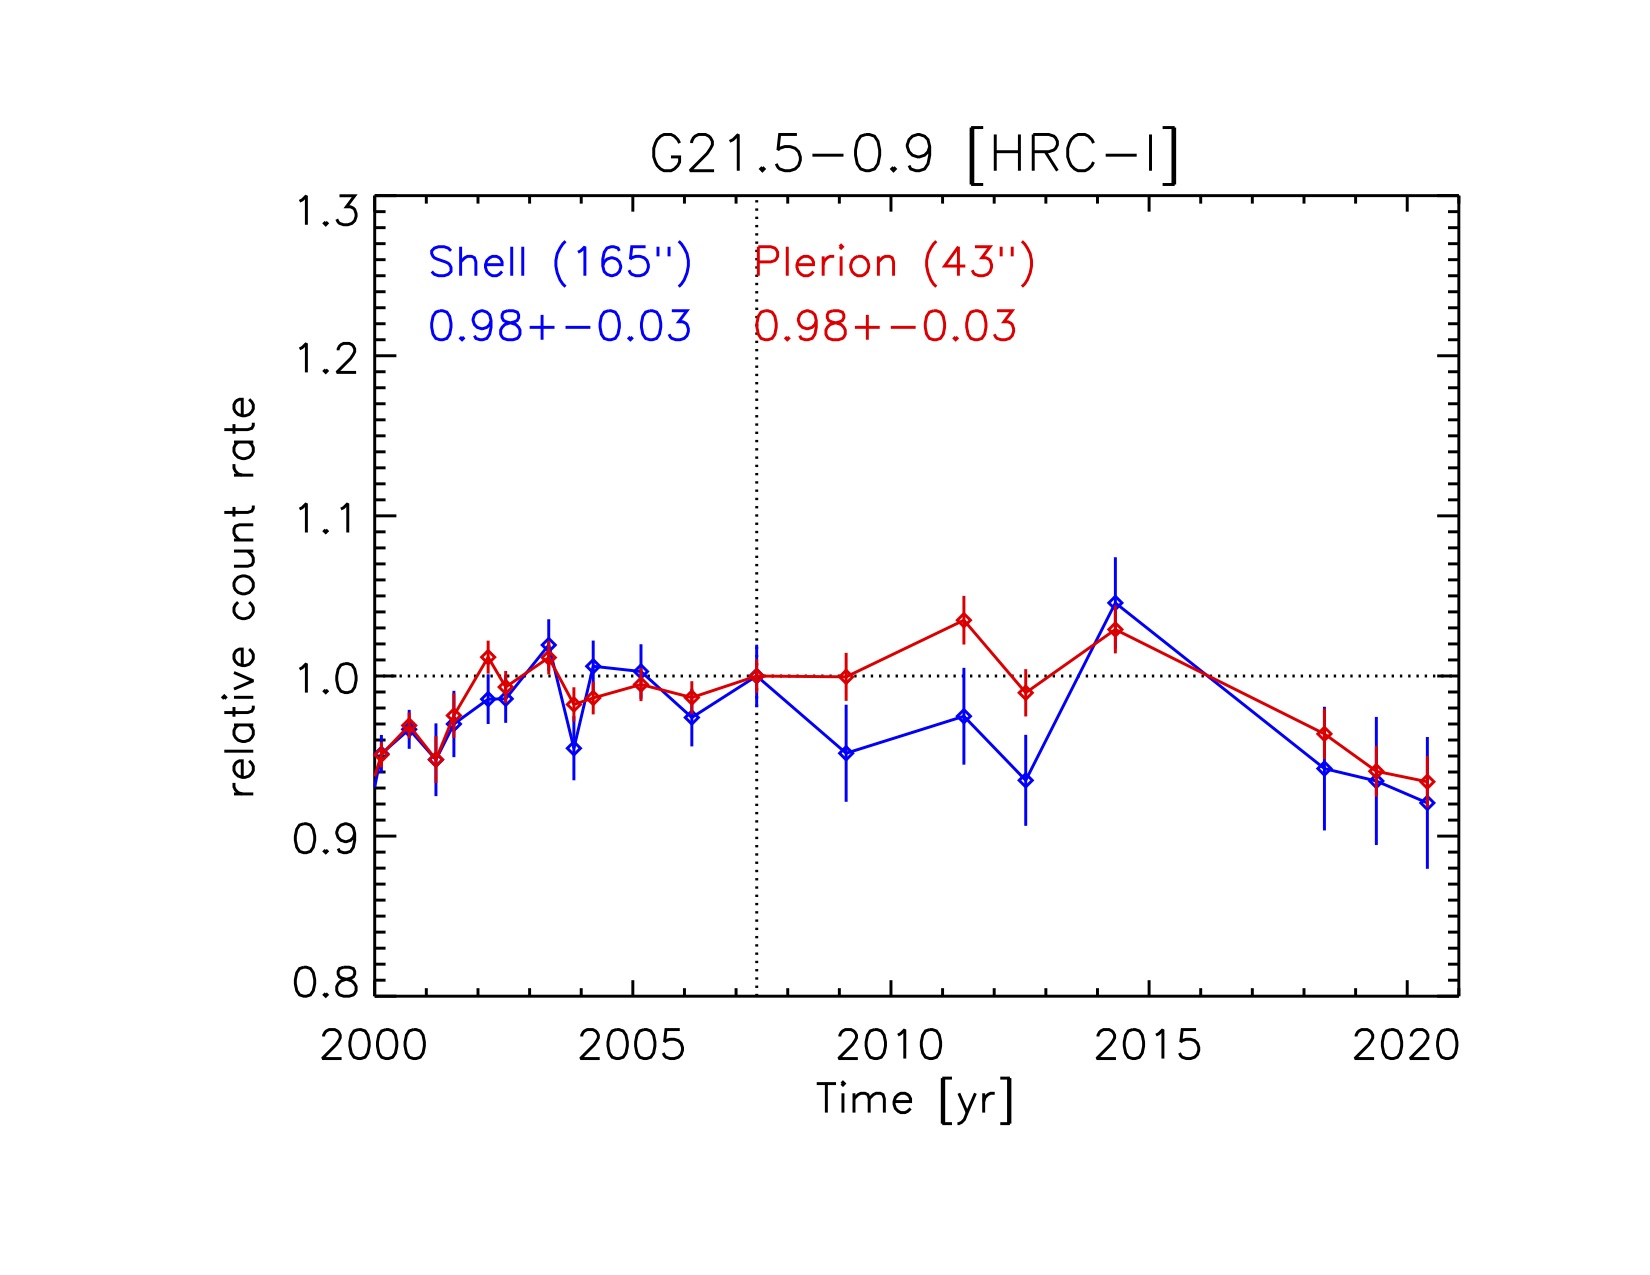
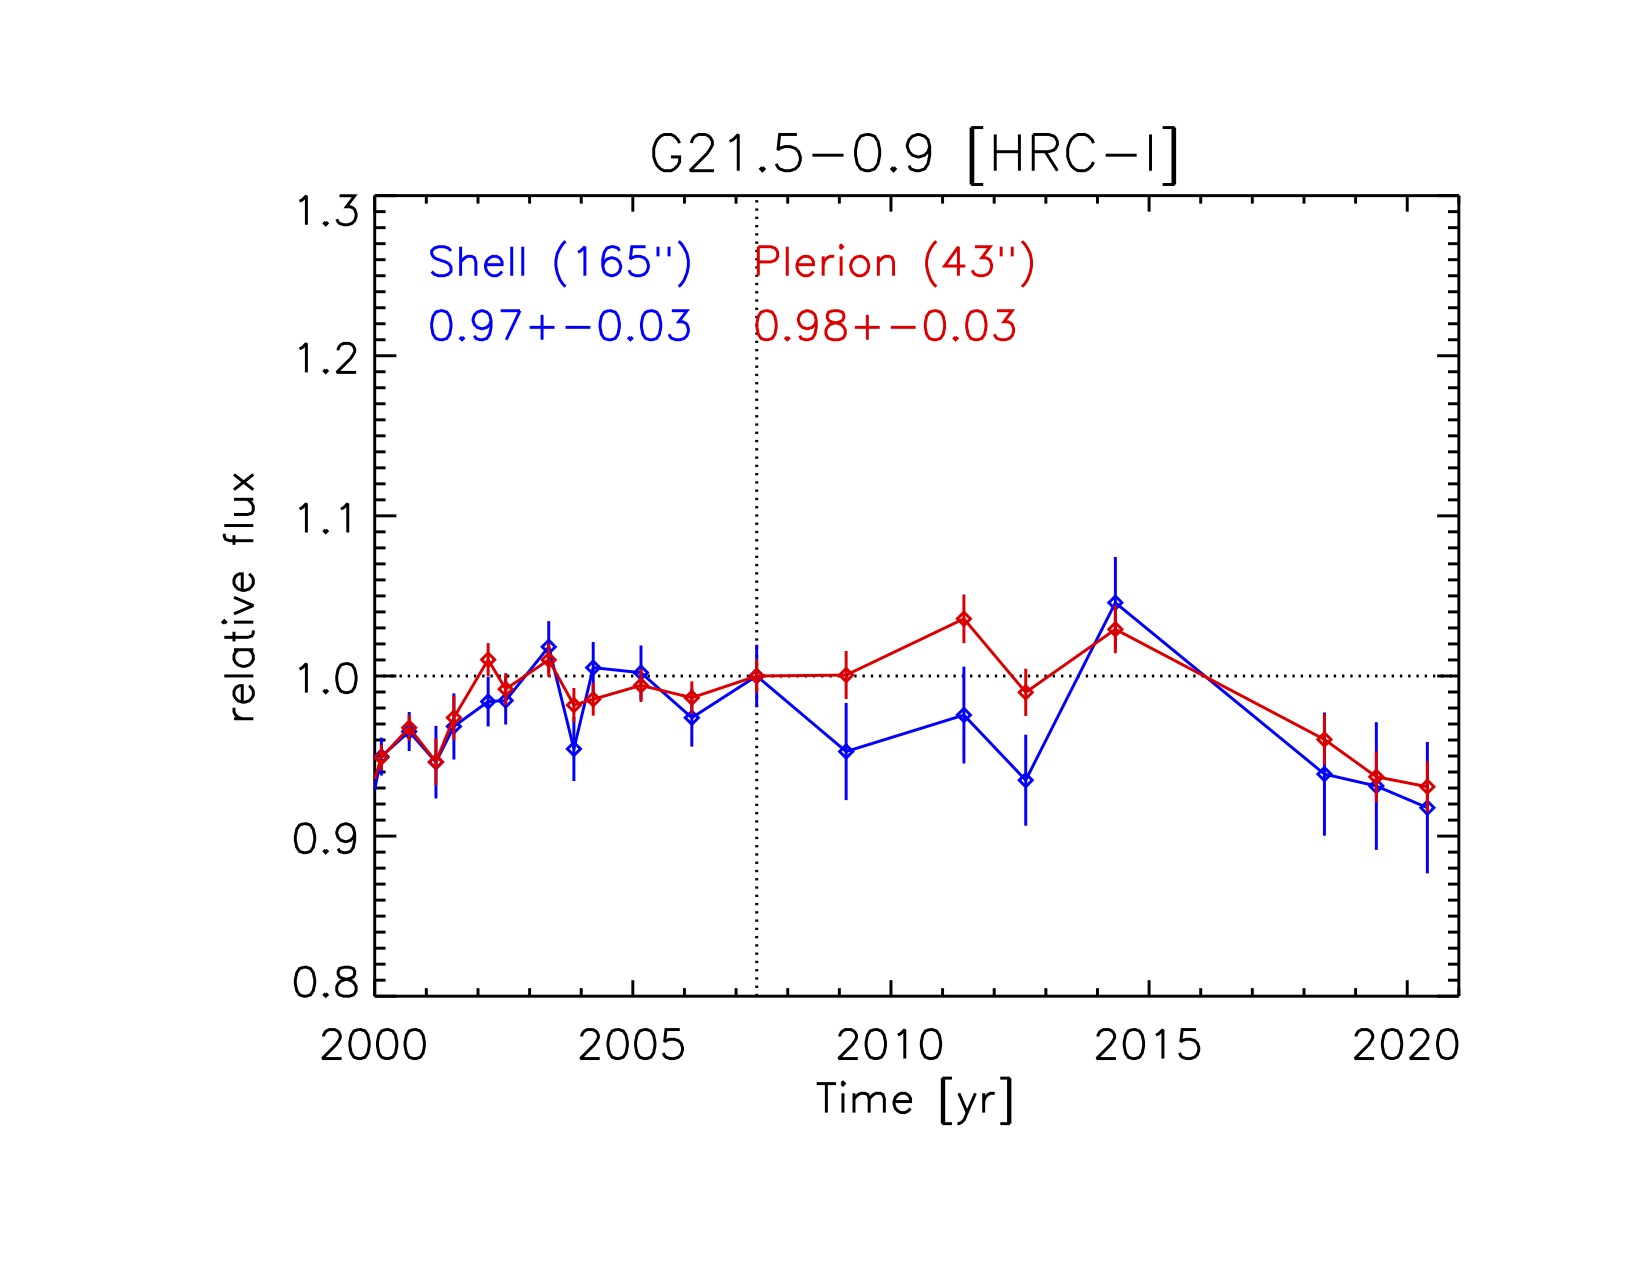
|
Figure 3: HZ43 count rates after QE correction.
Upper panel: As in Figure 1 (top), shows the measured count rate (magenta x's, with 1-sigma error bars), the loess-smoothed target (cyan curve), and the count rates predicted using QE v12 (diamonds).
Lower panel: The ratio of the observed count rate to the predicted rate. The horizontal cyan line indicates unity. The caption indicates both the statistical (average of the 1-sigma errors) and the systematic (1-sigma scatter in the residuals). | 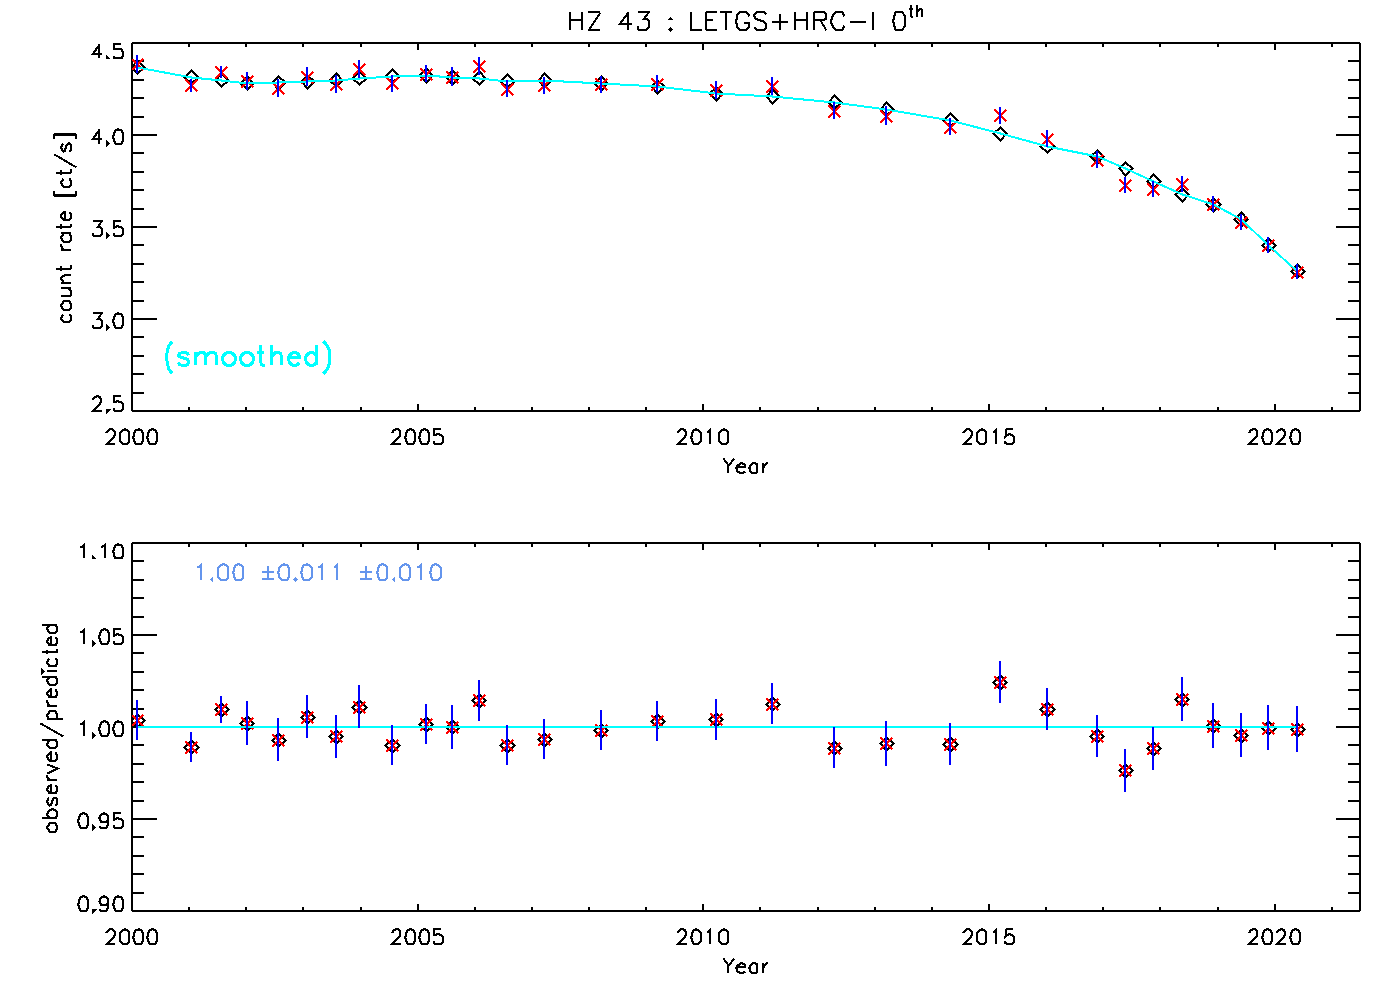 |
| Figure 4: G21.5 fluxes after HRC-I QE correction. The upper panel shows the estimated fluxes for the plerion observed with the HRC-S as calculated using QE versions 14 (blue) and 15 (orange). The lower panel shows the plerion fluxes estimated for HRC-I observations using QE versions 11 (blue) and 12 (orange). Note that the HRC-I QE v12 succeeds in correcting the flux decline, though there is an as yet unresolved difference in the estimated fluxes between the HRC-S and the HRC-I. | 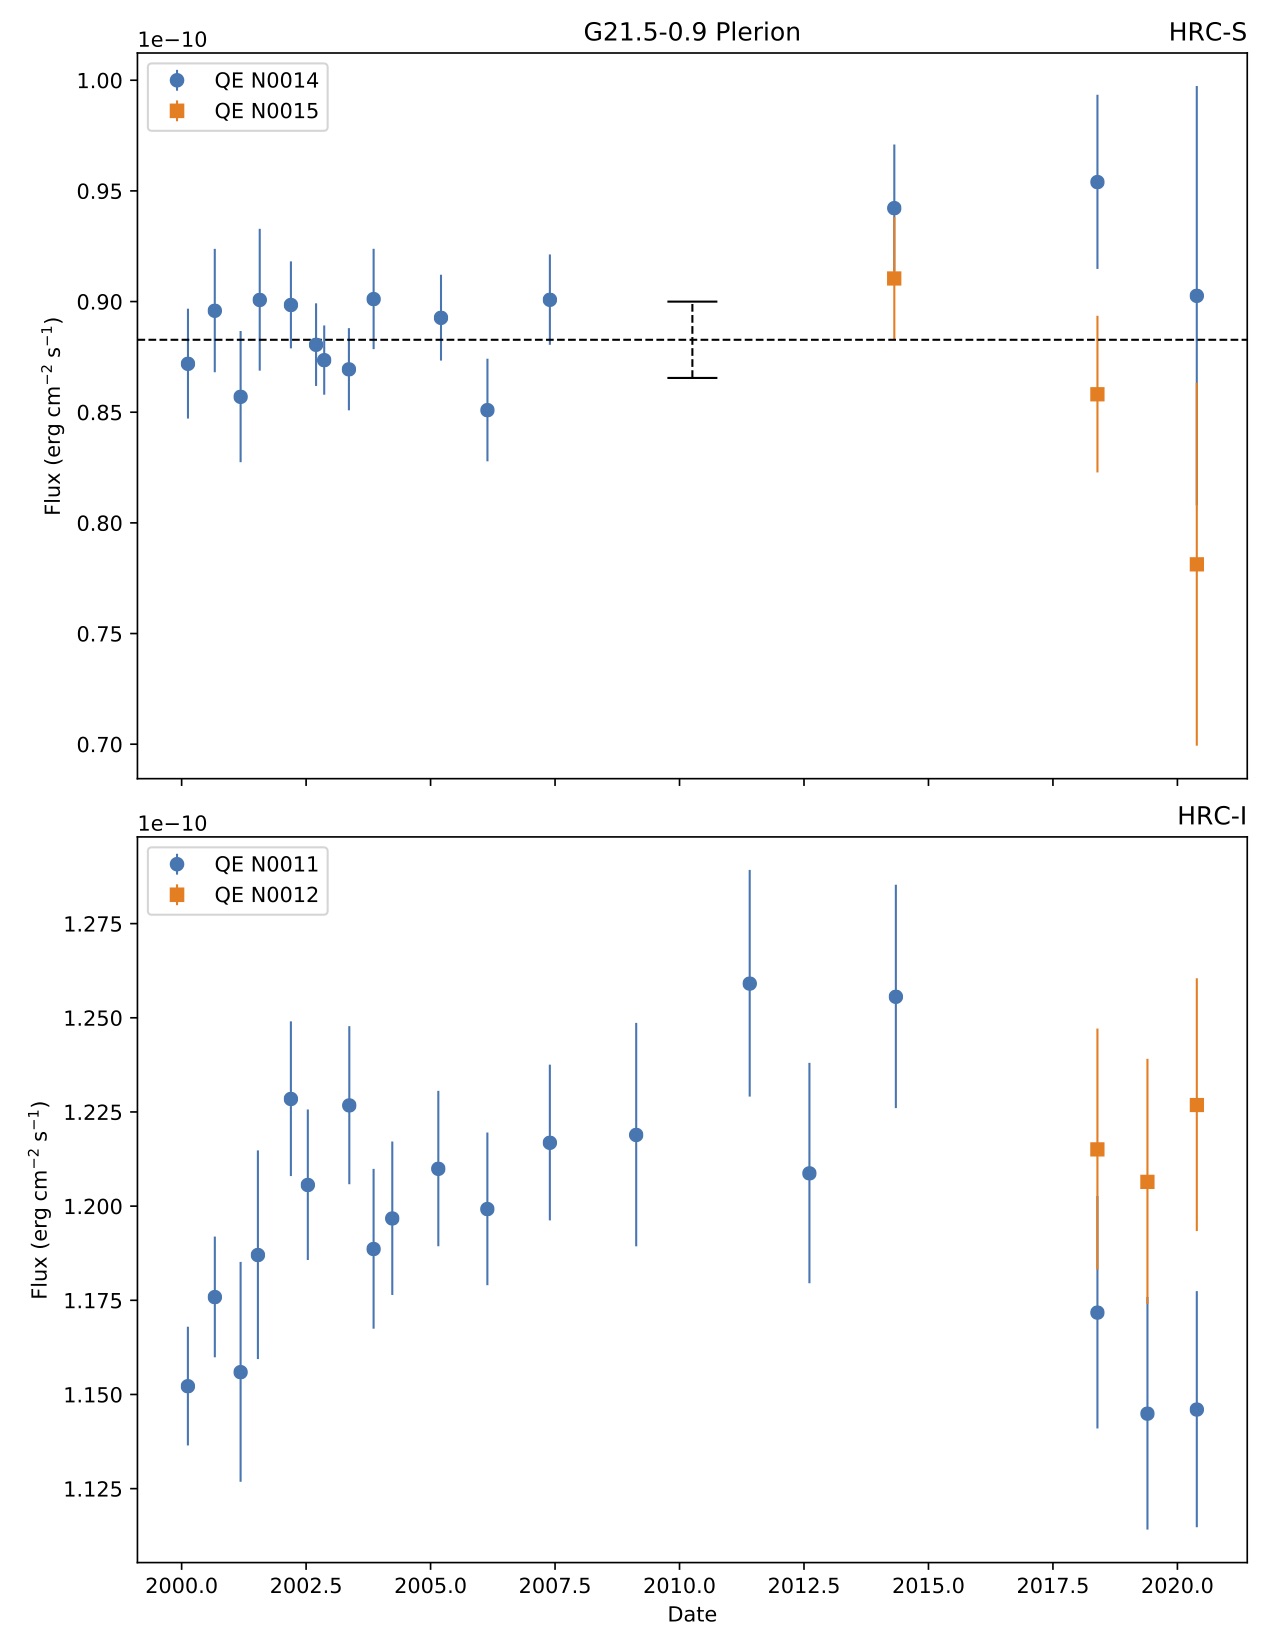 |
Figure 5: Magnitude of HRC-I QE corrections.
Upper panel: Plots showing the QE curves adopted for each epoch.
Lower panel: The corrections applied relative to epoch 2000-Feb. The colors change from blue to red, with bue being the oldest and red the newest. | 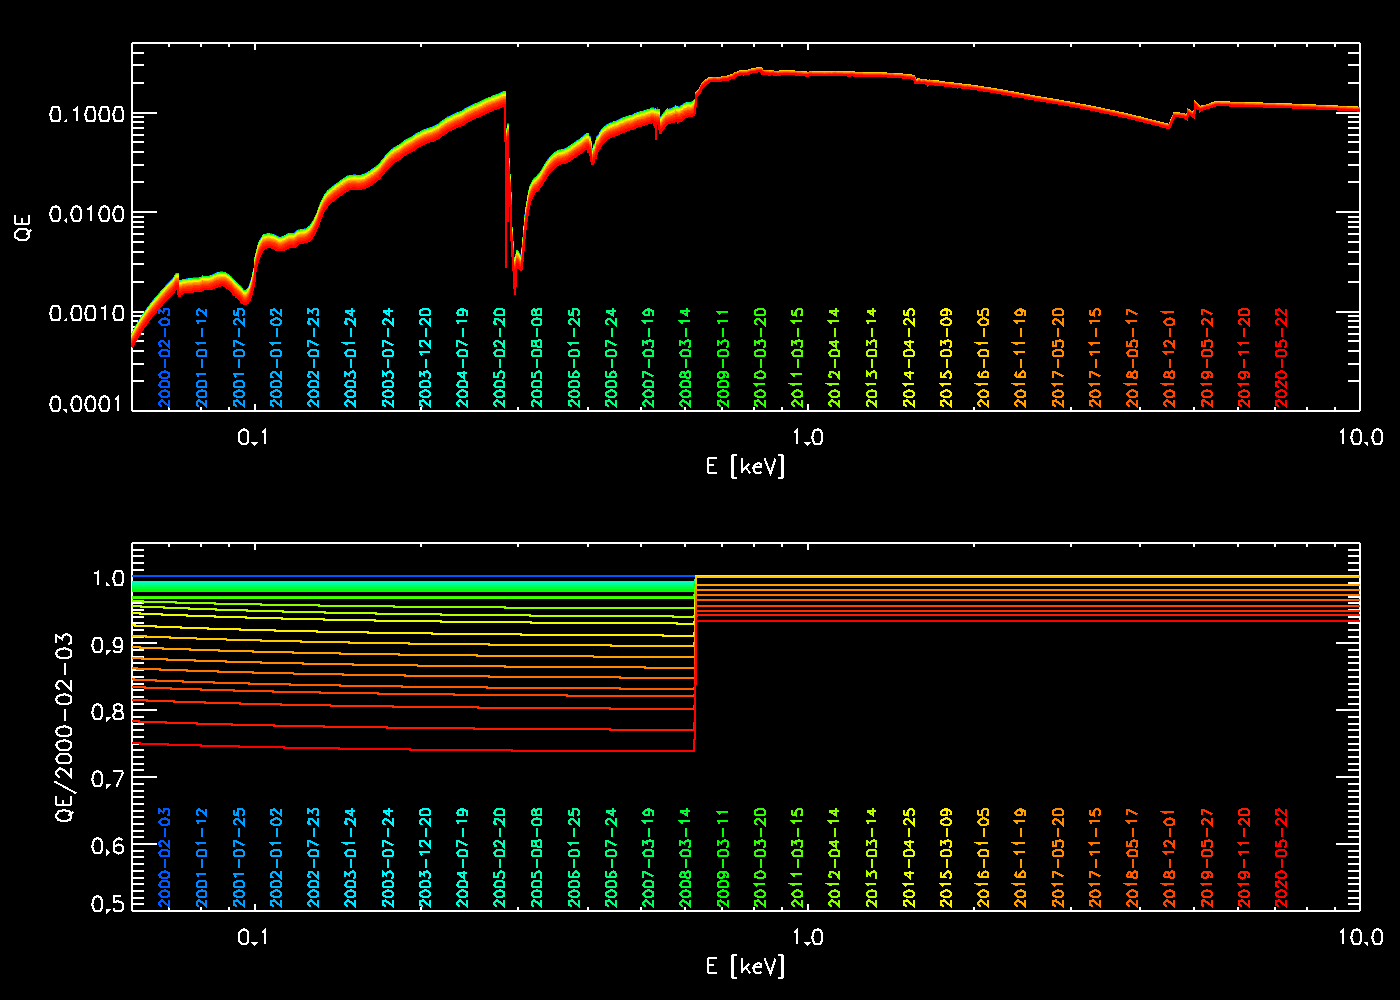 |
The new QEs will be available in CalDB v4.9.2 at $CALDB/data/chandra/hrc/qe/.
- hrciD1999-07-29qeN0012.fits
- hrciD2000-07-23qeN0012.fits
- hrciD2001-04-19qeN0012.fits
- hrciD2001-10-16qeN0012.fits
- hrciD2002-04-14qeN0012.fits
- hrciD2002-10-25qeN0012.fits
- hrciD2003-04-25qeN0012.fits
- hrciD2003-10-06qeN0012.fits
- hrciD2004-04-05qeN0012.fits
- hrciD2004-11-05qeN0012.fits
- hrciD2005-05-15qeN0012.fits
- hrciD2005-11-01qeN0012.fits
- hrciD2006-04-25qeN0012.fits
- hrciD2006-11-21qeN0012.fits
- hrciD2007-09-16qeN0012.fits
- hrciD2008-09-11qeN0012.fits
- hrciD2009-09-15qeN0012.fits
- hrciD2010-09-16qeN0012.fits
- hrciD2011-09-29qeN0012.fits
- hrciD2012-09-29qeN0012.fits
- hrciD2013-10-05qeN0012.fits
- hrciD2014-10-03qeN0012.fits
- hrciD2015-08-09qeN0012.fits
- hrciD2016-06-15qeN0012.fits
- hrciD2017-02-20qeN0012.fits
- hrciD2017-08-20qeN0012.fits
- hrciD2018-02-16qeN0012.fits
- hrciD2018-08-25qeN0012.fits
- hrciD2019-02-27qeN0012.fits
- hrciD2019-08-24qeN0012.fits
- hrciD2020-02-20qeN0012.fits
- 2020-jun-13: document.start()
- 2020-jun-16: circulated
Vinay Kashyap (CXC/CfA)