HRC-I Degap Lookup from Capella Data
Introduction
In an earlier memo, HRC-I Degap Lookup
Table, I described a method of deriving an improved set of
degapping corrections using on-orbit observations of near-on-axis,
point sources. The calibration program for cycle 7 included a set
of twenty observations of Capella, performed at varying SIM
translation offsets, to provide an initial portion of the data
that can be used to derive updated degapping corrections. This
memo describes the steps used in deriving the candidate CALDB
update. The candidate is available here:
hrci_degaplookup_candidate.fits.
Reduction Steps
The degapping corrections were derived from the combined data from the
twenty Capella observations. For each of the individual
observations the source events were extracted from the event list
using an 8-pixel-radius circle centered on the source, where the
center was determined by iteratively-clipped centroiding starting
from a 20-pixel-radius centered on Capella's RA and Dec. Using the
extracted source events and aspect solution from each observation
and the fits to the location of the nominal telescope aim-point in
the CHIP coordinate system as the SIM is translated (from the memo
HRC-I Rotation Angle), the modeled
detector position of Capella in HRC-I U and V for each source
event time was calculated. Modeled position uncertainties were
calculated using the uncertainties from the aspect solution and from
the fits of the aim-point CHIP position as a function of SIM
translation.
For each axis the events were binned according to coarse position
(CRSU or CRSV), amplifier scale (AMP_SF), and modeled source
position and the mean raw event position (RAWX or RAWY) for the
modeled source position and uncertainty calculated as well as
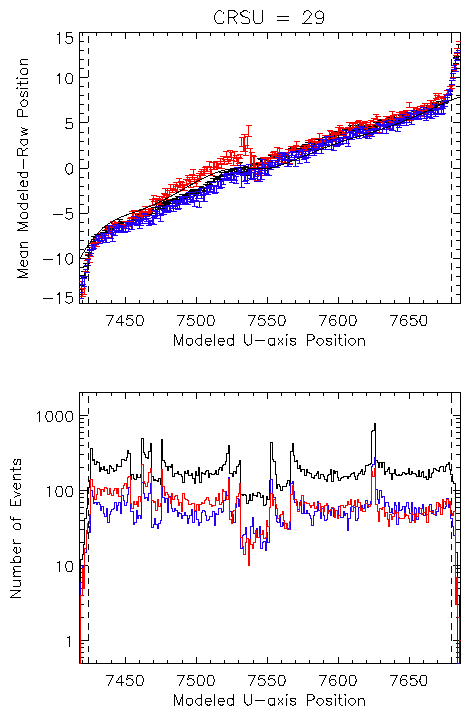
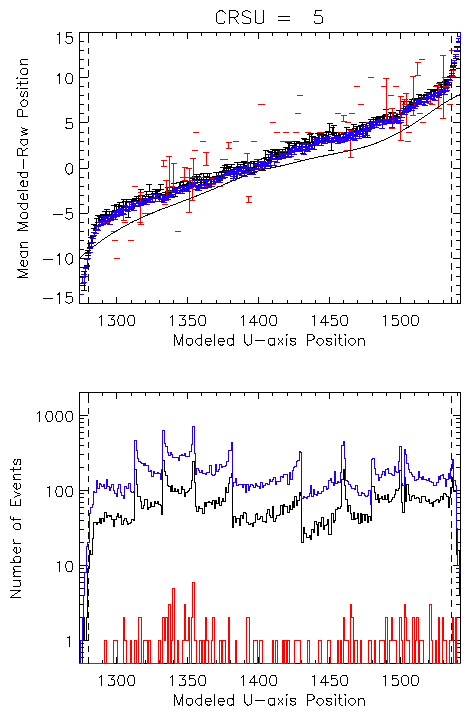
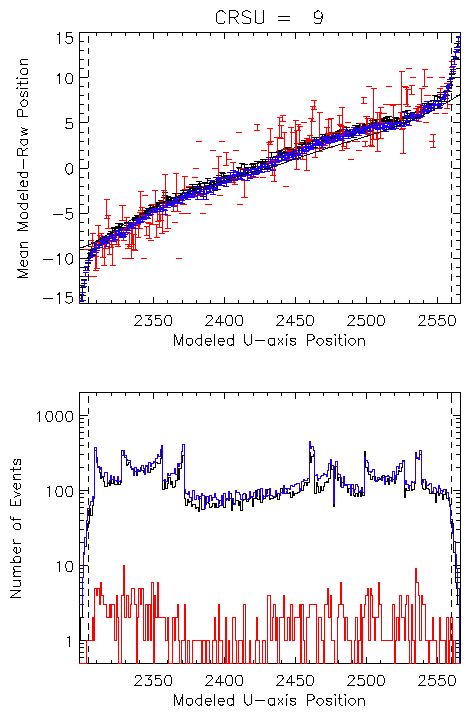
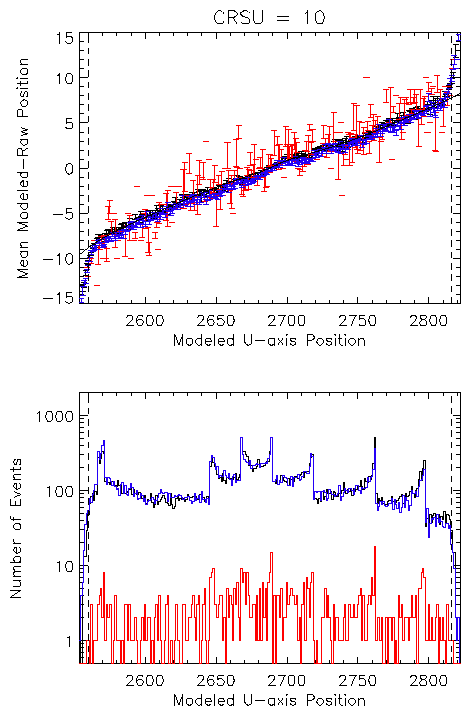
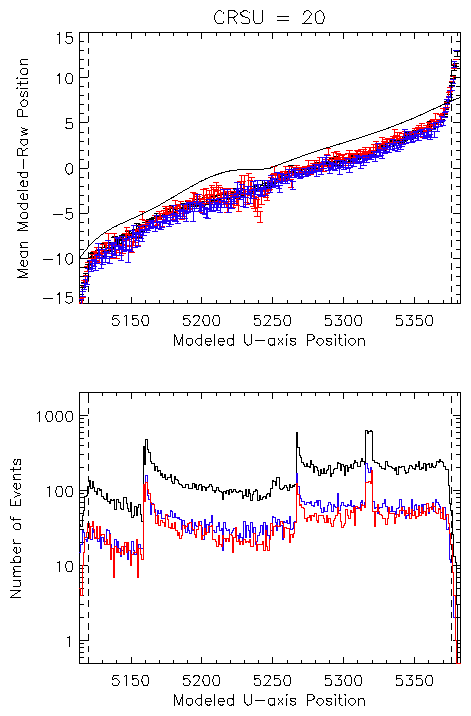
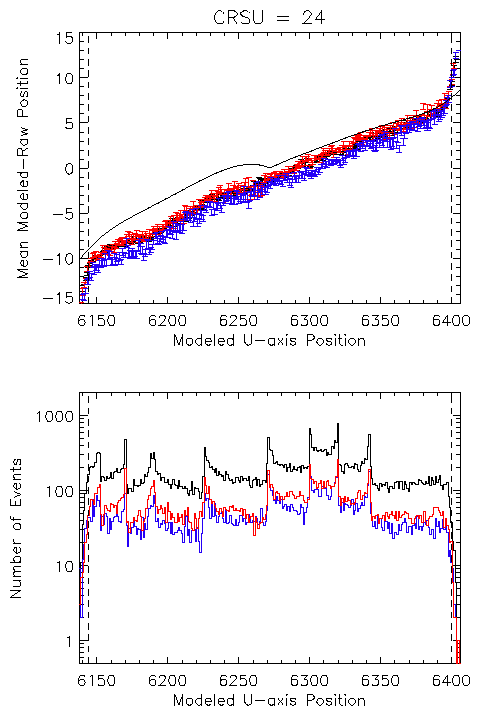
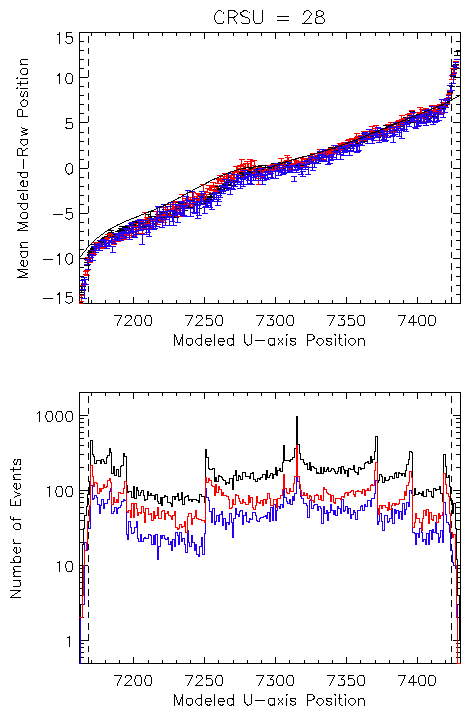
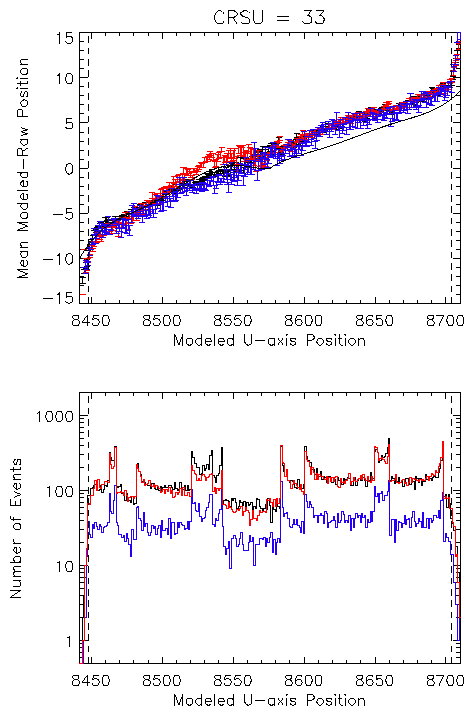
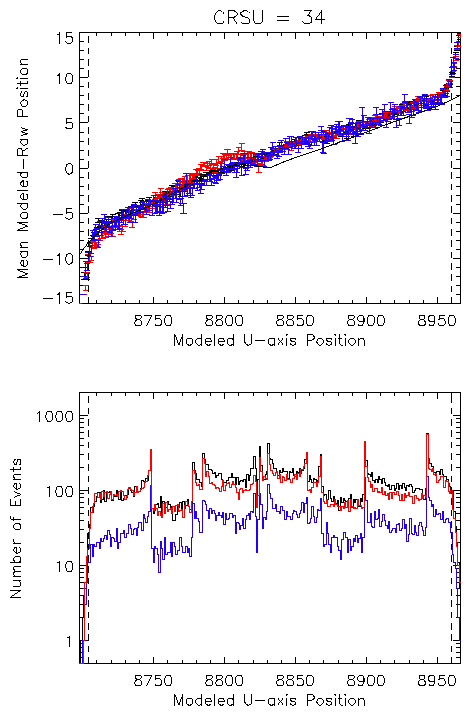
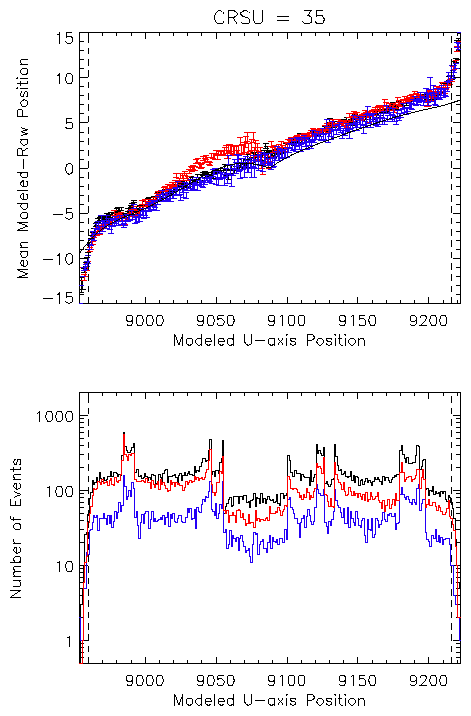
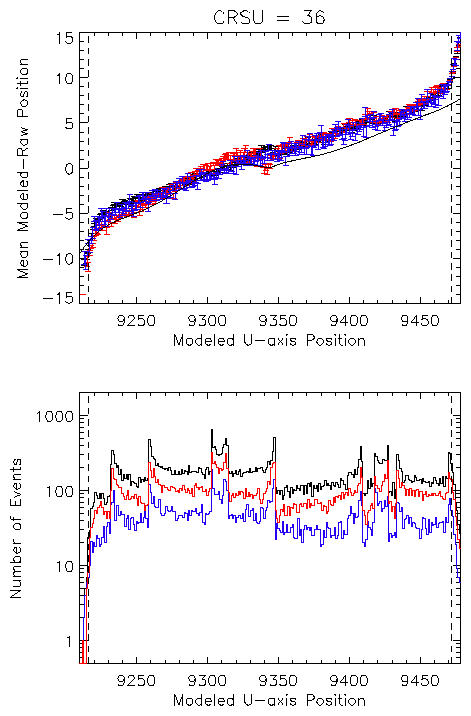
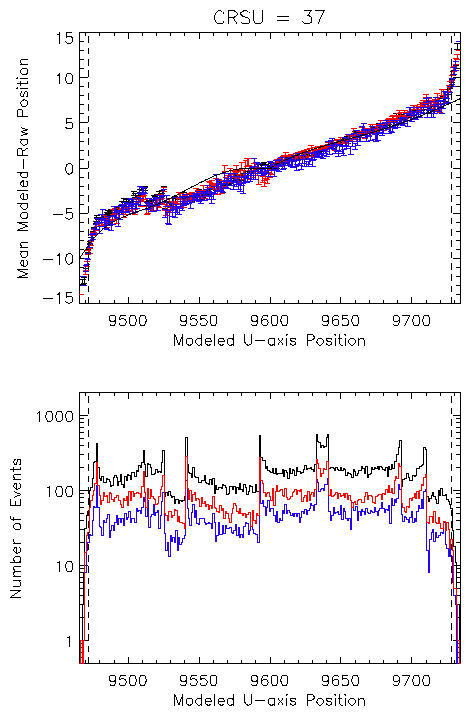
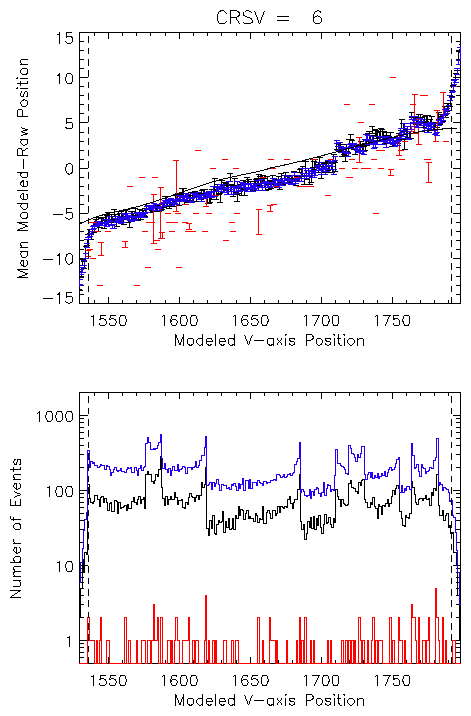
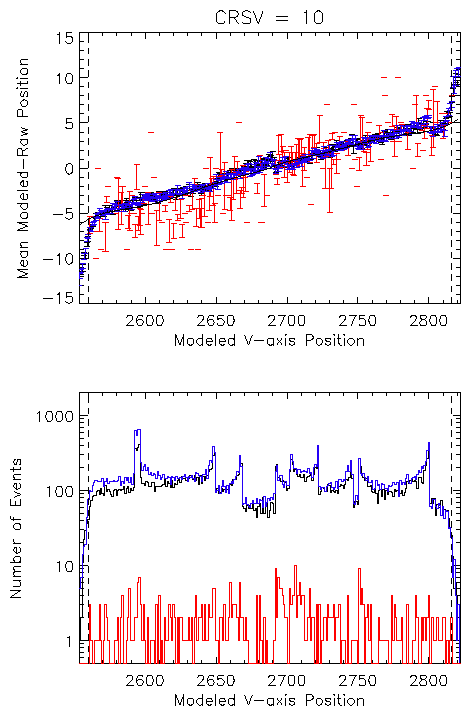
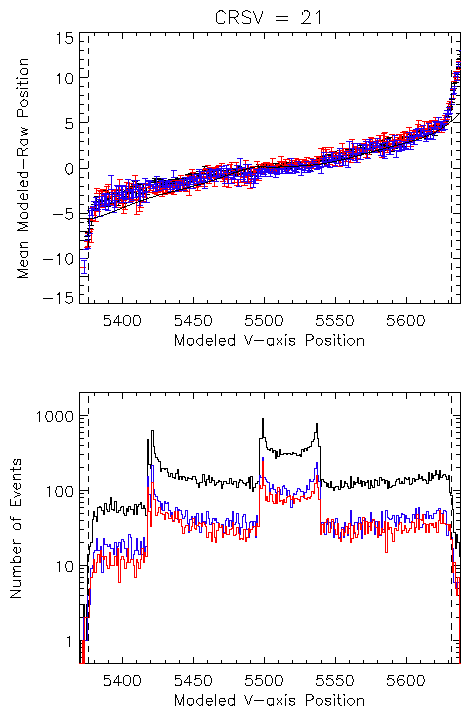
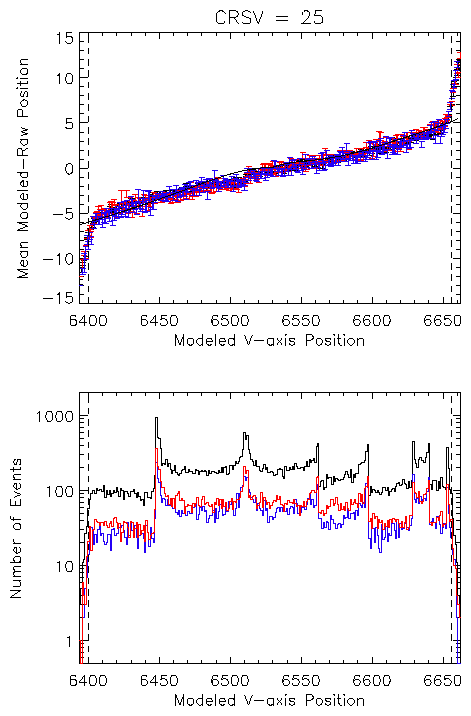
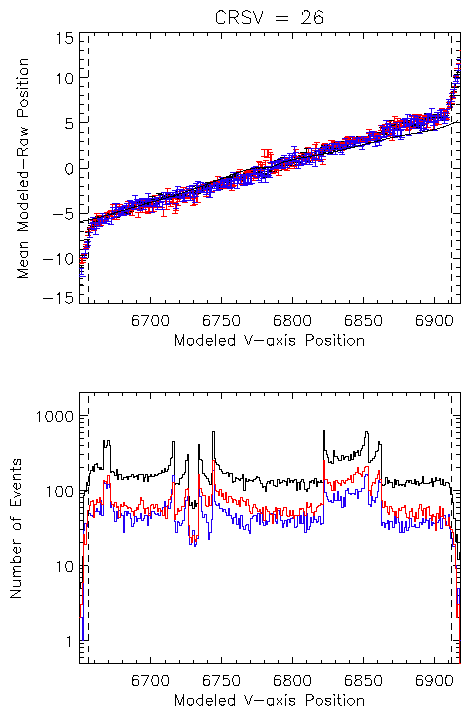
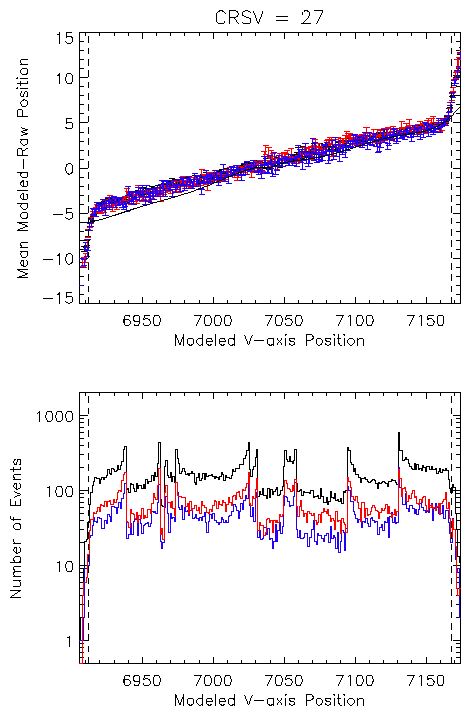
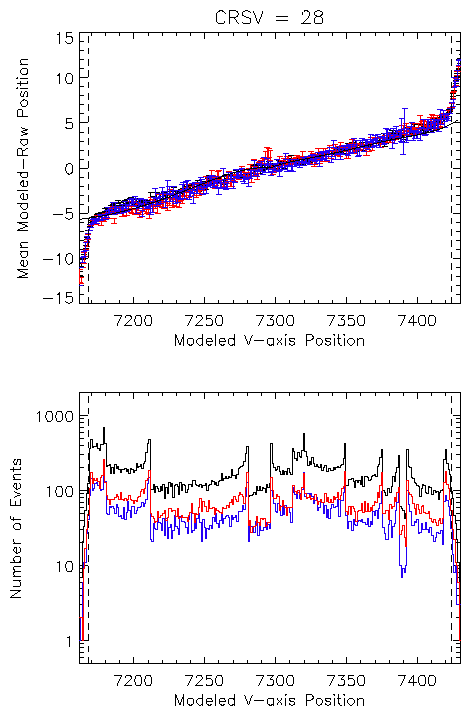
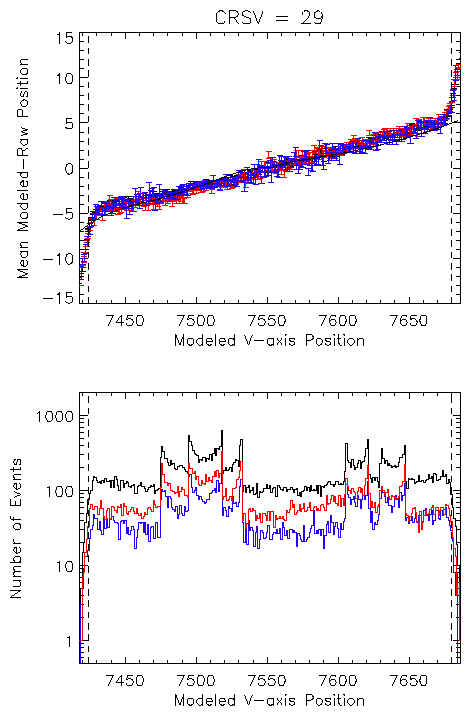
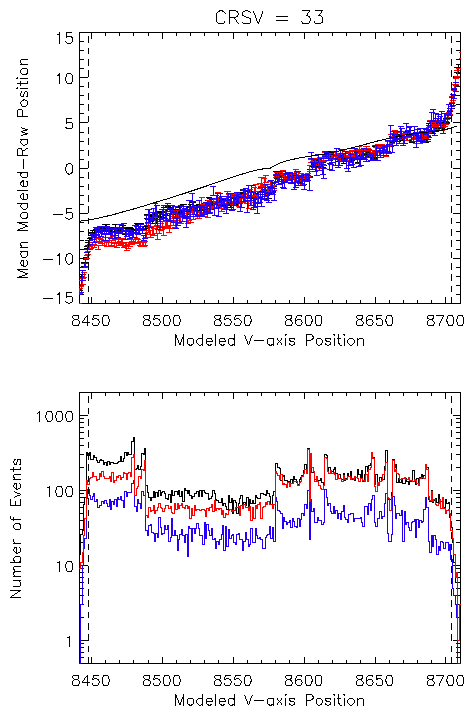
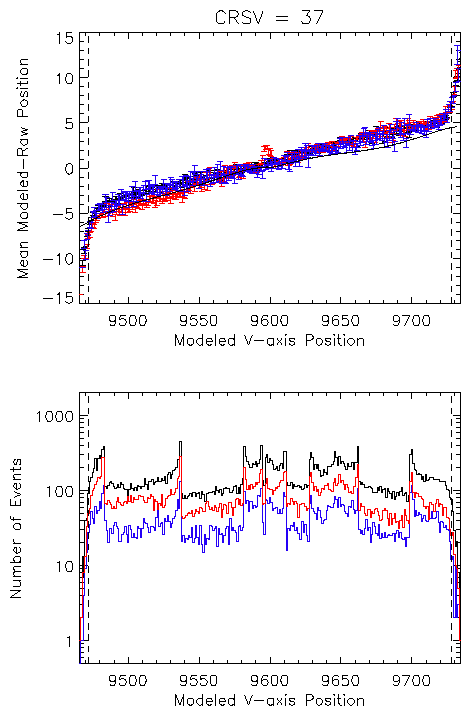
the mean deviation and its uncertainty. Figure 1 shows the
result for one the U-axis coarse positions. The upper panel
shows the deviation of the modeled position from the modeled
position while the lower panel shows the number of events that
were used in the determination at each modeled position. Data
from the different amplifier scales are plotted in different
colors (AMP_SF = 1 - blue, 2 - black, 3 - red).
|
Figure 1 Upper: Mean of the differences between the
modeled source location on the detector along the
U-axis, derived from the aspect solution, and the
reported RAWX value. Only events that were reported as
centered on U-axis tap number 29 are included. Different
colors are used to distinguish the values calculated
from data with different amplifier scale factors (AMP_SF
= 1 - blue, 2 - black, 3 - red). Vertical dashed lines
indicate the nominal pixel range covered by the coarse
position. The solid black curve is the difference
implied by the degapping corrections in the CALDB file
hrciD1999-07-22gaplookupN0001.fits.
Lower: Number of events at the modeled source location used in
determining the mean differences plotted above. Data set
colors are the same as in the upper panel.
|
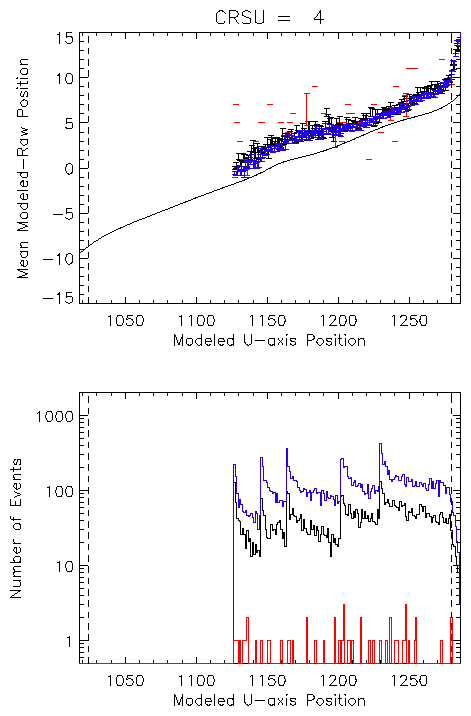
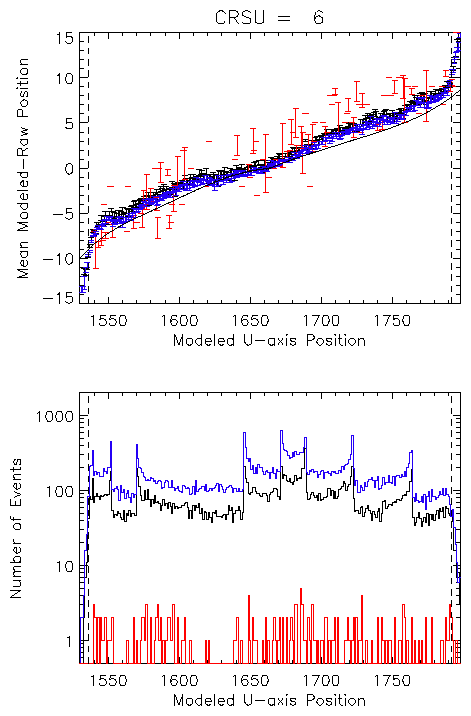
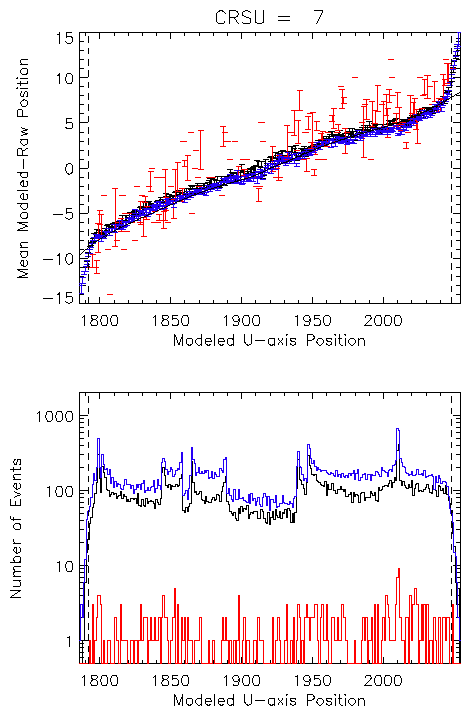
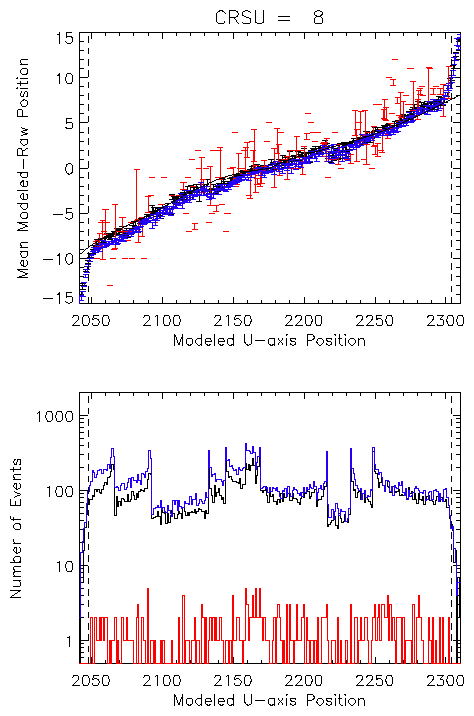
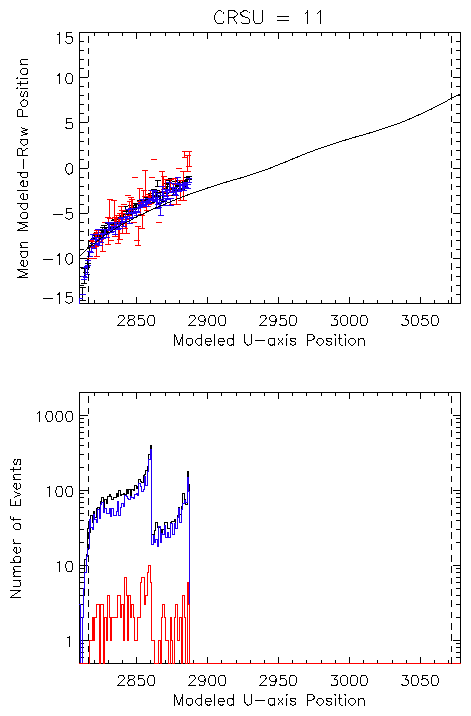
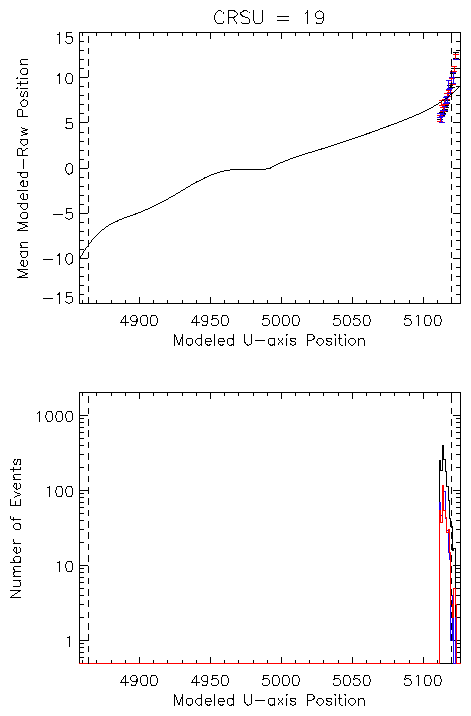
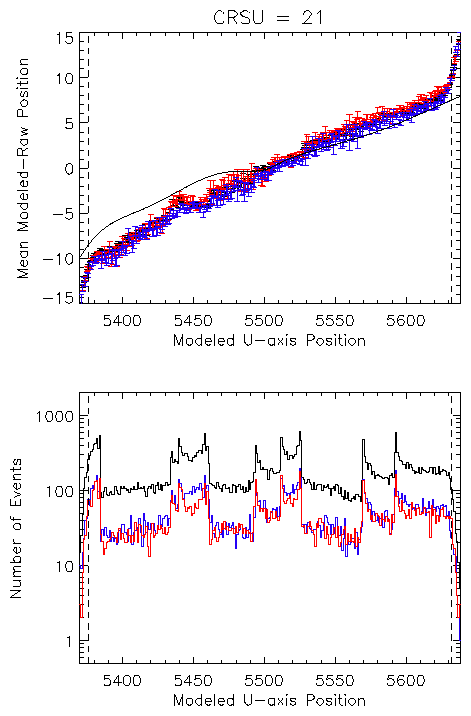
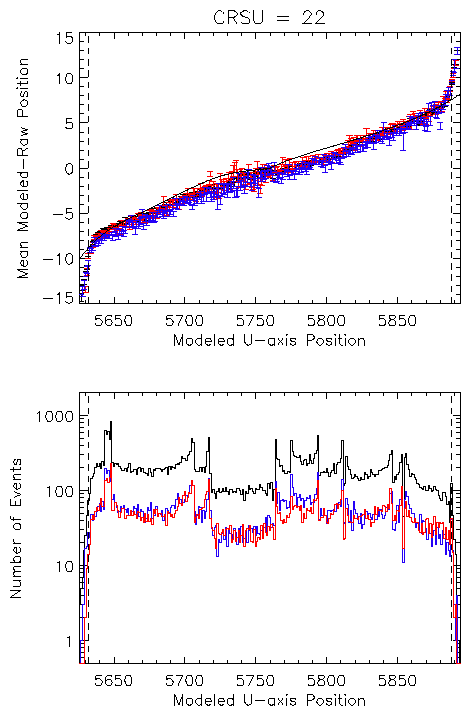
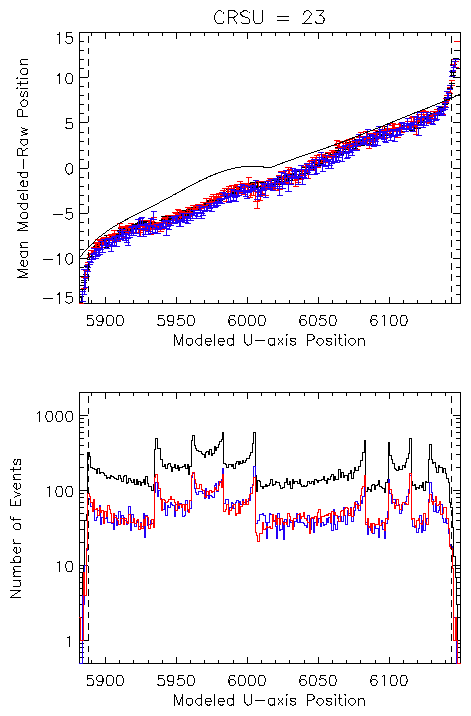
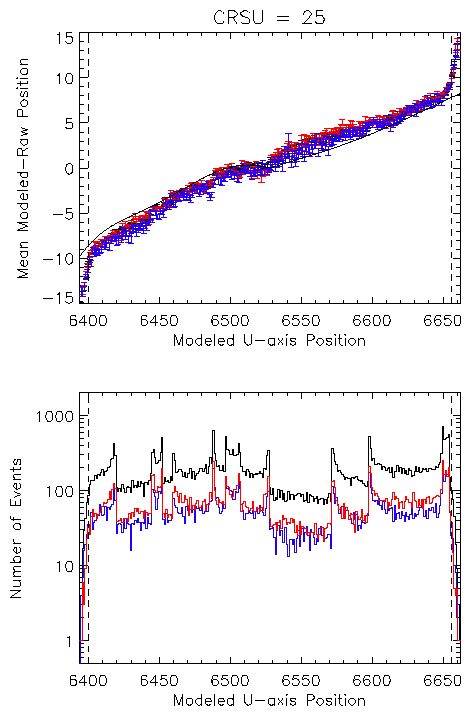
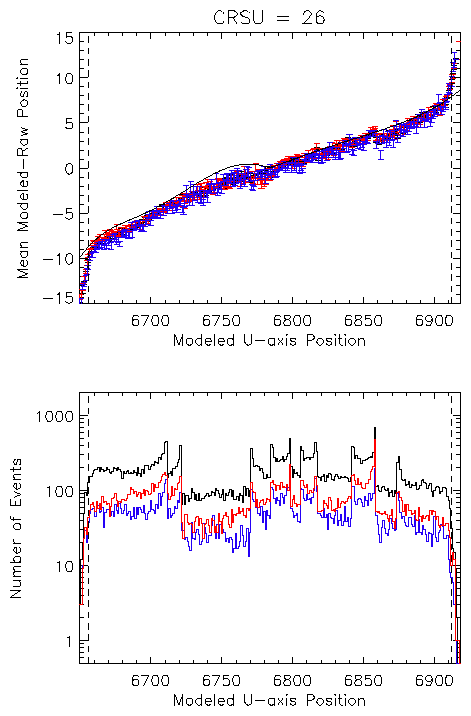
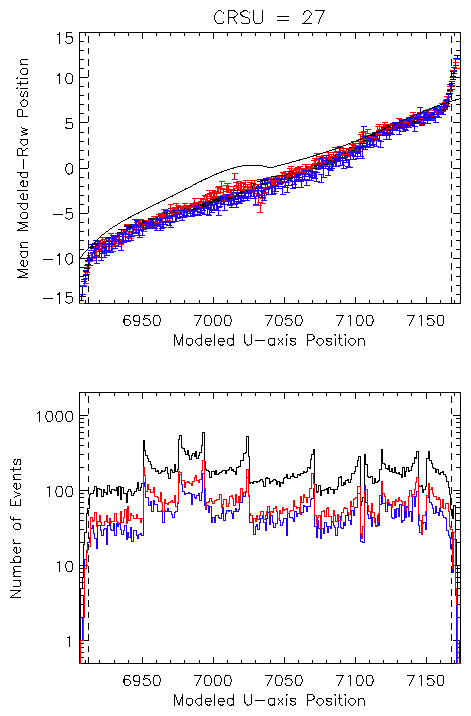
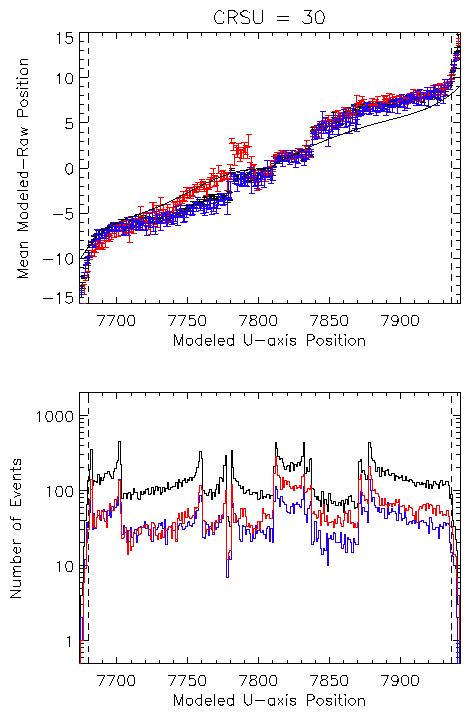
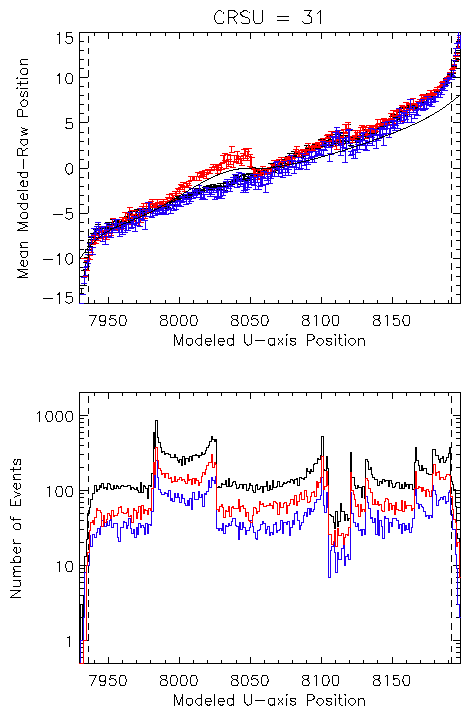
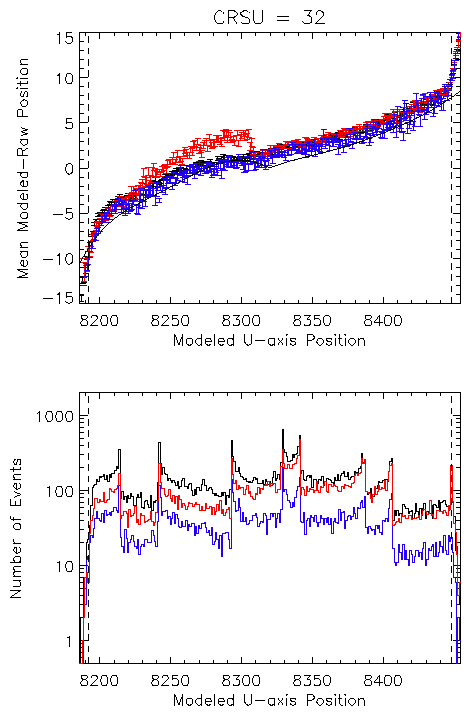
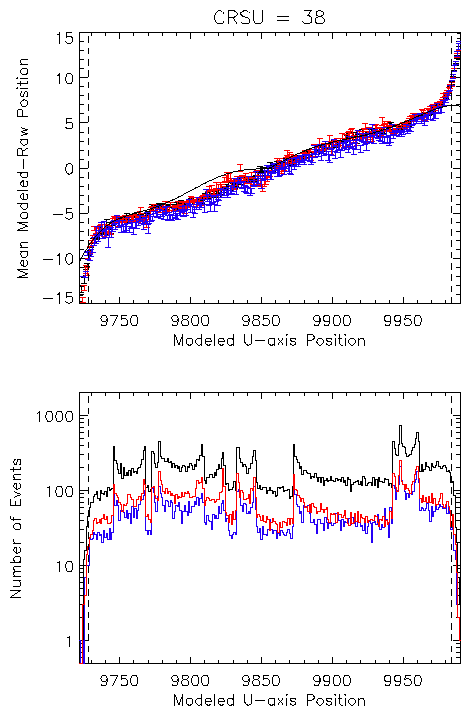
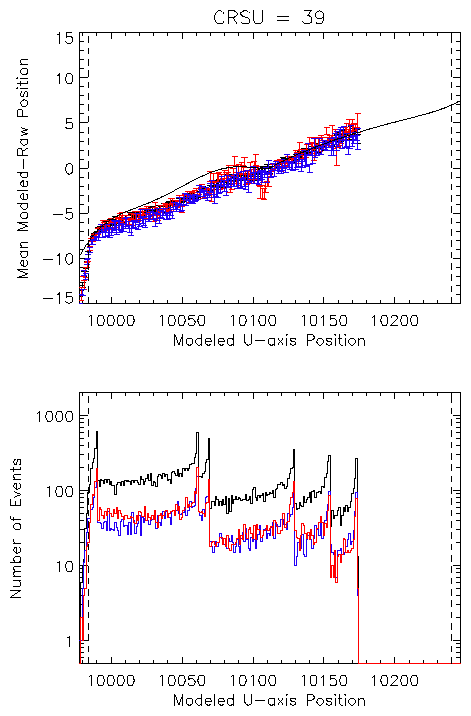
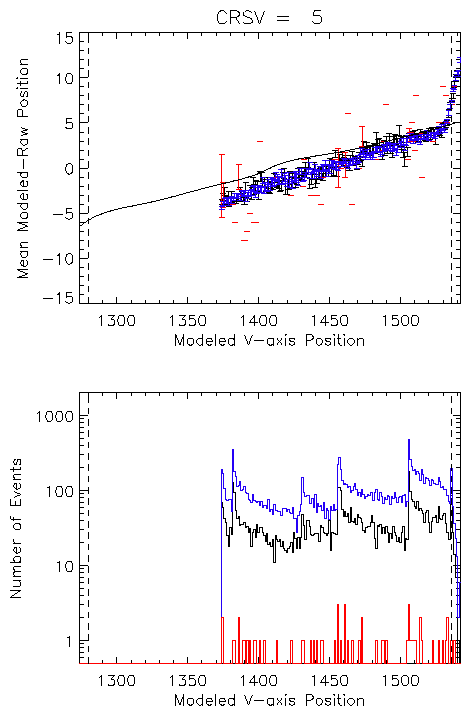
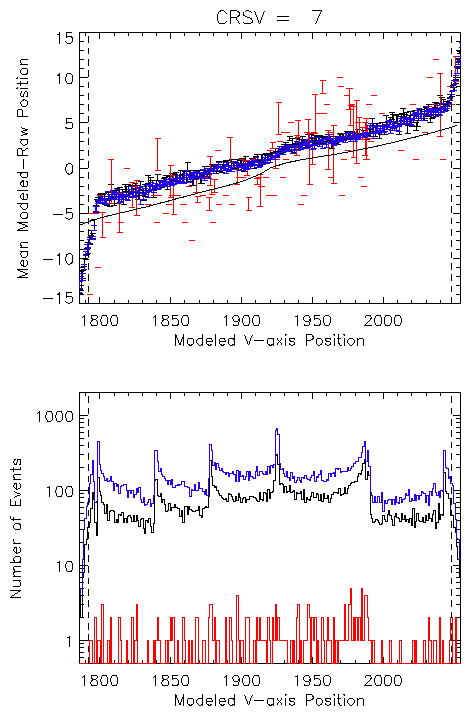
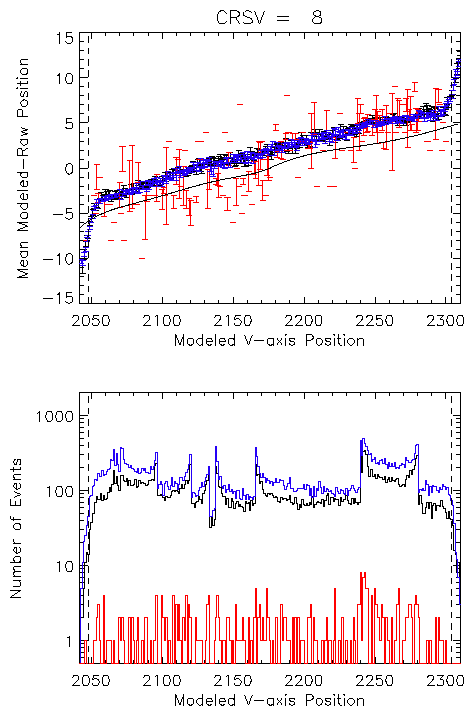
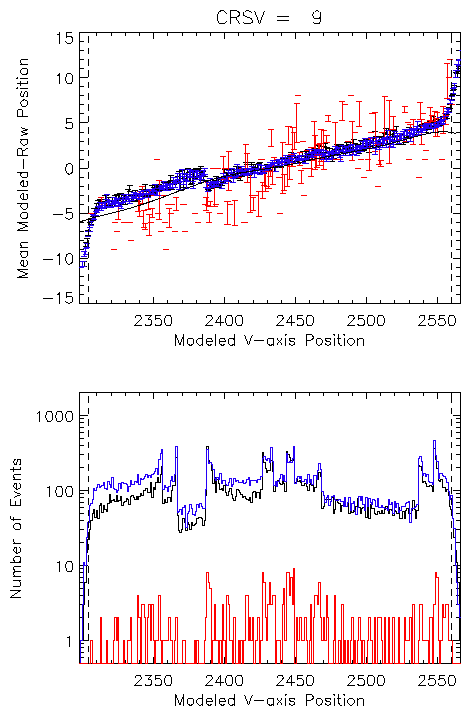
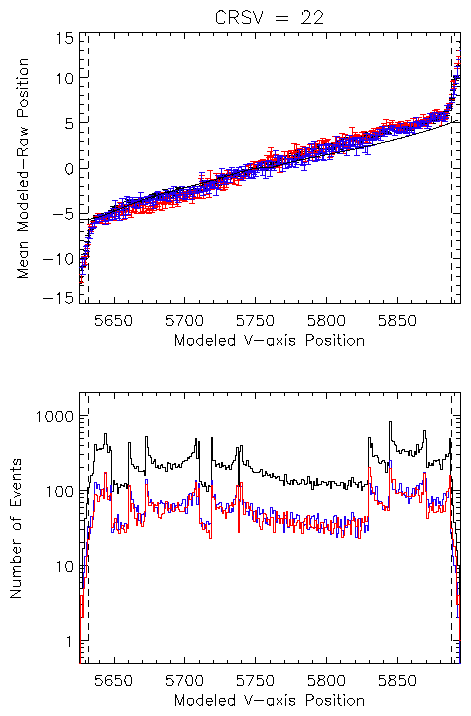
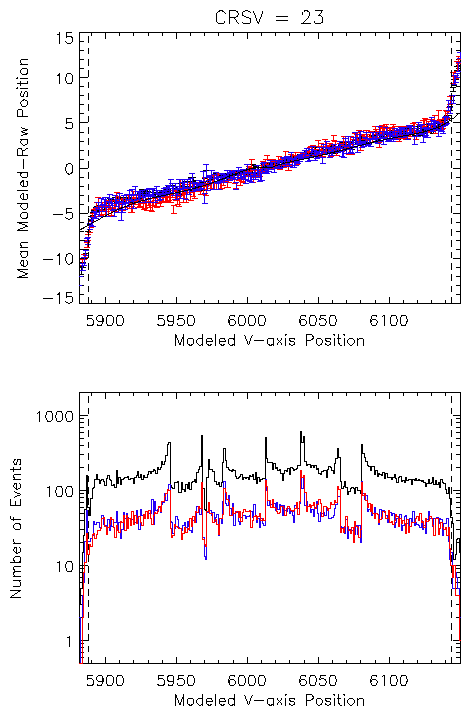
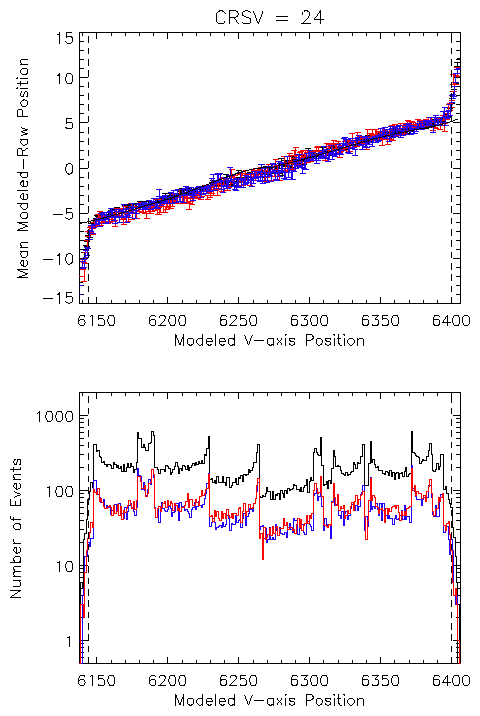
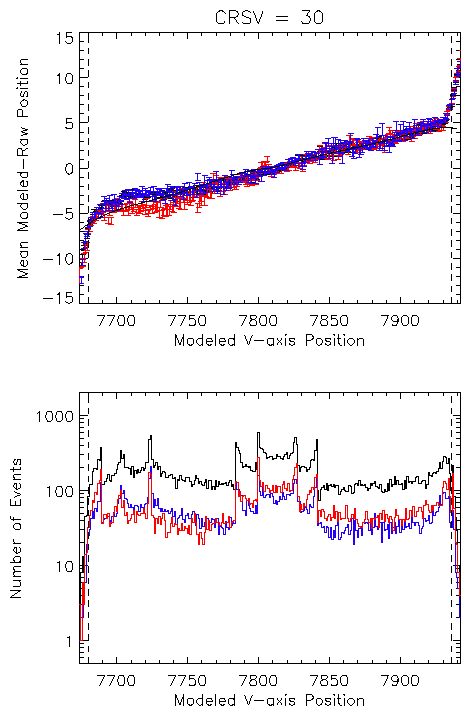
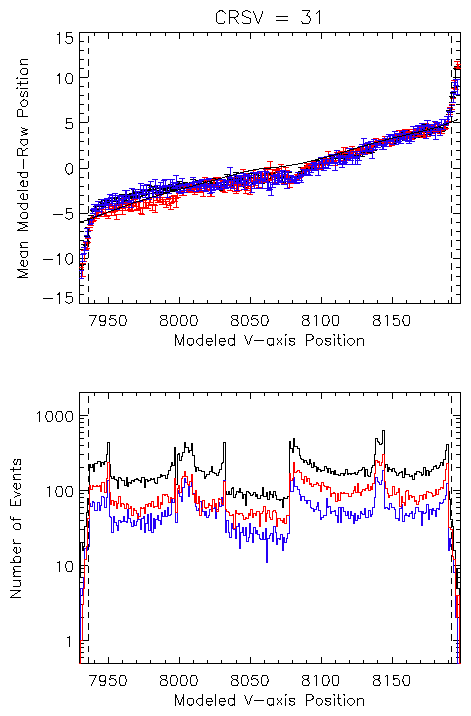
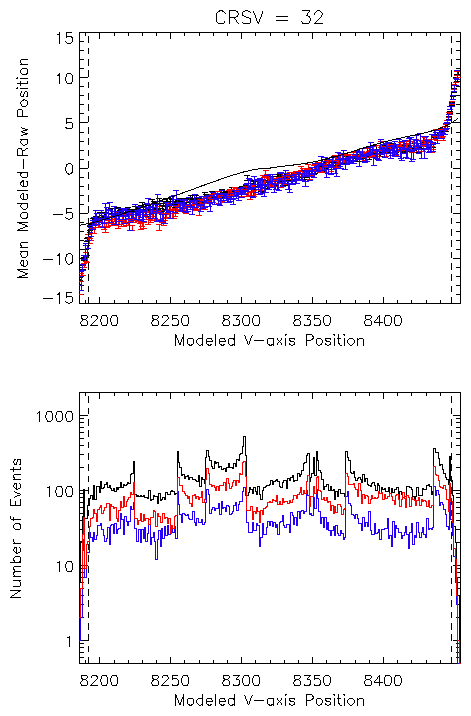
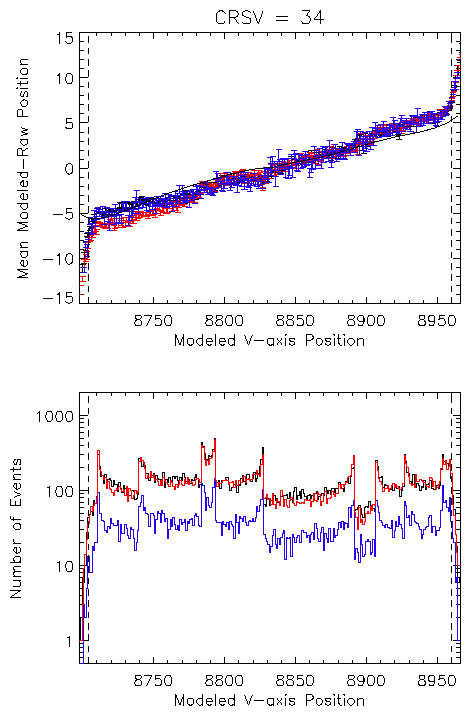
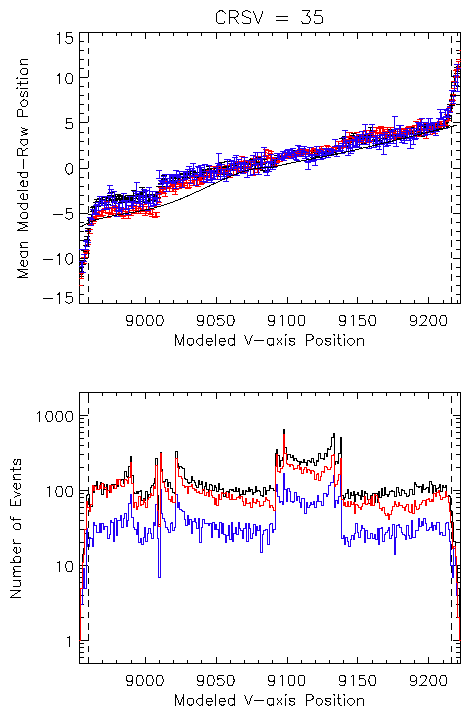
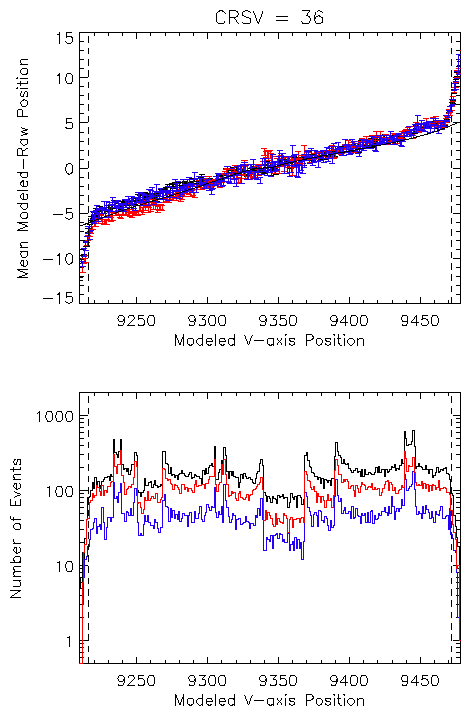
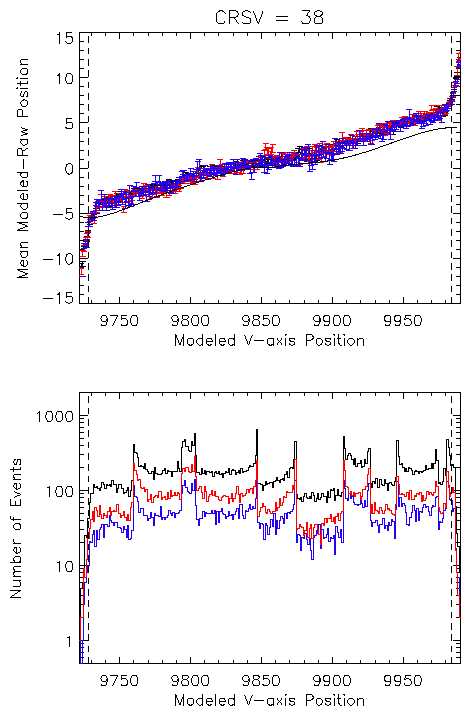
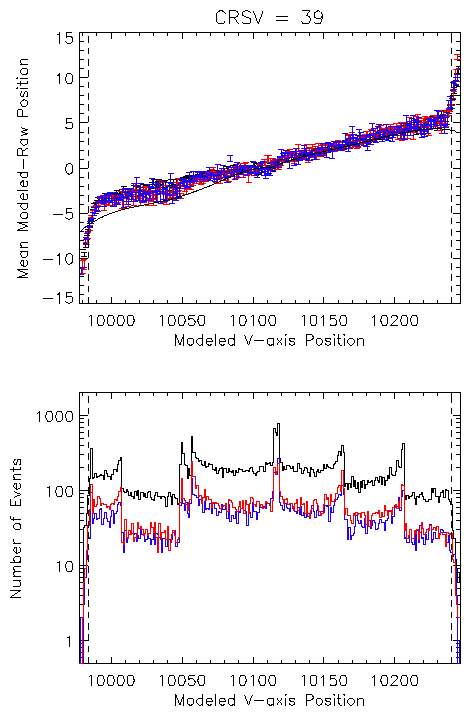
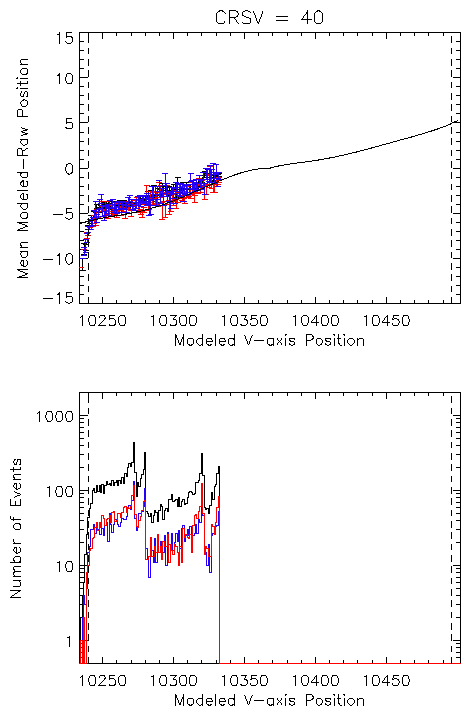
The links below are to plots similar to figure 1 but for other coarse
positions on either the U or V axis.
The mean deviations found above provide the data on which the degap
corrections are based. The degapping correction values are
indexed by the event RAW position along the axis. The correction
value for a given RAW position is selected from the data on the
coarse position that nominally generates the RAW position
(CRS = RAW/256; e.g. a RAW range of 7424-7679 is
CRS 29). If Capella data is not available for the range of
RAW positions (a whole coarse position range or just part of
one) the current CALDB lookup value is used.
On a coarse position where Capella data is available, for each of the
amplifier scales the modeled position bins that are within the
nominal coarse position range and that had events are
selected. These selected modeled positions and the deviations of
the modeled position from the mean RAW position are used to
calculate the corresponding RAW positions. The weighted mean of
the deviations that have corresponding RAW positions at a
given RAW position are interpolated between the minimum and
maximum corresponding RAW positions. Typically, when the modeled
position covered the end of the nominal coarse position range
the minimum/maximum of the RAW positions do not. The depapping
corrections in these gap regions were set to put the events at
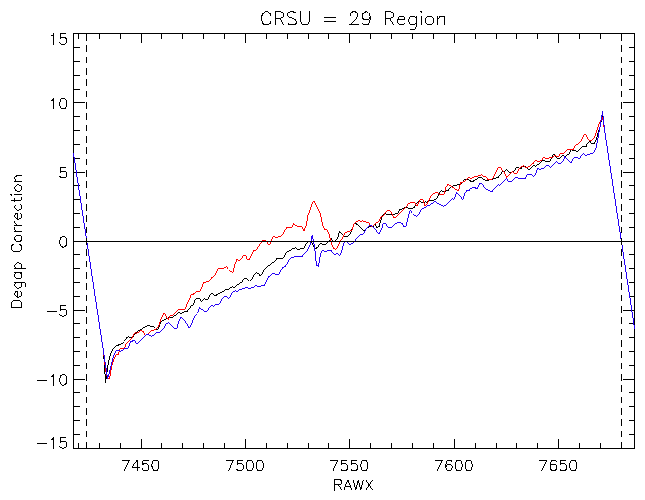
the nominal coarse position boundary. An example of the
resulting degapping corrections is shown in figure 2.
|
|
Figure 2:: Updated degapping corrections in the CRSU = 29
region derived from the Capella observations. Color
indicates the amplifier scale setting for the
corrections with AMP_SF = 1 - blue, 2 - black, 3 -
red. The vertical dashed lines are the nominal
boundaries of the coarse position region.
|
The resulting corrections for each coarse position and amplifier scale
were visually examined. For the CRSU range 4—11 and the
CRSV range 5—12 there are too few events in the
AMP_SF = 3 setting for reasonable degapping
corrections to be determined using data from that scale. Rather
than continuing to use the current CALDB correction on this one
scale setting, the degapping correction in the update is the
average of the AMP_SF 1 and 2 values.
Examples
I have used this candidate degapping correction to reprocess a few
observations; the resulting level 2 events files can be obtained at
the following links:
- 01385 AR Lac (1999-Oct-04)
- 00461 3C273 (2000-Jan-22)
- 00463 Cen-A (1999-Sep-10)
- 01253 Cen-A (1999-Sep-10)
- 01412 Cen-A (1999-Dec-21)
- 01918 GRS1758-258 (2000-Oct-27)
- 05060 AR Lac (2004-Sep-13)
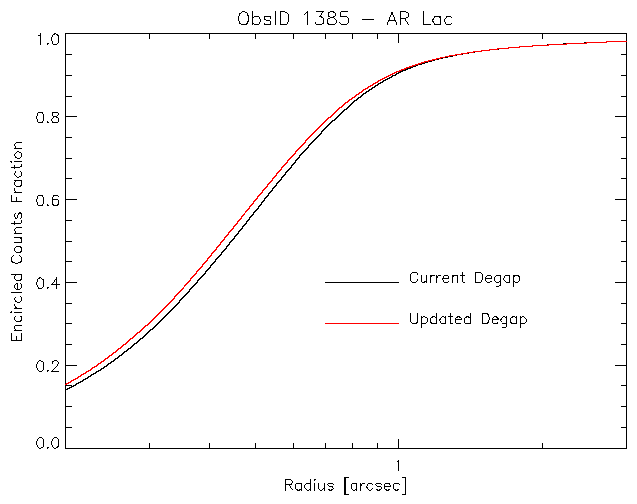
Figure 3 shows a comparison of the encircled counts fraction of the
ObsID 1385 (AR Lac) data between the using the degapping
corrections currently in the CALDB (3.2.1) and the updated
corrections generated here. Using the updated degapping
corrections results in a tighter point-spread function.
|
|
Figure 3: Fractional encircled counts as a function of radius
for the on-axis source AR Lac (ObsID 1385). The black
curve is the result using the degapping corrections in
CALDB 3.2.1; the red curve is the result using the
candidate degap generated from the Capella observations.
|
Last modified: Wed Apr 19 10:14:42 EDT 2006
Dr. Michael Juda
Harvard-Smithsonian Center for Astrophysics
60 Garden Street, Mail Stop 70
Cambridge, MA 02138, USA
Ph.: (617) 495-7062
Fax: (617) 495-7356
E-mail: mjuda@cfa.harvard.edu