Previous Contents Next
Instruments: HETG
HETG Calibration
The HETG spectrometer continues to provide high-quality dispersed
spectra with stable characteristics. In the past year, progress
was made on the effective area calibration of the HETGS by
including an update to the HEG and MEG efficiencies and a
correction for the HRMA's Ir M-edge response. These updates were
released on 15 December 2005 in the CALDB version 3.2.1. The
efficiency changes bring the HEG and MEG spectra into agreement:
the error between them was apportioned to the HEG below and the
MEG above a cross-over point of 1 keV. Using these updated
calibration products, fractional residuals in spectral fits
should now be less than 5% from 0.5 to 8 keV - provided that one
is fitting the "real" source model! The major remaining
degree of calibration freedom, the absolute effective area, is
being studied through on-going cross-calibration, in particular
with the XMM-Newton instruments and the RXTE
PCA.
With these
calibration improvements, the six years of HETGS data form a unique and coherent
spectral resource. We're also entering a new era of HETGS
calibration focussing more on calibration's effects on
science conclusions, e.g., along the lines begun in the
special session on "Incorporating Calibration Uncertainties
into Data Analysis" at the Chandra 2005 Calibration Workshop
[0]. As always, up-to-date HETG calibration status and details
are available on the web [1].
We note for HETG fan[atic]s that the infamous "HETG paper" has been
published: Canizares et al. 2005 [2]; it includes many gory
details of the design, fabrication, ground and flight
calibration of the HETG. Although not required reading for the
general observer it is a useful reference and may give future
instrument builders a hint of what they're getting into.
HETG Science: The AGN NGC 3783
The object NGC 3783, an active galactic nucleus (AGN), is thought to
harbor a 30 million solar-mass black hole which is surrounded by
an accretion disk, out flowing ionized material, and
an obscuring torus; Figure 12 illustrates the geometry. If viewed at
the orientation of this illustration, the central source would
be obscured by the torus and this would be classified as a
Seyfert 2. NGC 3783, in contrast, is a Seyfert 1 where our
viewing angle is above/below the torus and lets us see directly
to the bright, central source. In terms of its physical size,
the inner diameter of the torus is of the order of parsecs,
roughly the same size as the Cas A supernova remanant in our
Galaxy. Located about ten thousand times further away from us
than Cas A, NGC 3783 appears as an unresolved point source to
the Chandra telescope and so its spectrum is the
main source of detailed information.
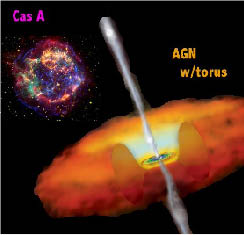
FIGURE 12: An illustration of a generic Seyfert AGN. At the distance
of NGC 3783 this image would subtend one-tenth of an arc second
on a side. Interestingly, the AGN's physical scale is of the
same order as that of Cas A, as shown.
Back in the years 2000 and 2001,
HETGS observations totaling 900 ks were dedicated to NGC
3783, a cycle 1 GTO (PI: G. Garmire) and a cycle 2 GO
(PI: I. George.) The observations were carried out and the
spectra were analyzed and published in a timely fashion
[3,4]. The bright continuum spectrum emitted by the
central source was seen to contain many absorbtion lines,
generally blue-shifted from the galaxy's rest frame at
z=0.00976. These are interpreted as being due to
outflowing gas along the line of sight. Much of the
absorbtion is not from cold, neutral atoms but from
ionized atoms, i.e., a "warm
absorber".
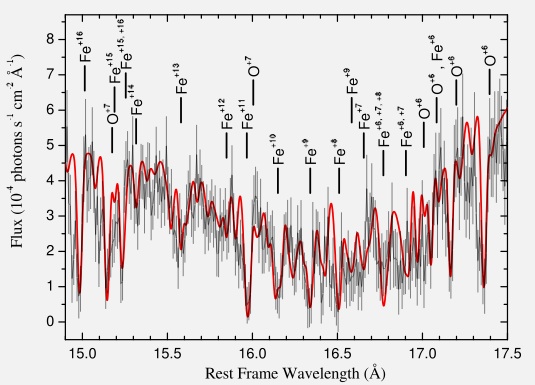
FIGURE 13: HETGS spectrum of NGC 3783 in the Fe-M unresolved
transition array (UTA) region fitted with a detailed ion-by-ion
model, red line. (From Holczer et al., Fig.2)
Even with the extensive analysis given, this data set is
not depleted: during
the past year there have been at least 5 further papers
explicitly making use of these HETGS data to carry out new
analyses [5,6,7,8,9]. Example spectra and highlights from
these papers are shown in Figures 13 through 17. Clearly,
these are spectra that tell a story - and it's still in
translation.
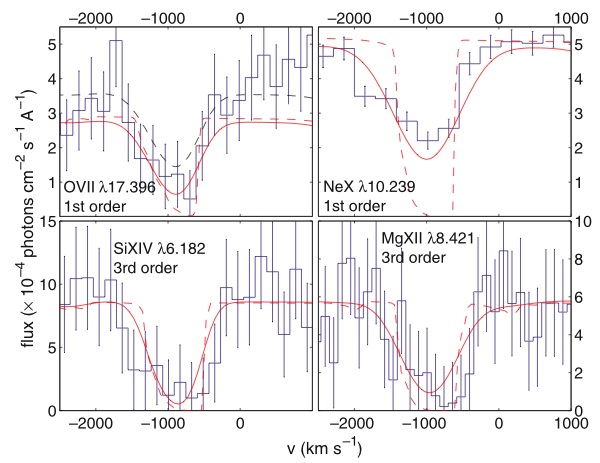
FIGURE 14: Best-fit model (solid lines) to MEG and HEG first-order and
MEG third-order absorption-line profiles. The asymmetric model
line shape before instrumental convolution is shown as well
(dashed.) (From Chelouche et al., Fig.11)
Of course, NGC 3783 is not
the only Seyfert AGN to be observed with the HETGS; it is just one of
many "good reads" available in the Chandra archive. To make these data more
available to the general astronomy community, a
Chandra archival grant was awarded to
make a database of HETGS AGN products that are in "ready
to go" format, e.g., rest-frame fluxed spectra. Although
in development now, keep your eye on the "Hot Gas" web
page [10] and/or send a request to the e-mail address on
that web page to be informed when it is
online. And... enjoy the stories!
Dan Dewey, for the HETG
team.
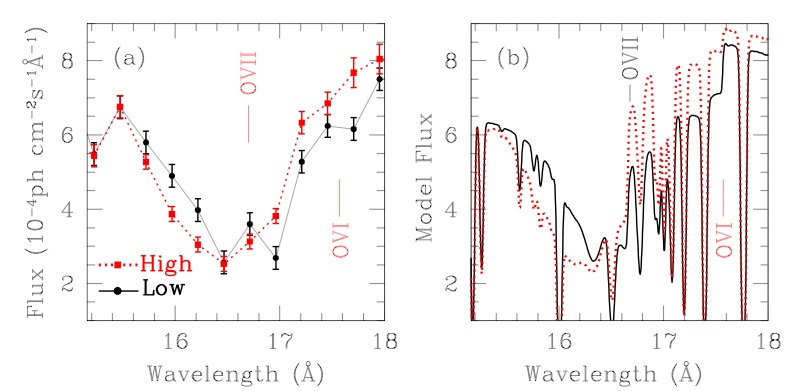
FIGURE 15: (a) HETGS spectra of NGC 3783 in
the UTA region for spectrally-identified "low" and
"high" states. (b) Plotted here are spectra from a
photoionization model for a nominal central source flux
and for a flux change by a factor of 2. The model change
is in agreement with the low-high state difference seen in
(a). (From Krongold et al., Fig.1(a)(b))
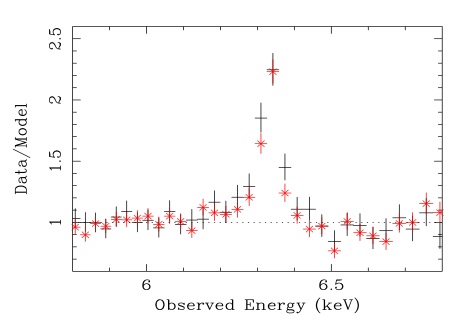
FIGURE 16: Ratios of the HEG spectrum to a
simple power-law continuum model. The Fe-K emission line
is shown for data separated into two states and hints at a
slightly broader core in one set ("+" symbols) than in
the other ("*" symbols.) (From Yaqoob et al.,
Fig.5)
|
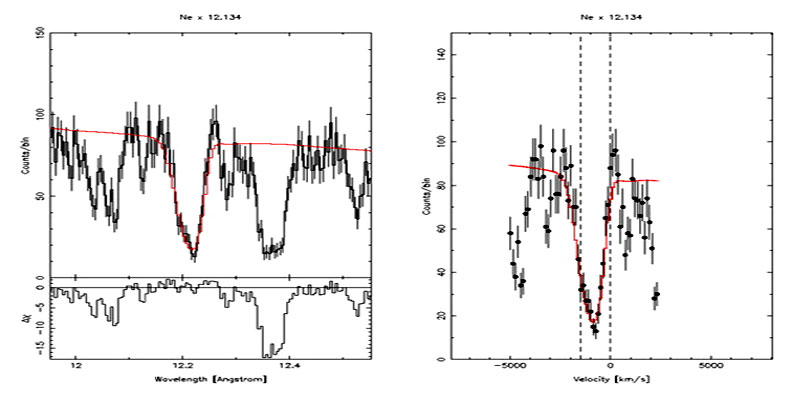
FIGURE 17: Histogram data of Ne X and
neighboring absorption lines with model and continuum
overplotted, shown in both wavelength (left) and velocity
(right) space. (From Ramirez et al.,
Fig.3)
|
References
[0] Chandra2005 Cal Workshop: http://cxc.harvard.edu/ccw/proceedings/05_proc/index.html
[1] HETG calibration: http://space.mit.edu/CXC/calib/
[2] Canizares et al, 2005, PASP 117, 1144.
[3] Kaspi et al. 2001, ApJ, 554, 216.
[4] Kaspi et al. 2002, ApJ, 574, 643.
[5] Holczer, T., Behar, E., and Kaspi, S. 2005, ApJ, 632, 788.
[6] Chelouche, D. and Netzer, H. 2005, ApJ, 625, 95.
[7] Ramirez, J.M., Bautista, M. and Kallman, T. 2005, ApJ, 627,
166.
[8] Krongold, Y., Nicastro, F., Brickhouse, N.S., Elvis, M., and
Mathur, S. 2005, ApJ, 622, 842.
[9] Yaqoob, T., Reeves, J.N., Markowitz, A., Serlemitos, P.J., and
Padmanabhan, U. 2005, 627, 156.
[10] Hot Gas web page: http://hotgas.pha.jhu.edu


