The Chandra project decided again in July 2005 to postpone indefinitely the bakeout of the ACIS instrument. Over the past year the contamination working group evaluated new information on the expected increase in CTI due to warming the CCDs to room temperature and an expanded investigation of the uncertainties in the simulations of the migration of the contaminant during the bakeout. The MIT ACIS team conducted a new series of irradiation experiments in order to understand the on-orbit mechanism for the radiation damage better. The results of these experiments led to a refined prediction of the possible CTI increase due to warming the CCDs during the bakeout.
The MSFC project science team led an effort with considerable participation from the spacecraft team at Northrop Grumman Space Technology, the ACIS engineering team at Lockheed-Martin and MIT, the Science and Flight Operations teams in the CXC, and the ACIS science teams at MIT and PSU to develop simulation SW to model the migration of the contaminant during a bakeout and to evaluate the uncertainties in the predictions. The details of this effort can be found in O’Dell et al. 2005 SPIE, Vol. 5898, p.3010. The conclusion of this work is that given the current uncertainties, the outcome of the bakeout cannot be predicted with sufficient confidence to proceed. For the range of parameters considered in the simulations, the results of the bakeout ranged from successful to little or no effect, or perhaps to even an increase in the thickness of the contaminant. Therefore, the Chandra project has decided not to proceed with a bakeout at this time.
The CXC calibration team will continue to monitor the slow growth of the contamination layer and produce updated calibration files as necessary. The contamination working group will evaluate new information as it becomes available and reconsider the decision to bakeout if it is warranted.
Paul PlucinskyThere are several new developments in the calibration of ACIS during the past year. As the charge transfer inefficiency (CTI) increases, we monitor gains and line shapes. Using the TGAIN formalism, we correct energies to their known values, by observing the external calibration source.
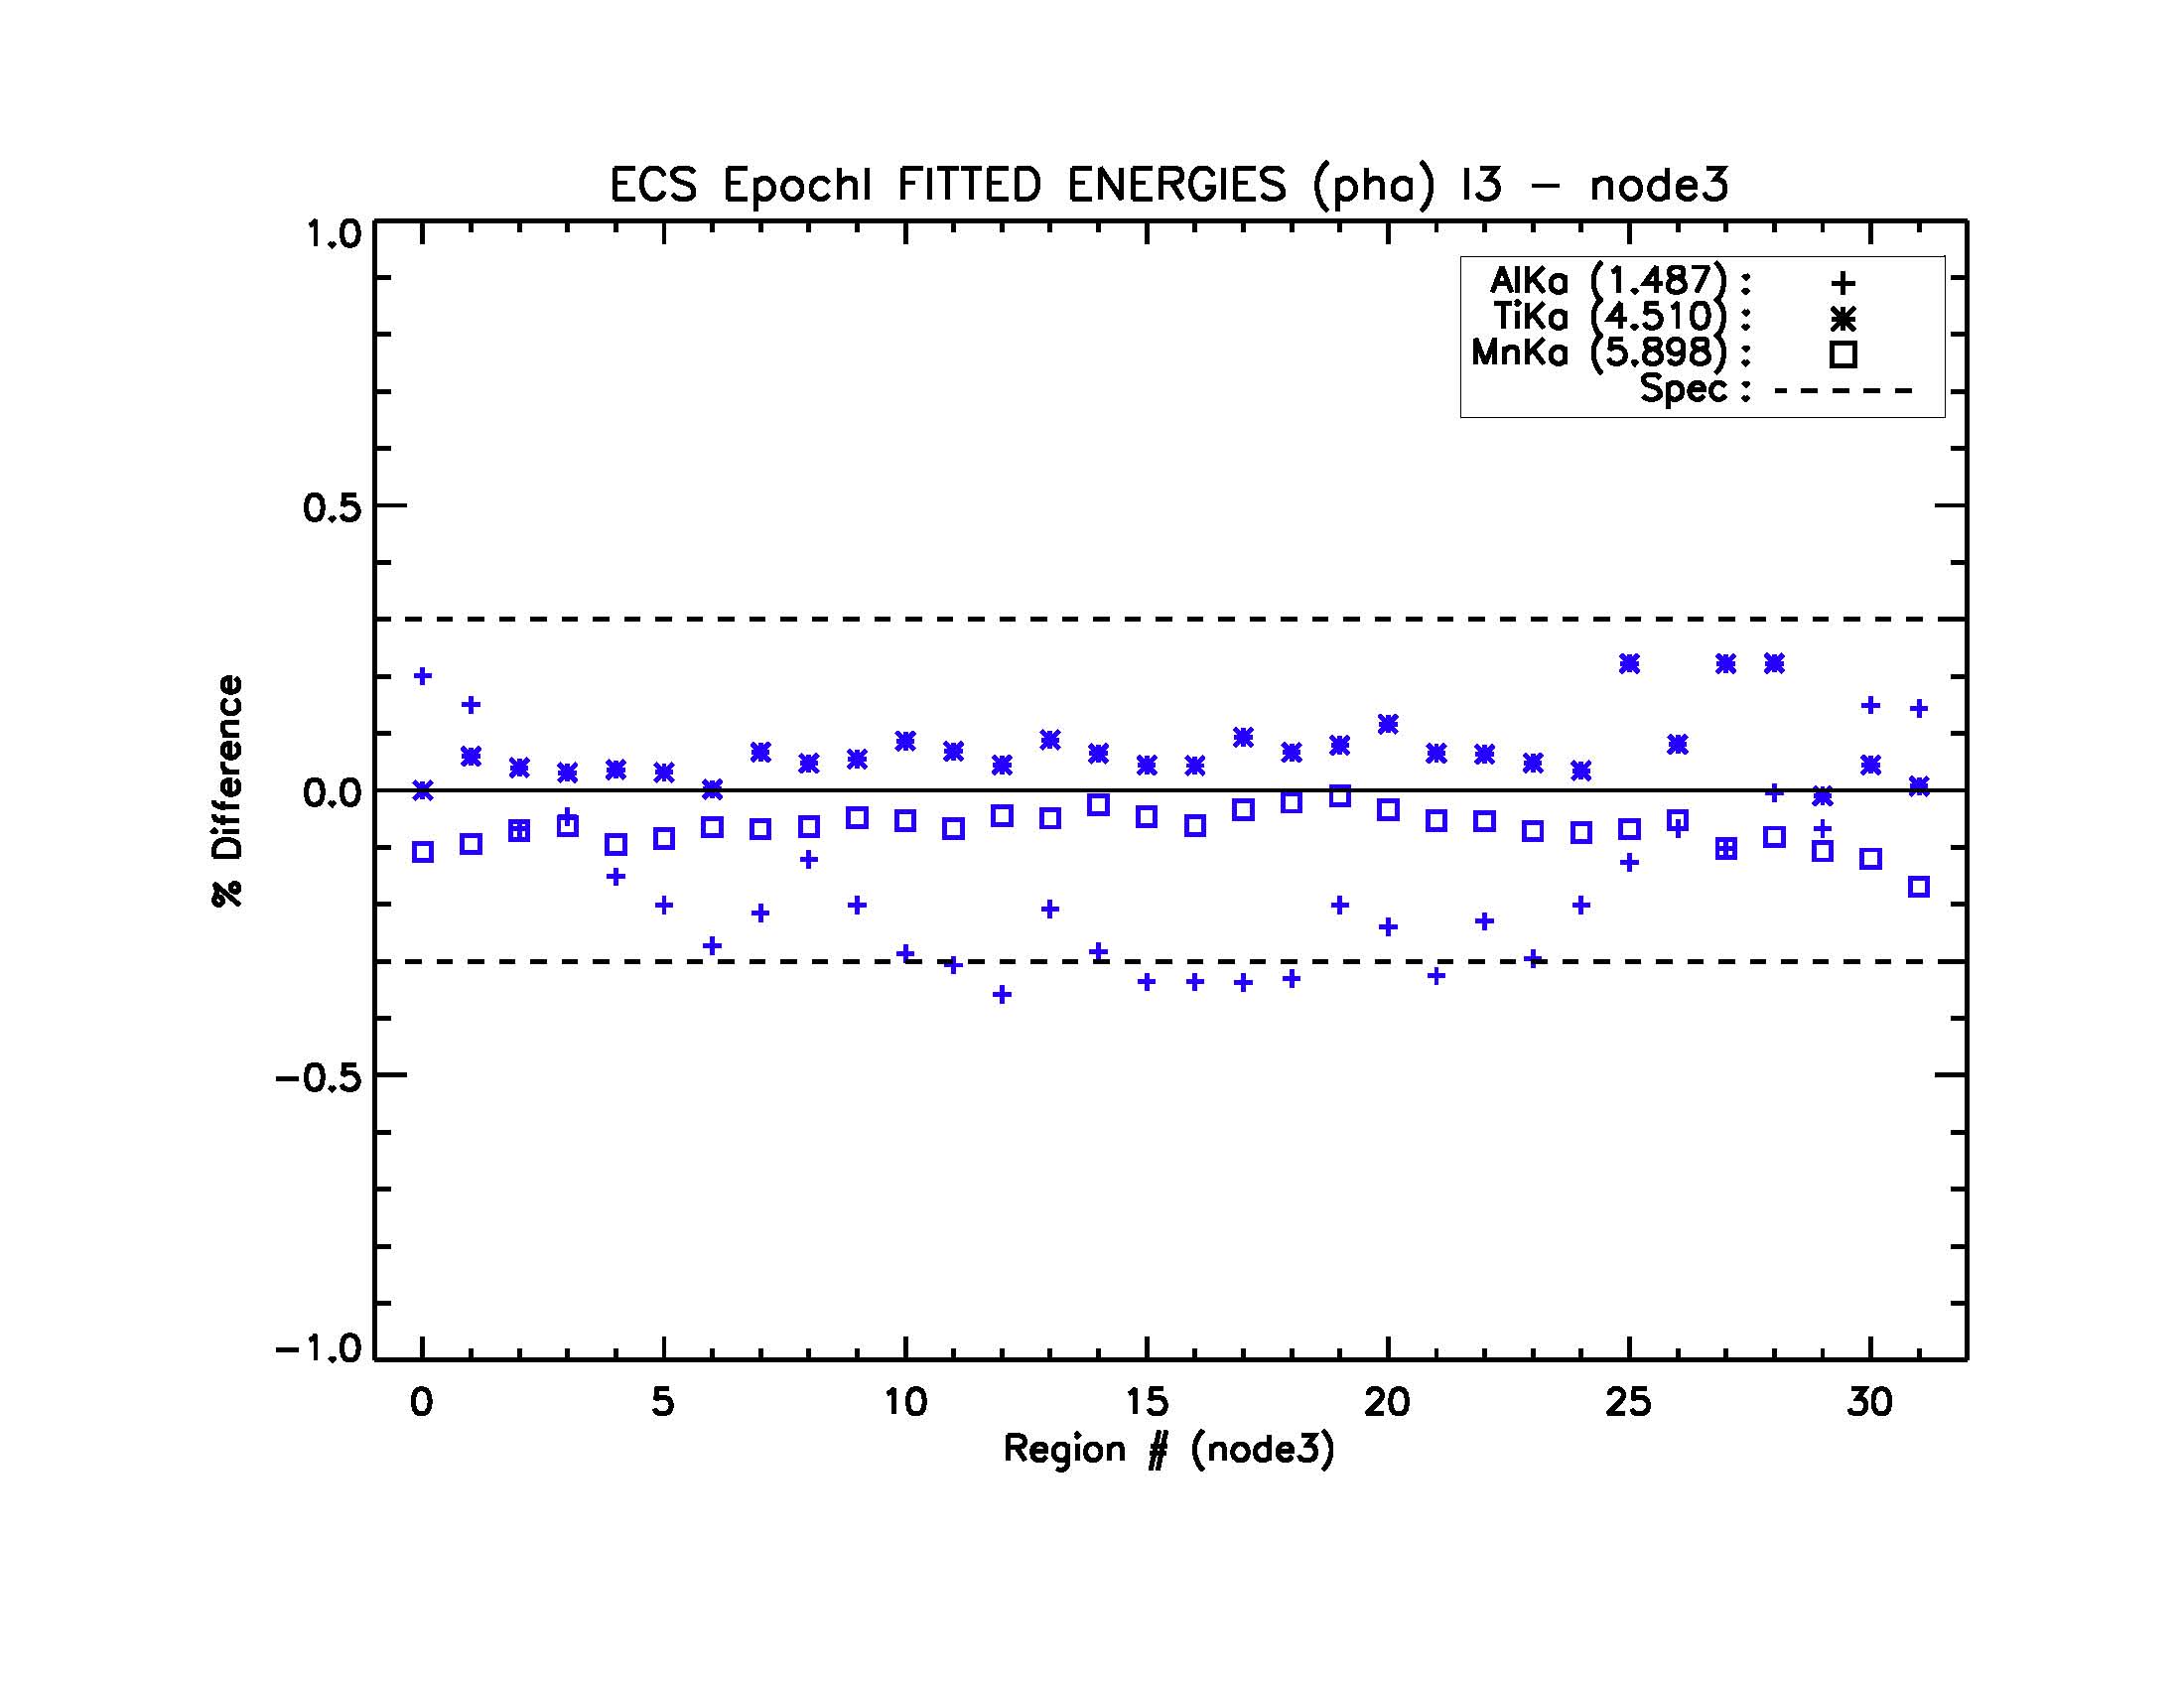
As an example of gain monitoring, we plot (Figure 7) the percent difference between fitted and actual line energies for the K-alpha lines of Mn (5.9 keV), Ti (4.5), and Al (1.49). We adjust our gain fits to try to achieve a maximum deviation of 0.3%. We meet it easily for Mn and Ti, but are pushing the limit at Al. In some other nodes for some epochs (3-month periods), the limit is exceeded, especially for middle values of CHIPY. It's not clear what is going on here physically, and it is difficult to correct this effect empirically since we have so little information on the energy dependence. Note that 0.3% is about 1 ADU at the Aluminum K line.
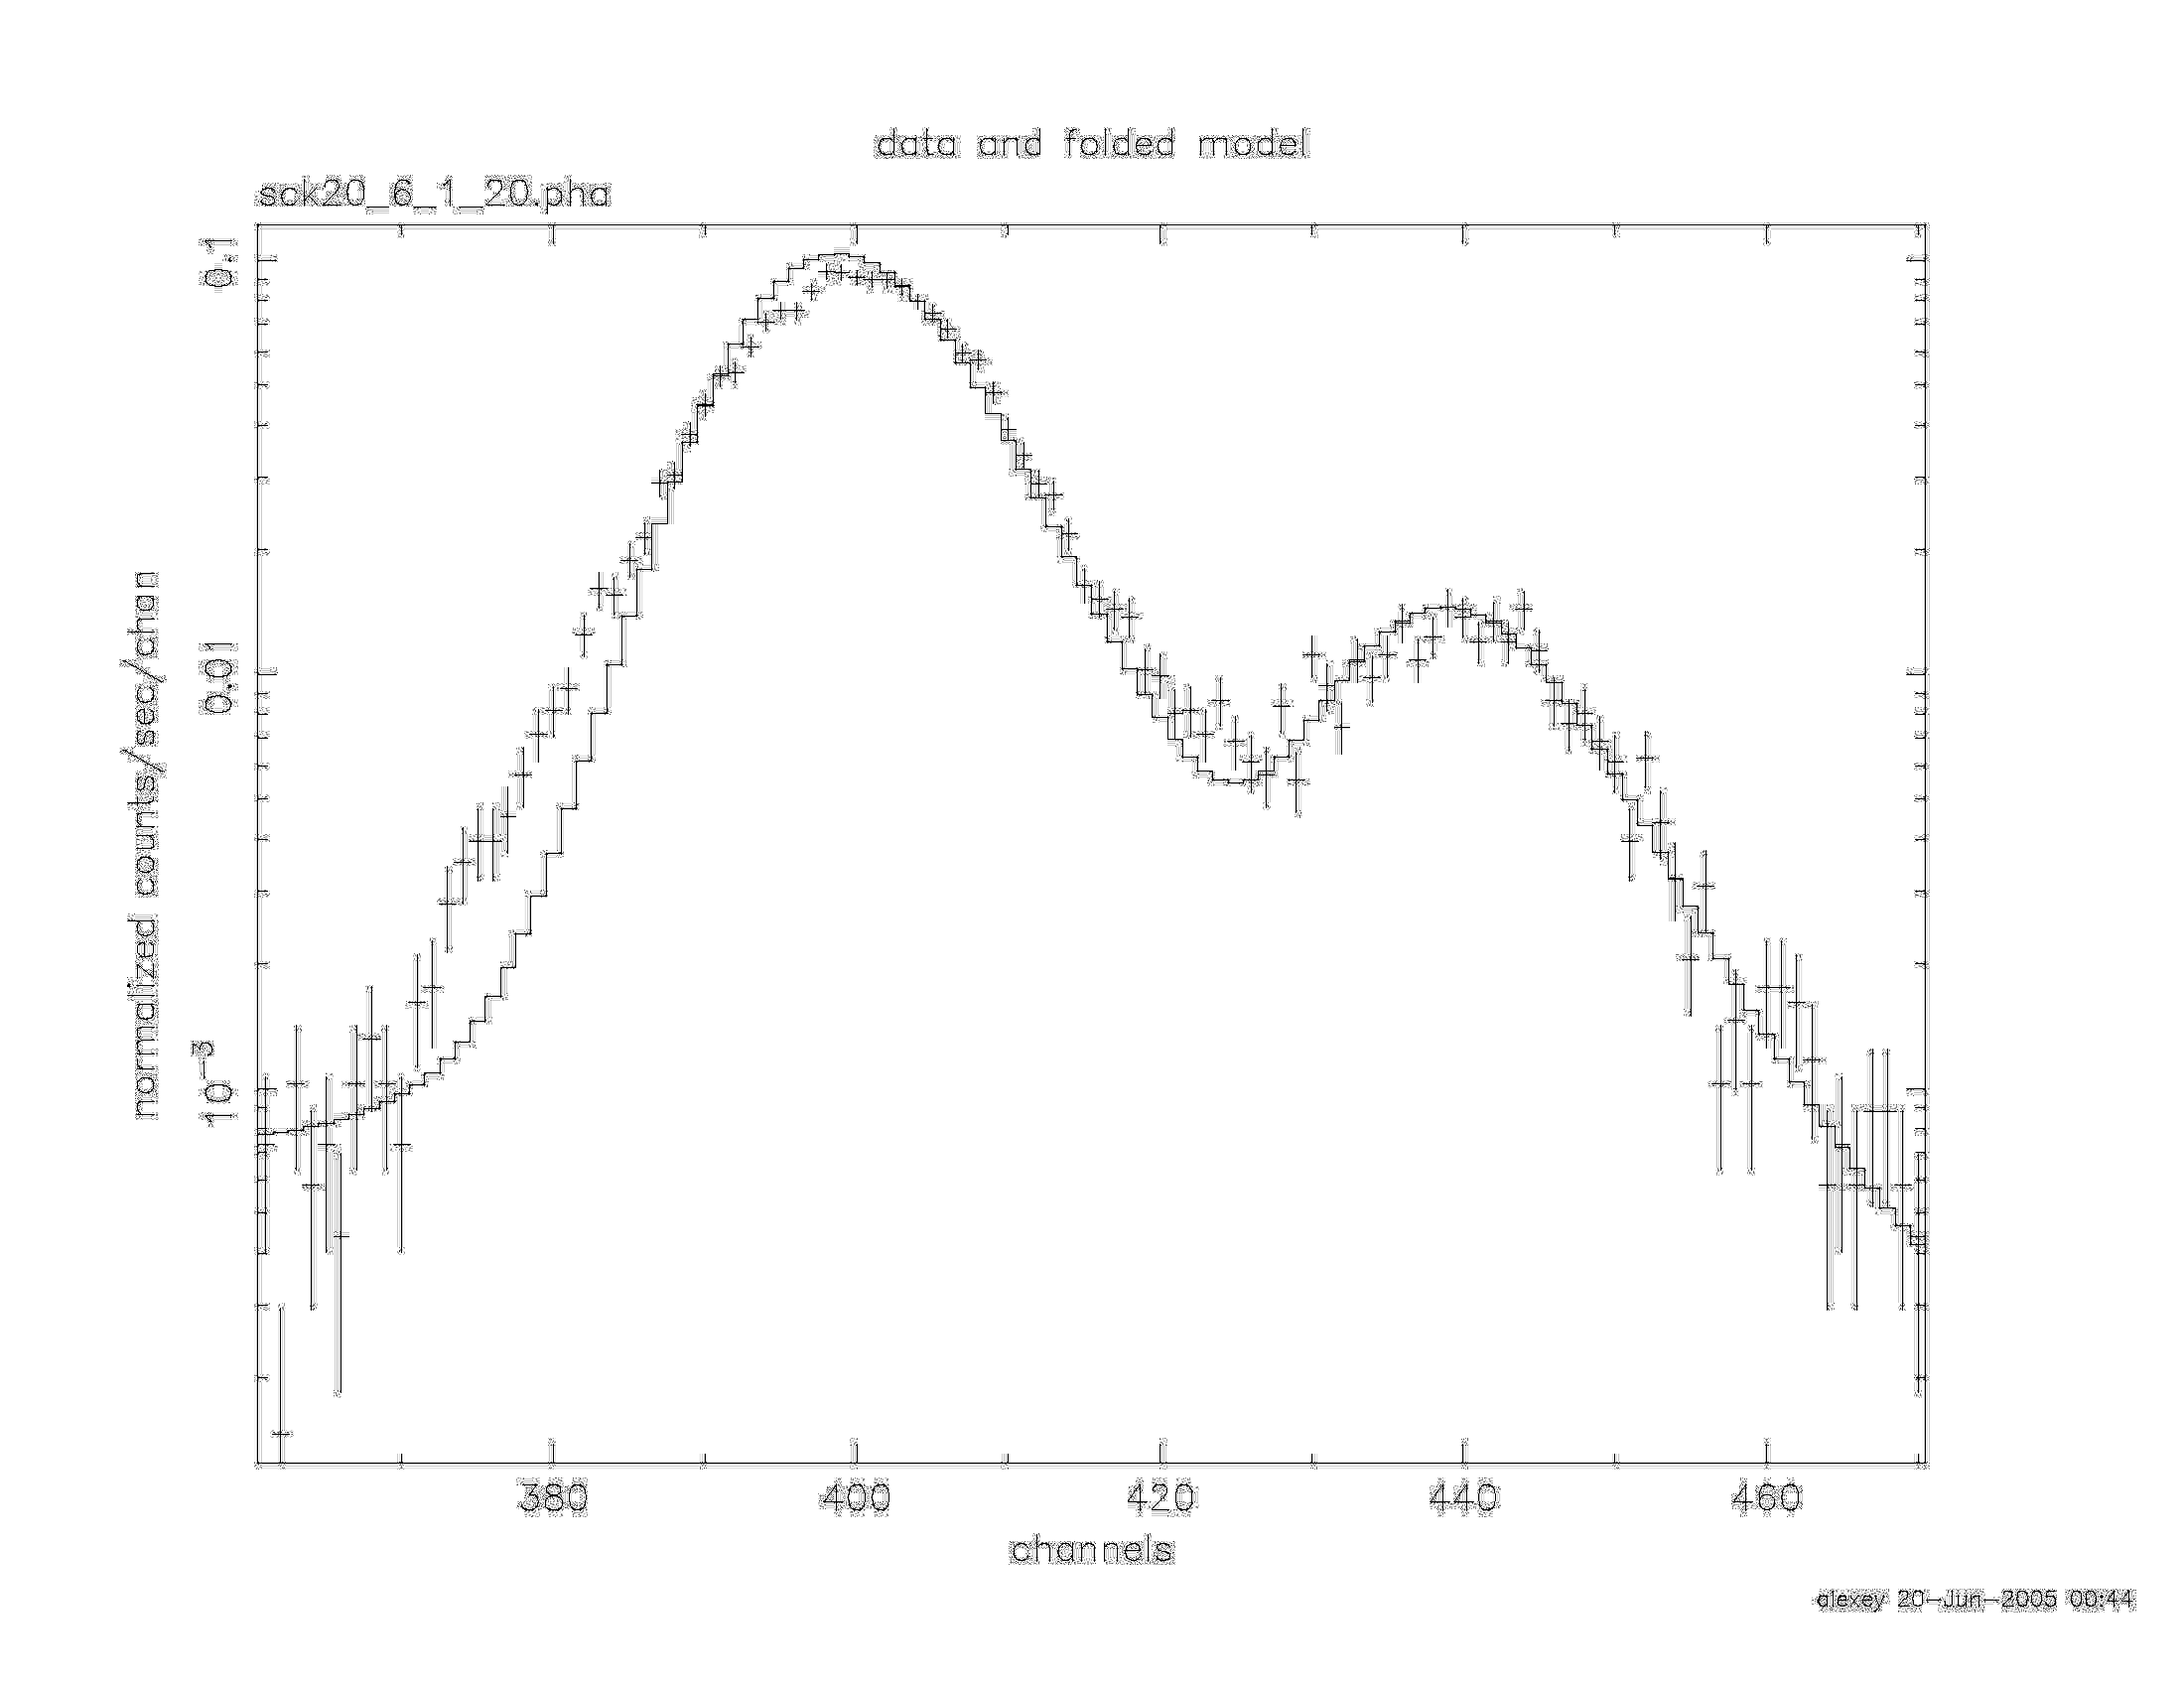
We noticed (Figure 8), that nodes 1 and 2 (the central two nodes) of
the front-illuminated (FI) devices began to exhibit changes in
their line shapes. Accordingly, we undertook to rederive the CTI
trap maps, which are used by acis_process_events for correcting
(some of) the effects of CTI, using external cal source data from
the year starting August 2004. It also proved necessary to
implement a finer grid of chip regions for which TGAIN is
calibrated, from the old standard of 32 x 256 pixel regions to 32
x 32 pixel regions.
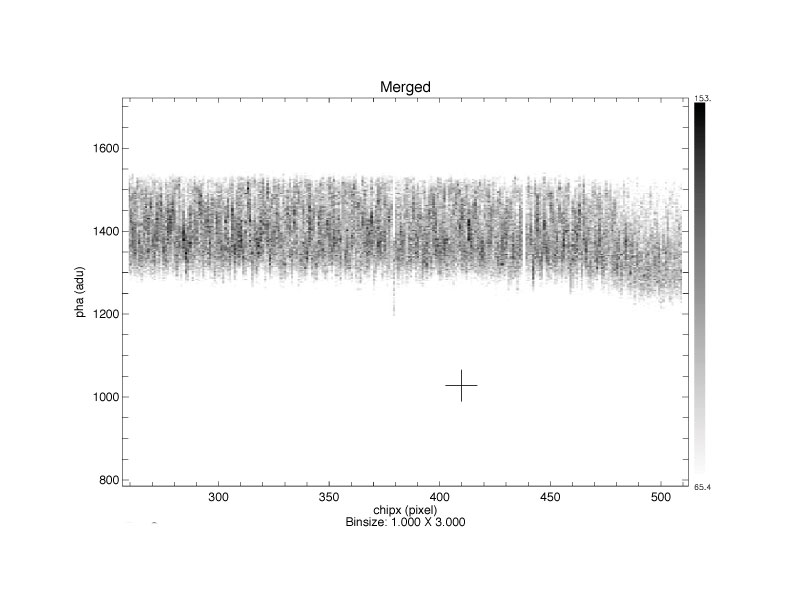
What's happening here is a gain droop for a
roughly 30 columns near the center of the device (Figure 9). This
electrical effect is understood, but it appears to the user as
extra CTI for these columns.
The CALDB with these second-epoch trap map files, and response products to match, was released in November 2005.
Herman Marshall's work with a number of faint continuum sources (Blazars) with HETG data shows that there is a feature in the system throughput near the Si K edge at 1840 eV. This 6% effect may be the result of several effects, all due to the fact that the mean free path of photons in the device is much shorter just hardward of the edge than on the softer side. Events convert into electron clouds closer to the surface, and fluorescent photons and even electrons may not be collected. We are looking at these effects to see if they add up to the required correction.
We are also looking into implementing CTI correction for back-illuminated (BI) devices. This is somewhat trickier than for the FI devices, since there is serial CTI in addition to parallel. A new revision of acis_process_events and the associated calibration files is expected in the spring of 2006. Also anticipated in 2006 is CTI correction for FI devices at a temperature of -110 C (which was the operating temperature of ACIS from September 1999 through January 2000). We will also work on BI CTI correction at -110, but the release date is less clear.
Dick Edgar
FIGURE 10: Trumpler 14 in Carina, 57 ksec ACIS-I. Red = 350-790 eV; green = 790-970 eV; blue = 970-1650 eV.
Most stars are born in massive star-forming regions (MSFRs); the
most massive stars live out their short lives in this environment
and eventually transform it when they explode as supernovae. The
Chandra X-ray Observatory is providing remarkable new views of
these complex regions, revealing all stages in the life cycle of
high-mass stars and their effects on their surroundings.
The Great Nebula in Carina is a remarkably rich star-forming
complex at the edge of a giant molecular cloud, at a distance of
~2.3 kpc. It contains many open clusters with at least 64 O
stars, several Wolf-Rayet stars, and the luminous blue variable
Eta Carinae. The presence of these evolved stars may indicate past
supernovae, although no well-defined remnant has ever been
seen.
Trumpler 14 (Tr 14) is a young (~1 My), compact OB cluster near the
center of the Carina complex, containing at least 30 O and early B
stars. At its center is HD 93129AB, a very early-type (O2I -
O3.5V) binary. Tr 14 is probably at nearly the same distance as
its neighboring, even richer cluster Trumpler 16 (Tr 16), host of
Eta Carinae. These two clusters contain the highest concentration
of O3 stars known in the Galaxy; their ionizing flux and winds may
be fueling a bipolar superbubble.
An Einstein X-ray study of the Carina star-forming complex detected
~30 point sources, mostly individual high-mass stars and the
collective emission from unresolved cluster cores. Also seen was
diffuse emission pervading the entire region, possibly due to O
star winds. Based on experience with Chandra, we now know that
thousands of the lower-mass stars in these young clusters were
likely to be contributing to the diffuse flux seen in the Einstein
data. A major goal of our Chandra observation was to resolve out a
significant fraction of this point source emission so that a
better determination of the spatial and spectral characteristics
of the diffuse component can be made, giving clues to its
origins.
Our 57-ksec ACIS-I observation of Tr 14 with HD 93129AB at the
aimpoint revealed ~1600 point sources and showed that extensive
soft diffuse emission remains; the off-axis S2 and S3 CCDs also
show very bright diffuse emission. Based on other Chandra
observations of stellar clusters, we expect ~90% of these sources
to be stellar members of Tr 14 and Tr 16 rather than unrelated
foreground stars or background AGN. Since the two components of HD
93129AB are resolved in the ACIS data, we can see that they have
very different spectra; both stars show the ~0.5 keV thermal
plasma typical of O stars, but HD 93129A also requires a second,
much harder thermal plasma component, with kT =2.6 keV. We find
that the O3.5V star HD 93250 in Tr 16 requires a similar
2-component plasma with a hard component of kT = 3.3 keV, while
the O3.5V star HD 93128 in Tr 14 shows a single soft
component. Similar hard emission has been seen in other Chandra
and XMM observations of massive stars; it may be due to colliding
winds in close binary systems or to complex magnetic field
interactions.
Soft diffuse X-ray emission pervades the Tr 14 H II region and is
resolved from the point source population; part of it is most
likely from the fast O-star winds that thermalize and shock the
surrounding media. Its asymmetric spatial distribution is due in
part to the Carina I molecular cloud lying just west of Tr 14.
The brighter diffuse emission to the southeast of Tr 14 is
mysterious. The part on the I3 chip is intrinsically brighter and
more absorbed than the bright swath seen on the S3 CCD, although
its apparent surface brightness is reduced due to absorption.
This bright swath on S3 is far from any of Carina's massive
clusters and its spectral fit requires no absorbing column. Both
the I3 and S3 diffuse emission are well-fit by a thermal plasma
with kT ~0.6 keV, but the I3 emission requires an additional
component with comparable normalization at kT ~ 0.3 keV. The S3
fit requires high abundances of Ne and Fe. The spatial and
spectral characteristics of this diffuse X-ray emission provide
evidence that it may be the signature of an old cavity supernova
remnant from a star that exploded inside the Carina
superbubble.
This article was excerpted from:
Townsley, L. K., Broos, P. S.,
Feigelson, E. D., & Garmire, G. P. 2005, IAU Symposium, 227,
297.
Additional references can be found in that article.
Leisa Townsley
Penn State University