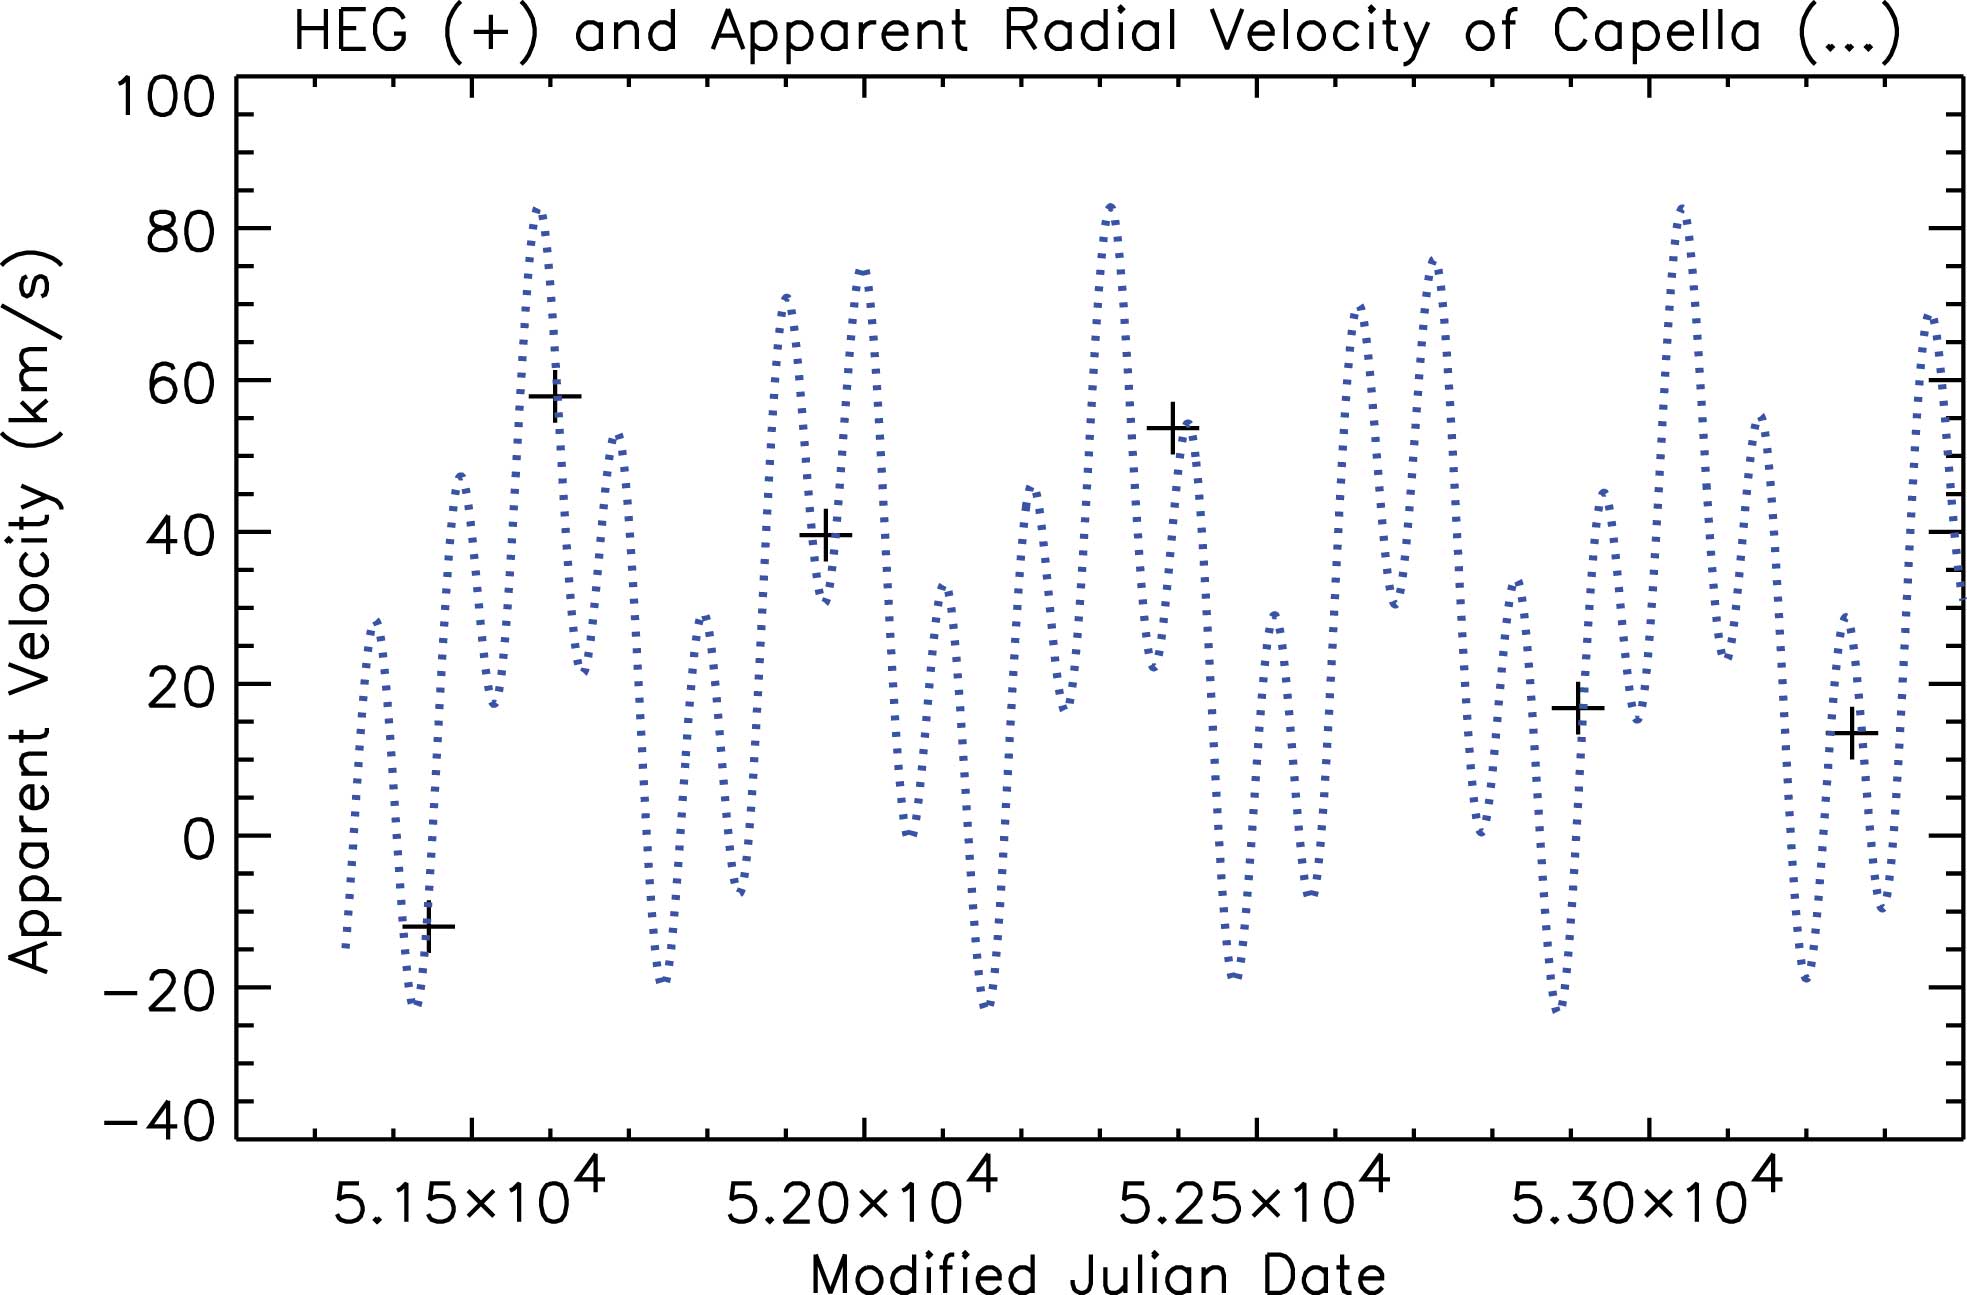
Figure 14: Predicted variations in our Capella line of sight velocity over five years of Chandra observations. The HEG measured values are sown by the "+"s.
There has been good calibration progress for the HETG spectrometer (HETGS = HRMA+HETG+ACIS-S) as described in the Chandra Calibration Workshop 2004, presentations to the Chandra Users Committee, and on the CXC Calibration web pages. Specifically, the ACIS contamination thickness is now characterized in the CALDB, varying with both time in the mission and with location on the ACIS arrays; the ACIS 'FI/BI' QE issue has been reduced from a 15% effect to < 5%; and the HRMA ęIr-M edgeė 10% area jump at 2.075 keV can be reasonably modeled by a constant 17ü layer of hydrocarbon on the HRMA. With these issues solved we are at the point of cross-calibrating HEG and MEG effective areas by adjusting their diffraction efficiencies with energy; note, however, that this is at most a 7% effect.
In terms of geometry, and hence resolving power and wavelength scale, we have measured and updated the ACIS-S chip locations to the 0.2 pixel level (Ishibashi and Dewey 2004) and in the process demonstrated the stability of the HETGS wavelength scale to better than a part in ten thousand from observation to observation over the mission; see the Capella velocity example below. This improved geometry allowed us to have confidence in calibrating the HEG and MEG wavelength scales and we have adjusted the MEG period to 4001.95ü; a small change equivalent to a 40 km/s velocity shift.
In one of his 1905 papers, Einstein wrote: "... assume the quantity c to be a universal constant - the velocity of light in empty space." And further he notes that "... the velocity of light in our theory plays the part, physically, of an infinitely great velocity." In astrophysically useful units this ęinfiniteė velocity is a mere 6-digit figure: 299,792 km/s. How does this compare with velocities of everyday life? We walk at a speed of about 0.001 km/s; fast cars and fast baseballs go at around 0.04 km/s; commercial aircraft, sound, and the rotation of the surface of the earth are all in the range of 0.20 to 0.45 km/s. Perhaps the fastest terrestrial speed is obtained by Superman, exceeding 1 km/s.
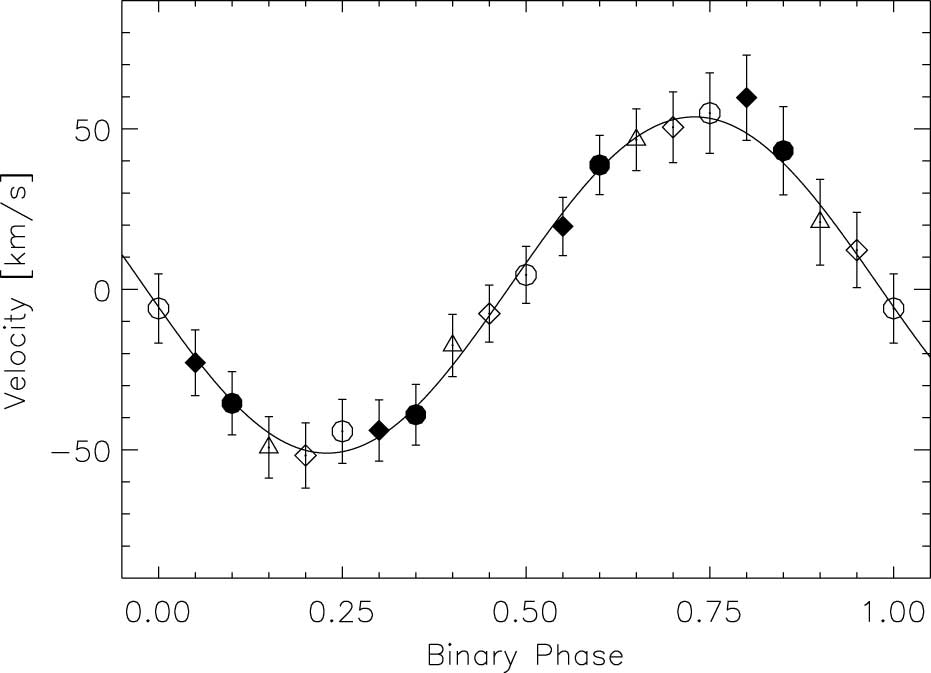
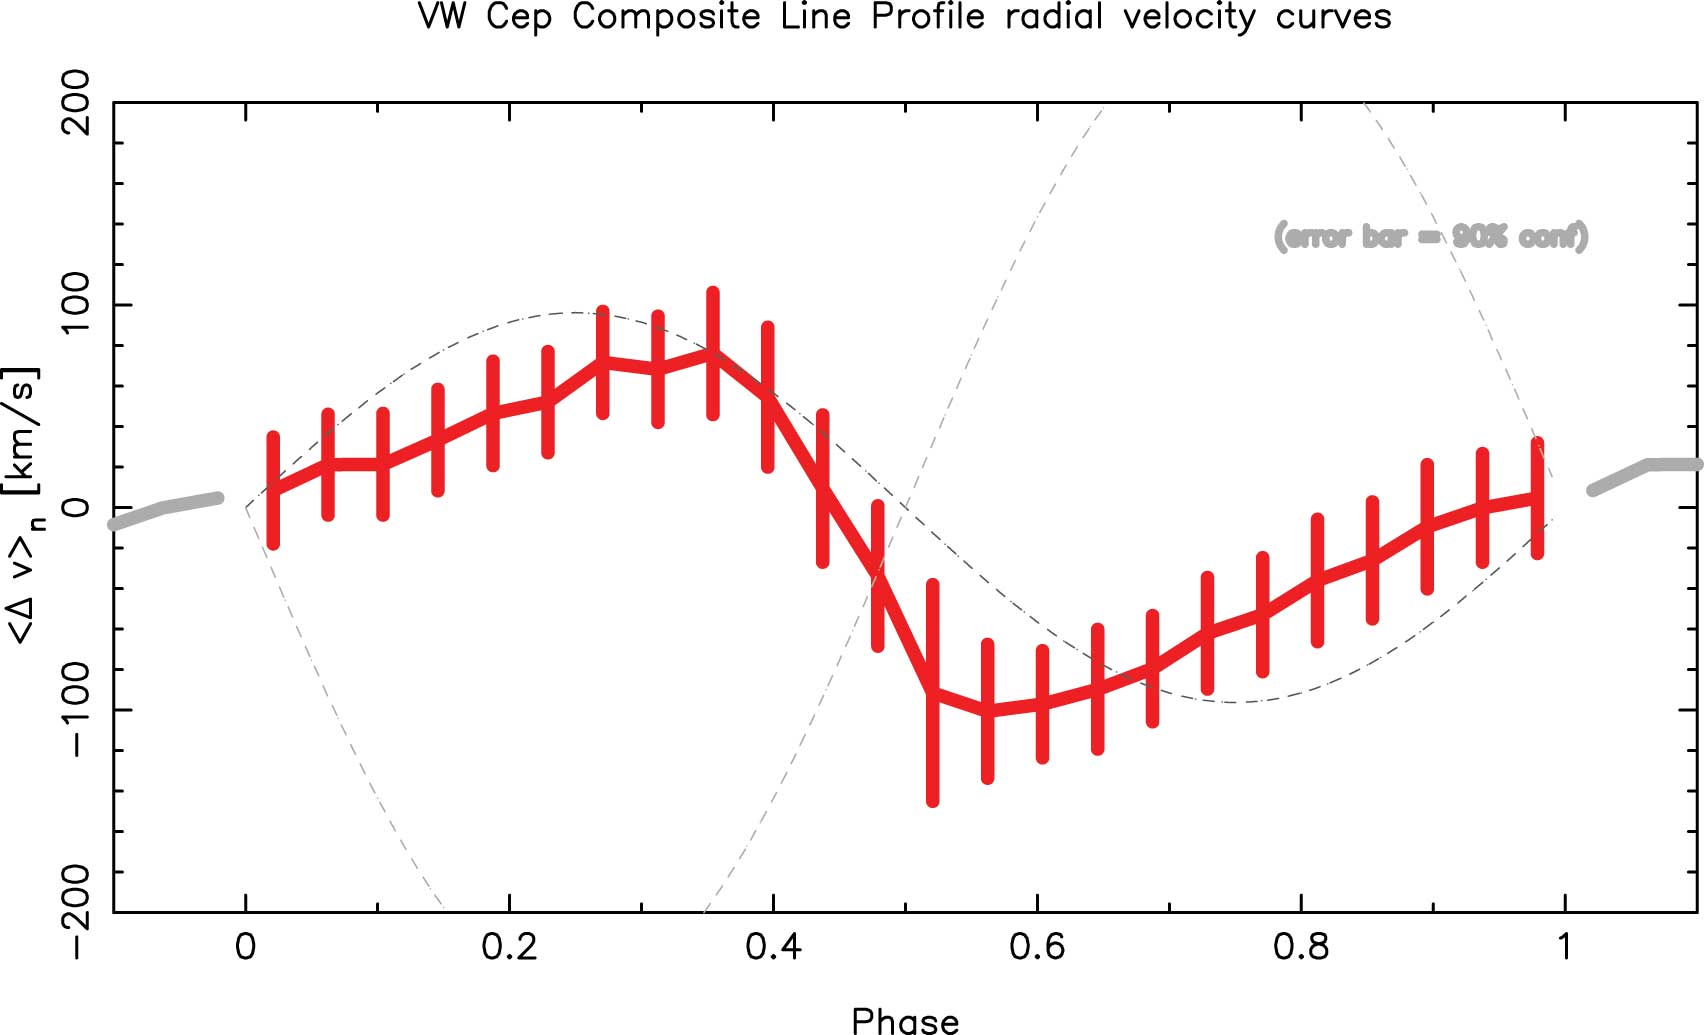
Beyond the Earth, greater velocities are common becoming a significant fraction of c resulting in Doppler shifts of spectral lines that can be measured with the HETGS. The examples below cover the range b=v/c from 10-4 to 0.27. In calibration observations of the binary star system Capella made yearly with the HETGS, the combined effect of the Earth's orbital motion and the Capella 104 day period, each of ┼ 30 km/s amplitude, produces a small but measurable shift in the wavelength of its spectral lines, Figure 14. Other binary systems have been measured with the HETGS. For example, the white dwarf system EX Hydrae (Hoogerwerf et al. 2004), with a 1.63 hour period, is shown in Figure 15; the velocity measurement allowed a very accurate determination of the white dwarf's mass. Although in these two examples the orbits show sinusoidal shapes, the velocity signature need not be so simple as the case of the contact binary VW Cep with a period of 6.72 hours shows, Figure 16. This shape is likely due to the geometric complexity of the synchronized, distorted, and partially eclipsing components of the system. The binary Algol (Chung et al. 2004) shows an amplitude of ┼ 180 km/s for the X-ray emitting material and suggests that the emission is ęnot perfectly centered on Algol B, but is shifted slightly inward toward the primary starė.
Velocities in the few thousand km/s range are seen in young supernova remnants, for example E0102 (Flanagan et al. 2004) shows 2000 km/s velocity effects in its Ne X emission observed with the HETGS. The brightening SNR 1987A is expanding with a speed of 4167 km/s (Park et el. 2004) - will Doppler effects be seen from this source in Chandra gratings data? Stay tuned. Perhaps the highest discrete, rest-frame velocity material seen with the HETGS are the oppositely directed jets of the binary system SS 433 which travel at 80,000 km/s or 0.27c (Marshall et al. 2002; Newsletter Issue 8). Additional observations of this source, e.g. during partial jet eclipse, are helping to study the jet structure (Chandra Press Release, 5 January 2004; http://chandra.harvard.edu/press/04_releases/press_010504.html).
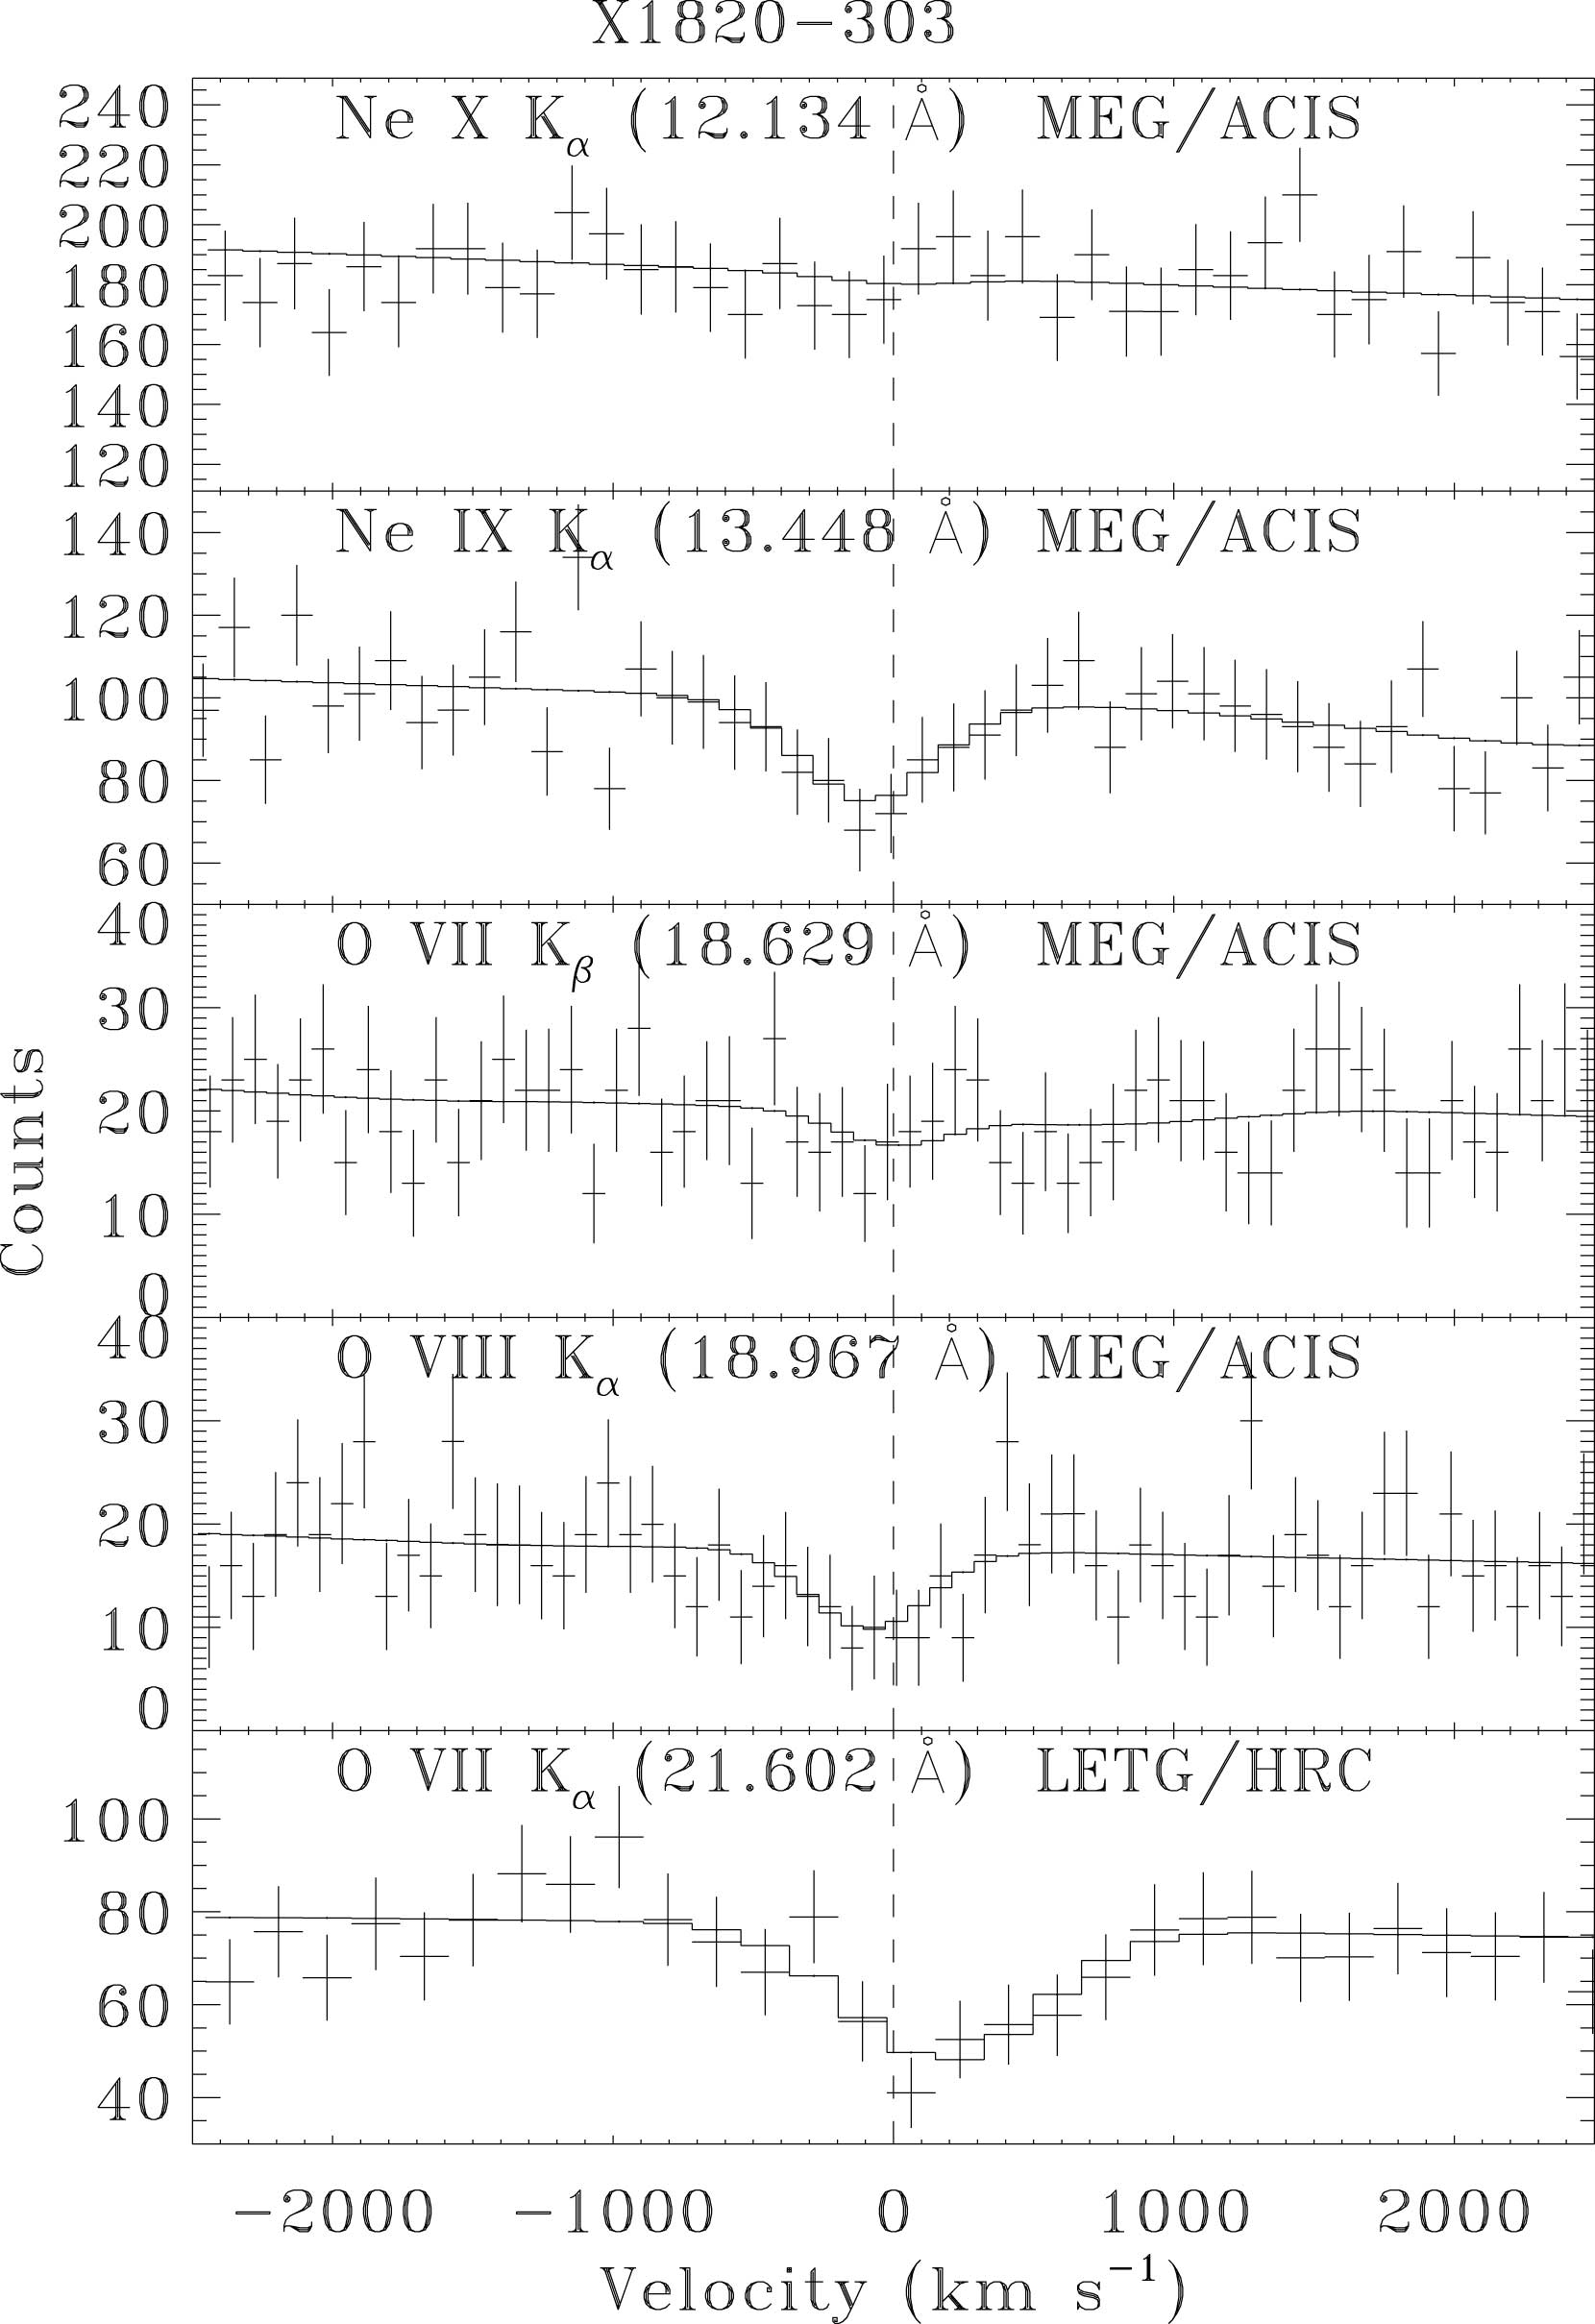
The previous examples involved the observation of emission lines from hot plasmas. The existance and motion of hot plasma can also be detected in absorption with the plasma along the line-of-sight to an X-ray emitter. One such plasma is the hot interstellar medium, HISM, which surrounds our Galaxy. Because this gas is essentially at rest, it can be detected as absorption lines at zero-velocity in the spectra of bright Galactic and extra-Galactic sources (Yao et al. 2005). Figure 17 shows data from the binary X1820-303 and a simultaneous model fit to five X-ray absorption features. Adopting the ISM abundances of Wilms et al. (2000) the main free parameters are the total column density and the plasma temperature, assuming collisional equilibrium. By measuring the column density to a variety of sources at various distances and directions the extent and geometry of the HISM is coming into focus.
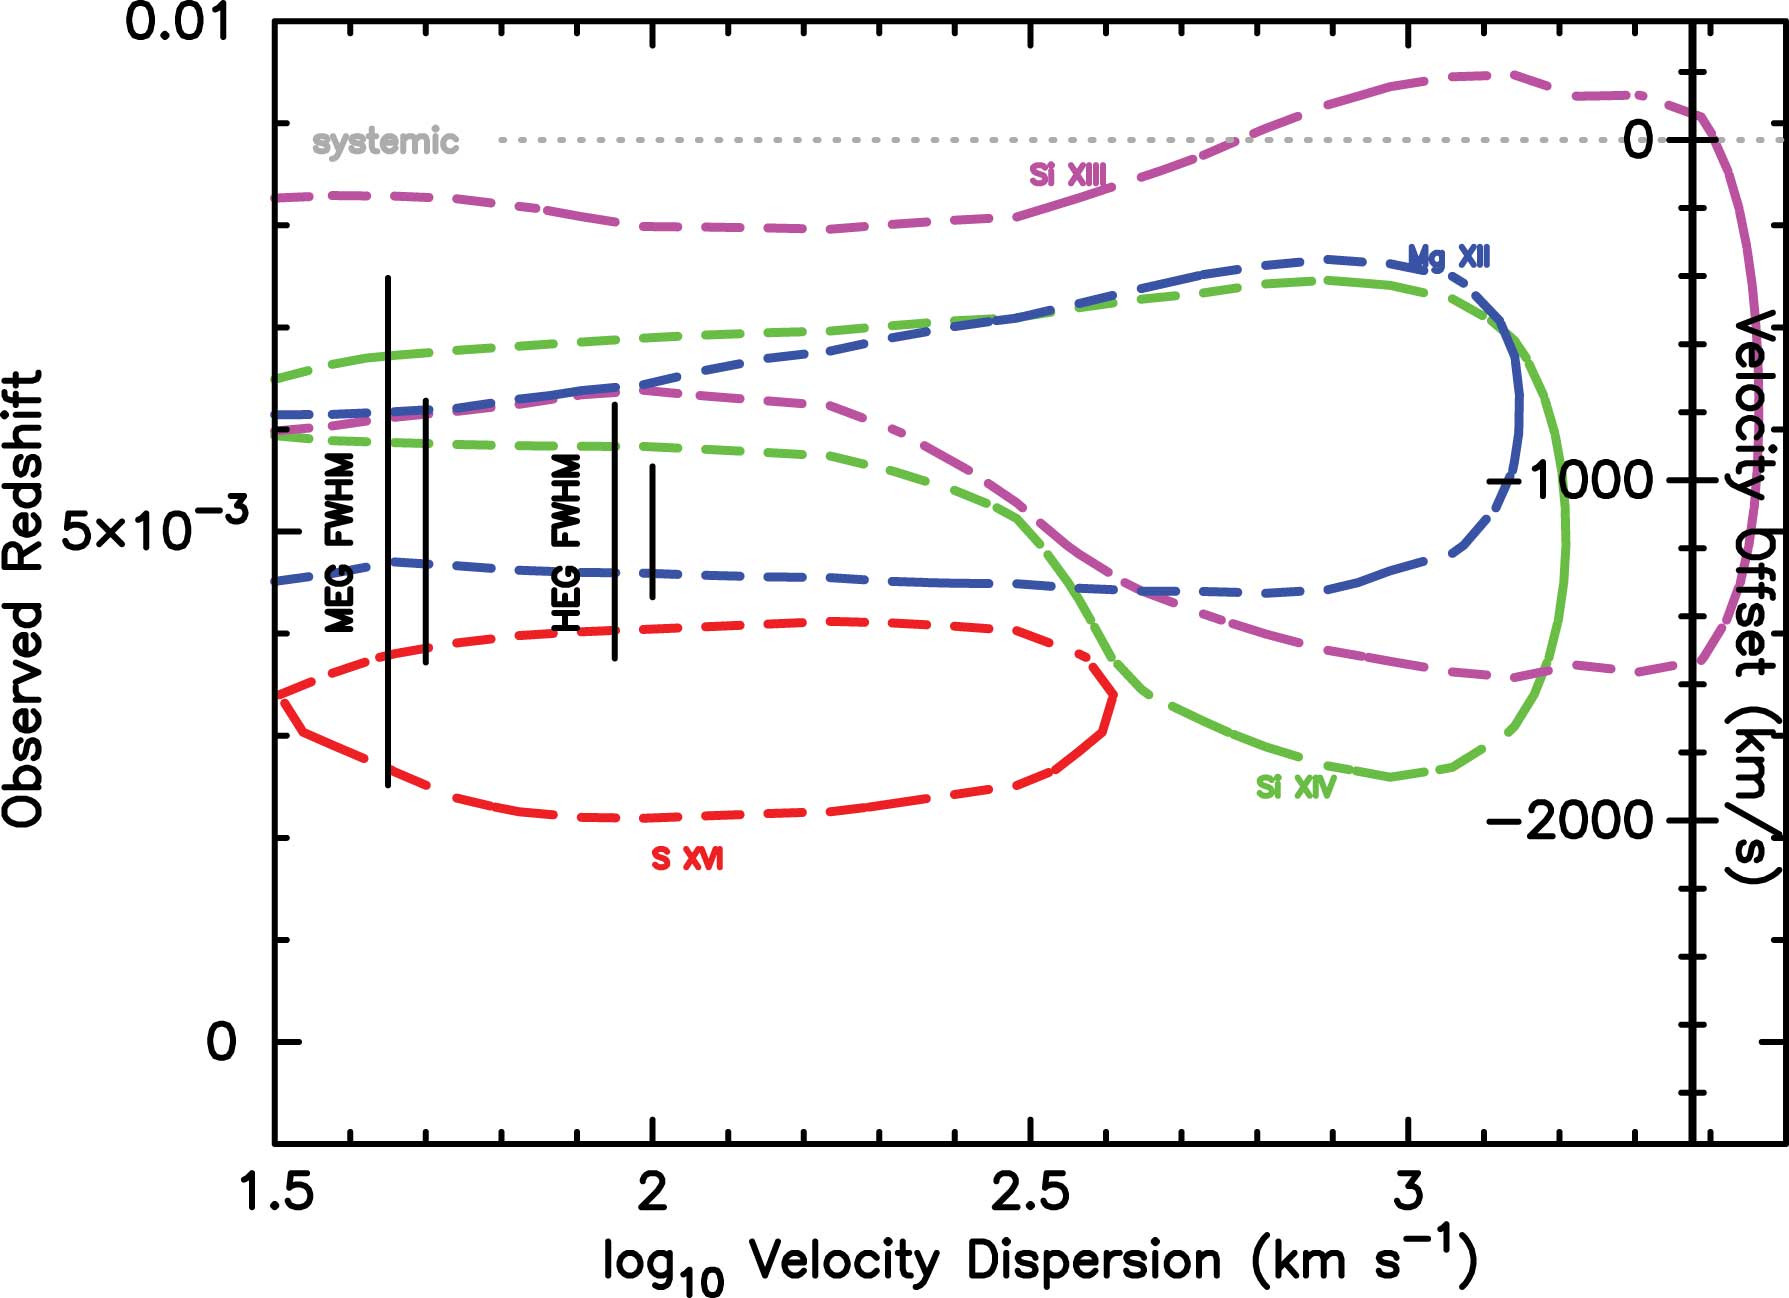
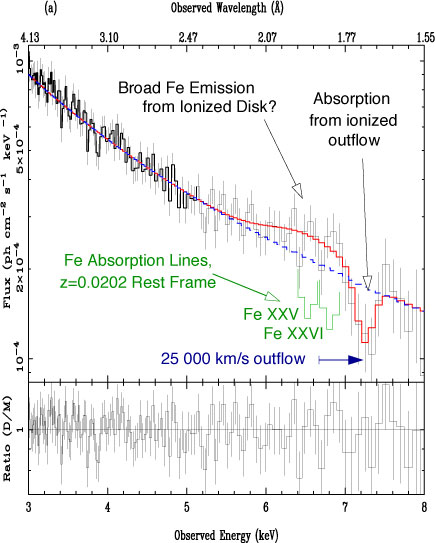
Ionized absorption lines are also seen in binary systems, e.g., the P Cygni profile seen in Cir X-1 (Newsletter Issue 8.) More recently, a 400 km/s outflowing disk wind is indicated in the HETG spectrum of the low-mass X-ray binary GX 13+1 where K absorption lines are seen from hydrogen-like Fe, Mn, Cr, Ca, Ar, S, Si, and Mg ions (Ueda et al. 2004). A somewhat higher velocity is inferred for the Seyfert 1 galaxy NGC 3516 (Turner et al. 2005.) Figure 18 shows allowed regions for several absorption lines plotted in the two parameter space of line centroid (Observed Redshift) and width (Velocity Dispersion); outflow velocities ┼1000 km/s are indicated. Finally, in the HETG spectrum of the Seyfert 2, IRAS 18325-5926, we believe we are seeing Fe absorption in a highly ionized outflow with velocity of order 25,000 km/s, or ┼ 0.1c, Figure 19. Now, that's a wind.