ACIS
ACIS DOSE Registered-Photon-Map
The steps we took to compute the dose map are;
- Level 1 Event files for a specified month are obtained from archive.
- Image data including I2, I3, S2, S3 CCDs are extracted from all event files.
- All the extracted image data were merged to create a month long exposure map for the month.
- The exposure map is opened with ds9, and check a distribution of count rates against energy. From this, estimate the upper threshold value. Any events beyond this upper threshold are assumed erroneous events such as bad pixels.
- Using this upper threshold, the data is filtered, and create a cleaned exposure map for the month.
- The exposure map from each month from the Sep 1999 is added up to create a cumulative exposure map for each month.
- Using fimgstatistic, we compute count rate statistics for each CCDs.
- For observations with high data drop rates (e.g., Crab nebula, Cas A), we corrected the observations by adding events.
Please check more detail plots at Telemetered Photon Dose Trend page.
)
)
)
Statistics:
# IMAGE     NPIX     MEAN        RMS        MIN     MAX
ACIS_may26 6004901       3.530         4.061           0.0      384


I2 node 0  262654	3.232877	2.050189	0.0	 76.0
I2 node 1  262654	3.405158	2.136471	0.0	 77.0
I2 node 2  262654	3.317874	2.062444	0.0	 98.0
I2 node 3  262654	3.321475	2.146532	0.0	225.0

I3 node 0  262654	3.978031	2.301347	0.0	 86.0
I3 node 1  262654	3.908272	2.254287	0.0	 96.0
I3 node 2  262654	3.745216	2.169739	0.0	 53.0
I3 node 3  262654	3.719002	2.193002	0.0	 97.0

S2 node 0  262654	4.606637	2.398170	0.0	 69.0
S2 node 1  262654	4.704984	2.745881	0.0	230.0
S2 node 2  262654	4.734417	2.624330	0.0	285.0
S2 node 3  262654	4.593106	2.558230	0.0	384.0

S3 node 0  262654	6.502390	2.791410	0.0	 58.0
S3 node 1  262654	7.630268	3.141364	0.0	 55.0
S3 node 2  262654	7.260662	2.844607	0.0	 36.0
S3 node 3  262654	6.361936	2.639499	0.0	 44.0
)
)
)
Statistics:
 IMAGE     NPIX      MEAN        RMS           MIN      MAX
ACIS_total   6004901       2786.856         3504.078           0.0   169725


I2 node 0  262654	2418.767074	493.054765	515.0	16372.0
I2 node 1  262654	2560.312607	723.944947	530.0	167719.0
I2 node 2  262654	2589.314166	557.168033	551.0	18288.0
I2 node 3  262654	2600.554503	686.317163	509.0	38025.0

I3 node 0  262654	2829.739944	732.267217	508.0	18320.0
I3 node 1  262654	2885.814954	1765.657592	538.0	56136.0
I3 node 2  262654	2582.247705	488.371010	504.0	15839.0
I3 node 3  262654	2552.540553	523.042698	487.0	38734.0

S2 node 0  262654	3245.383498	525.819006	1745.0	22724.0
S2 node 1  262654	3449.427568	791.287693	1919.0	23416.0
S2 node 2  262654	3828.245378	797.643458	2335.0	34661.0
S2 node 3  262654	3783.708253	659.736139	2050.0	90902.0

S3 node 0  262654	5766.490215	3174.403355	2525.0	56898.0
S3 node 1  262654	6964.714955	2420.521724	0.0	83602.0
S3 node 2  262654	5701.404358	1401.612686	2689.0	27896.0
S3 node 3  262654	4489.025354	800.448477	2695.0	26993.0
)
|
)
|
)
|
)
|
| Feb 2026 | Nov 2025 | Aug 2025 | May 2025 |
|---|
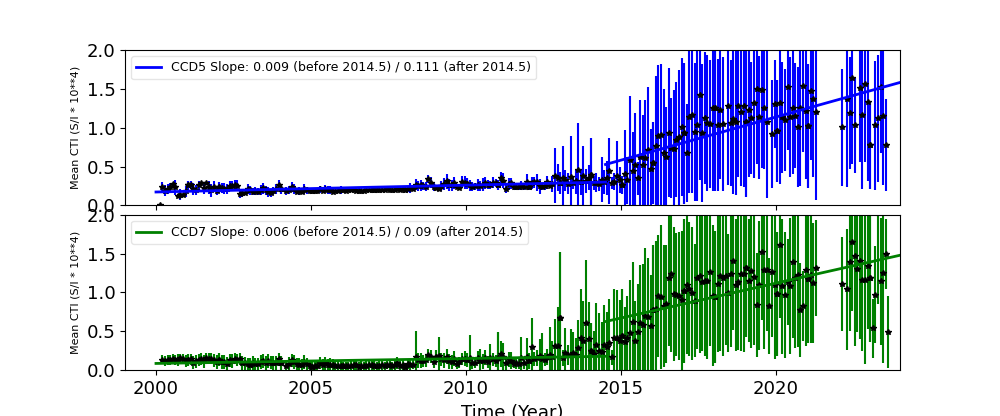
The Mean Detrended CTI
We report CTIs with a refined data definition. CTIs were computed for the temperature dependency corrected data. Please see CTI page for detailed explanation. CTI's are computed for Mn K alpha, and defined as slope/intercept x10^4 of row # vs ADU. Data file: here
Imaging CCDs
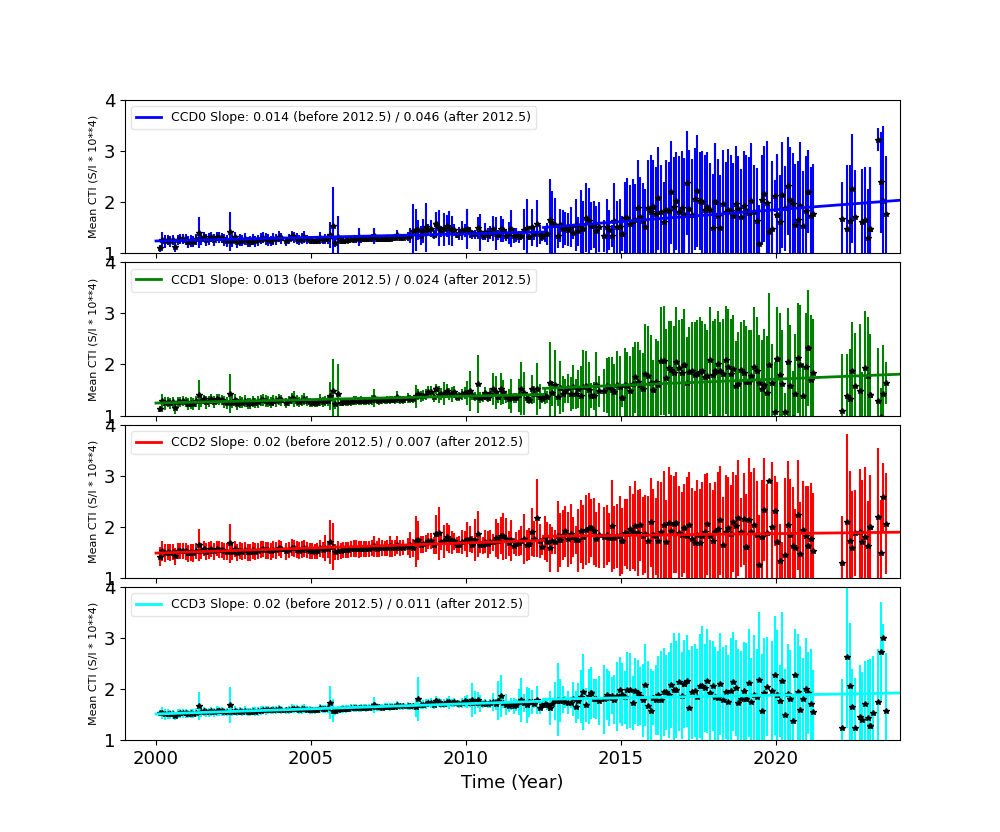
Spectral CCDs
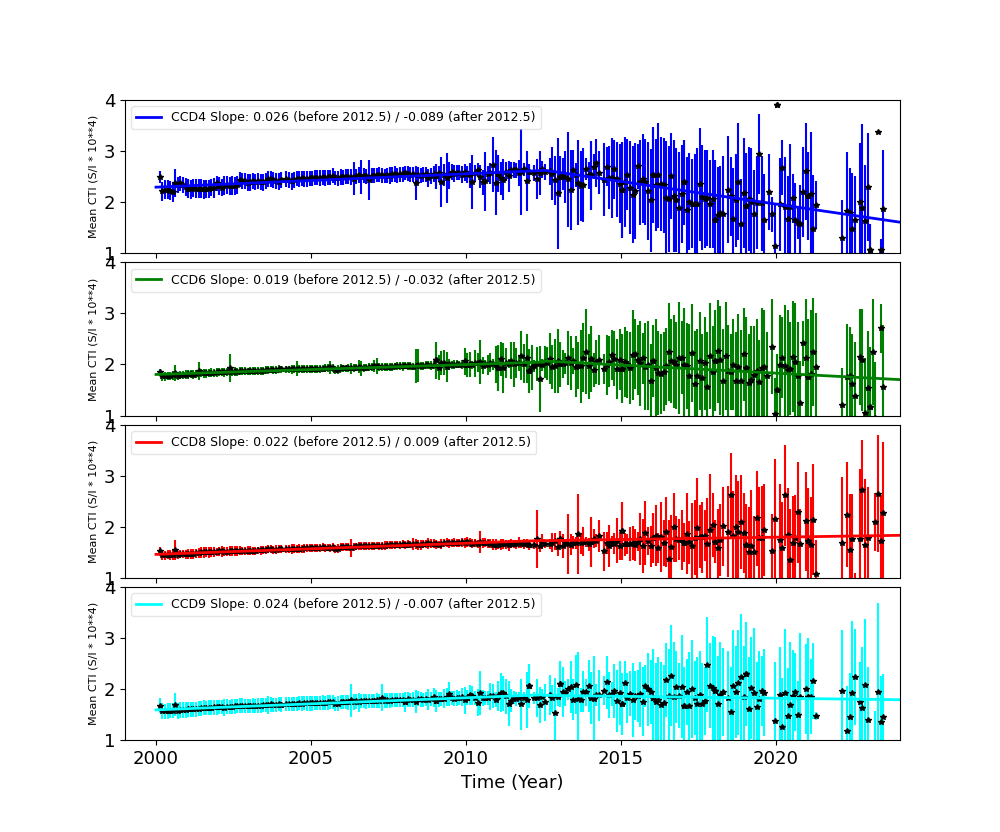
Backside CCDs
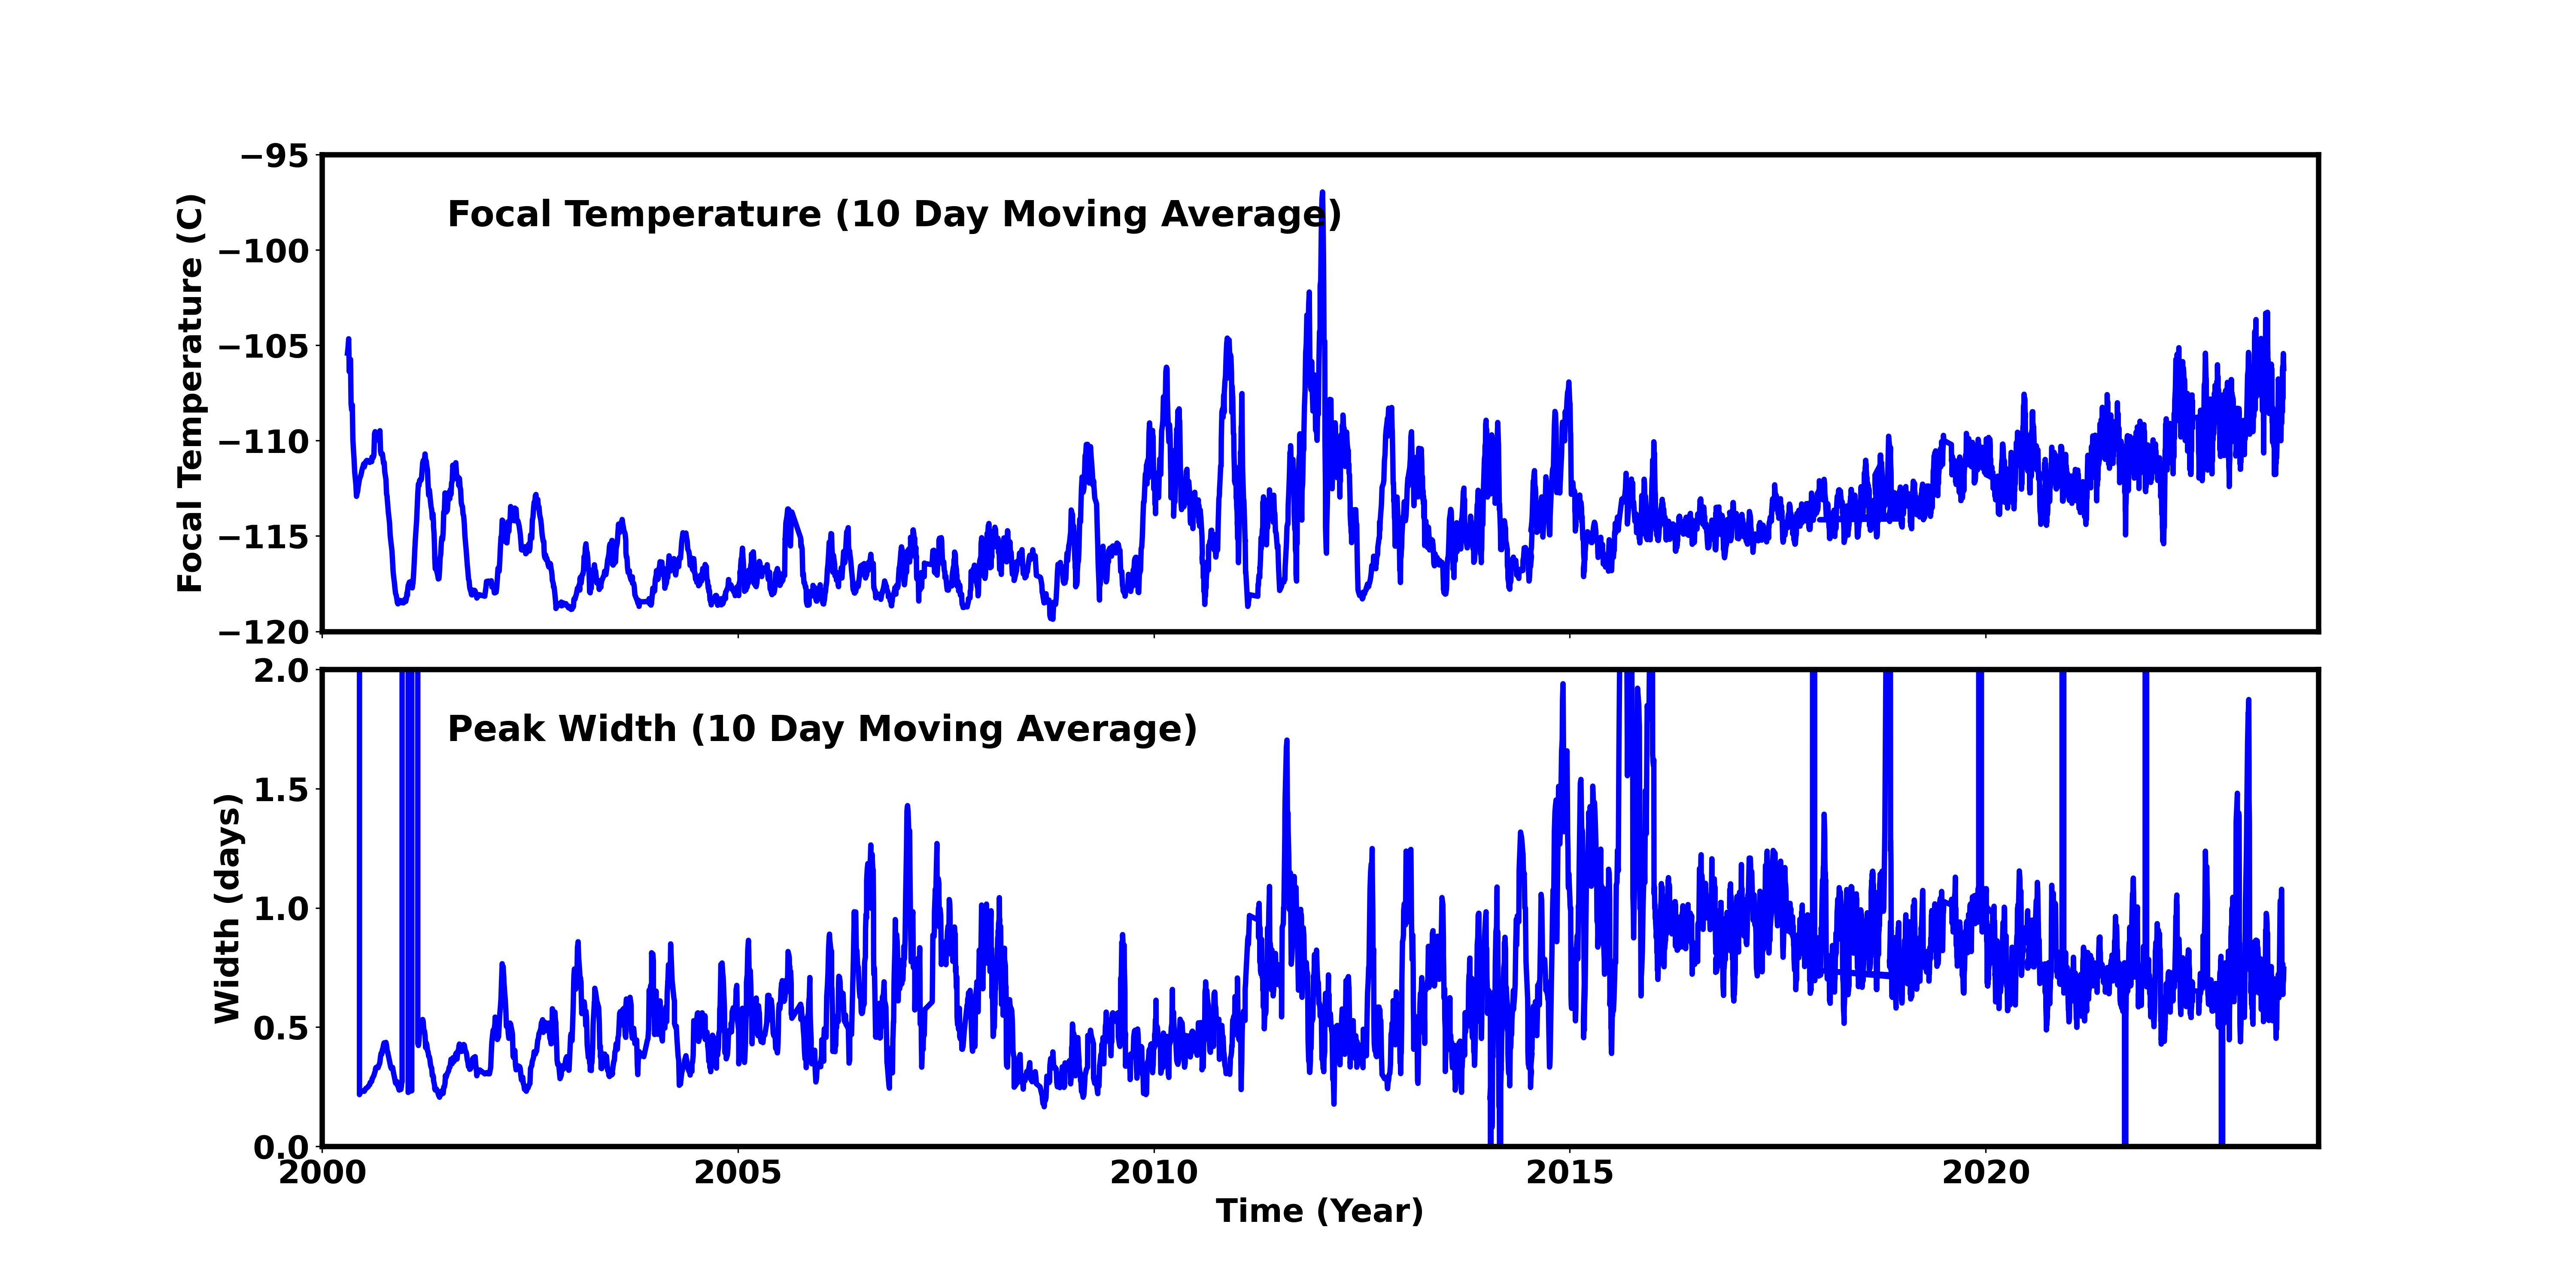
Focal Plane Temperature
May 2026 Focal Temperature
| The Mean (max) FPT: | |
|---|---|
| -107.53 | +/- 7.69 C |
| Mean Width: | |
| 0.8 | +/- 0.58 days |
Averaged Focal Plane Temperature
We are using 10 period moving averages to show trends of peak temperatures and peak widths. Note, the gaps in the width plot are due to missing/corrupted data.
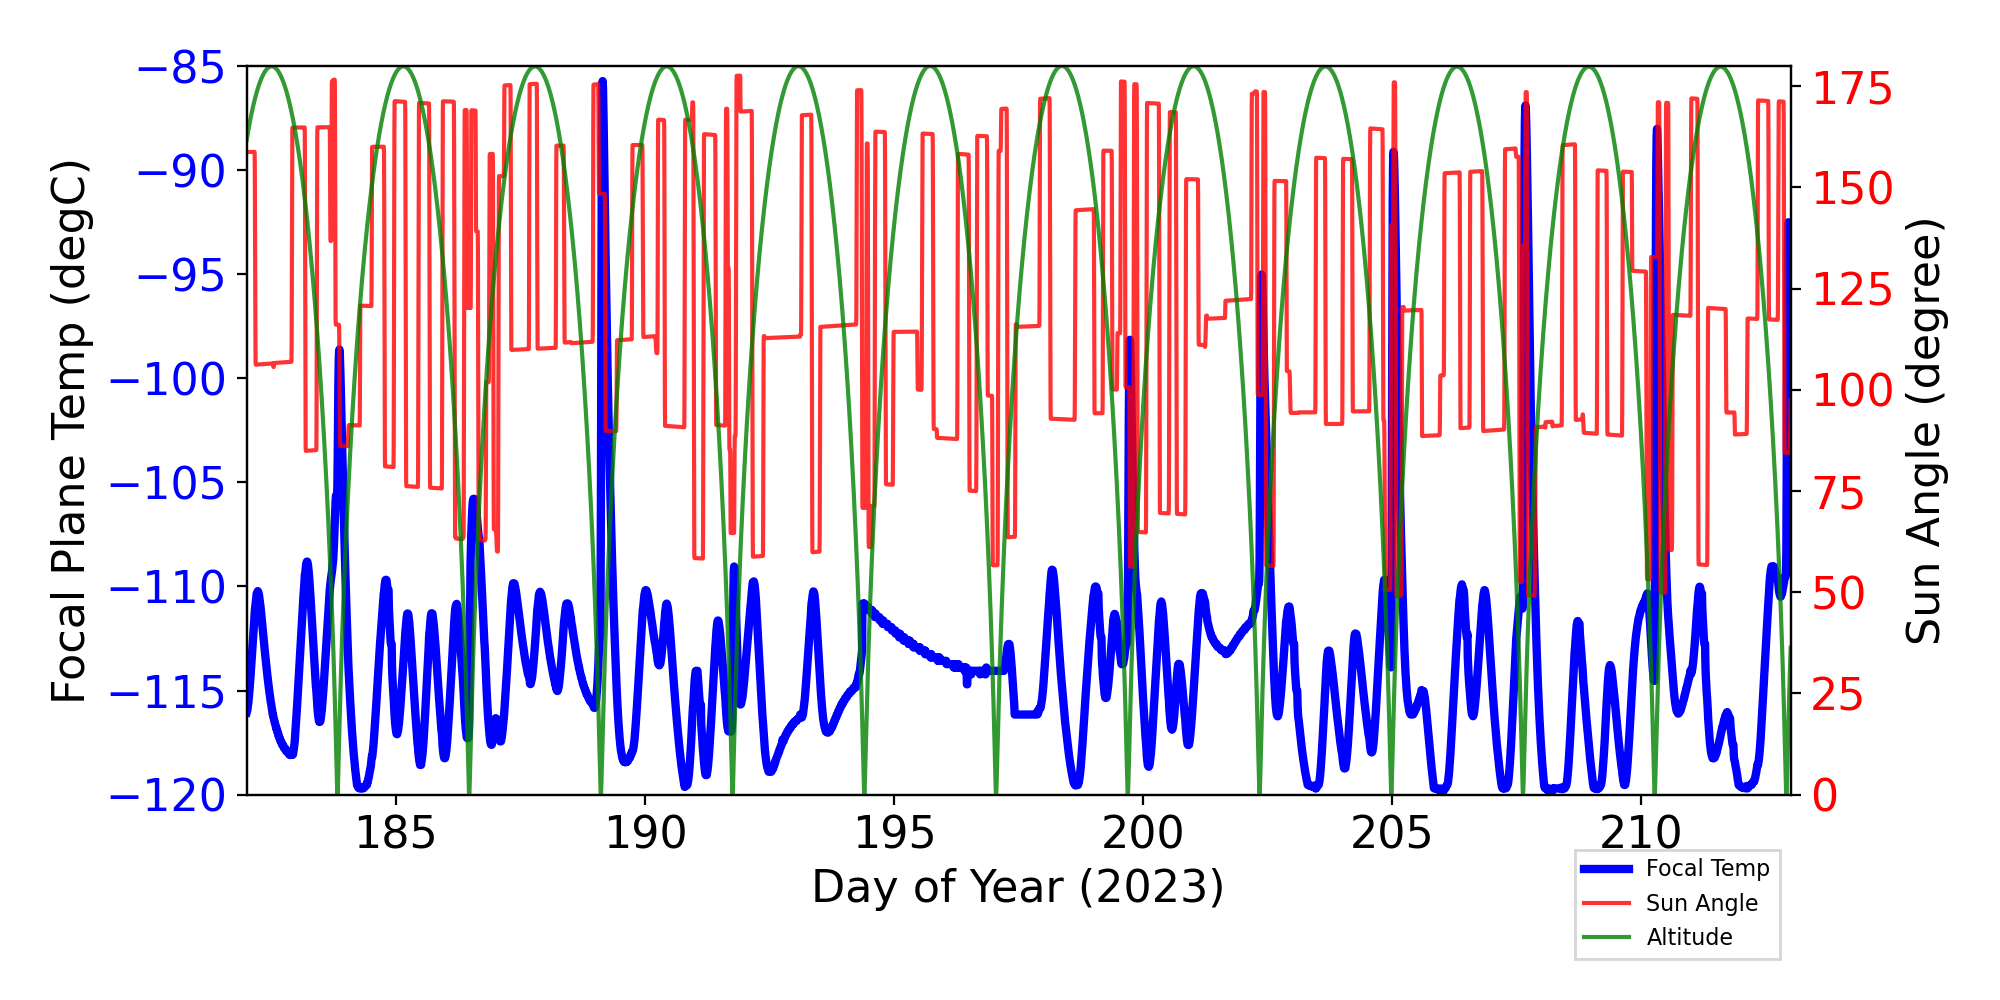
Focal Plane Temperature, Sun Angle and Altitude
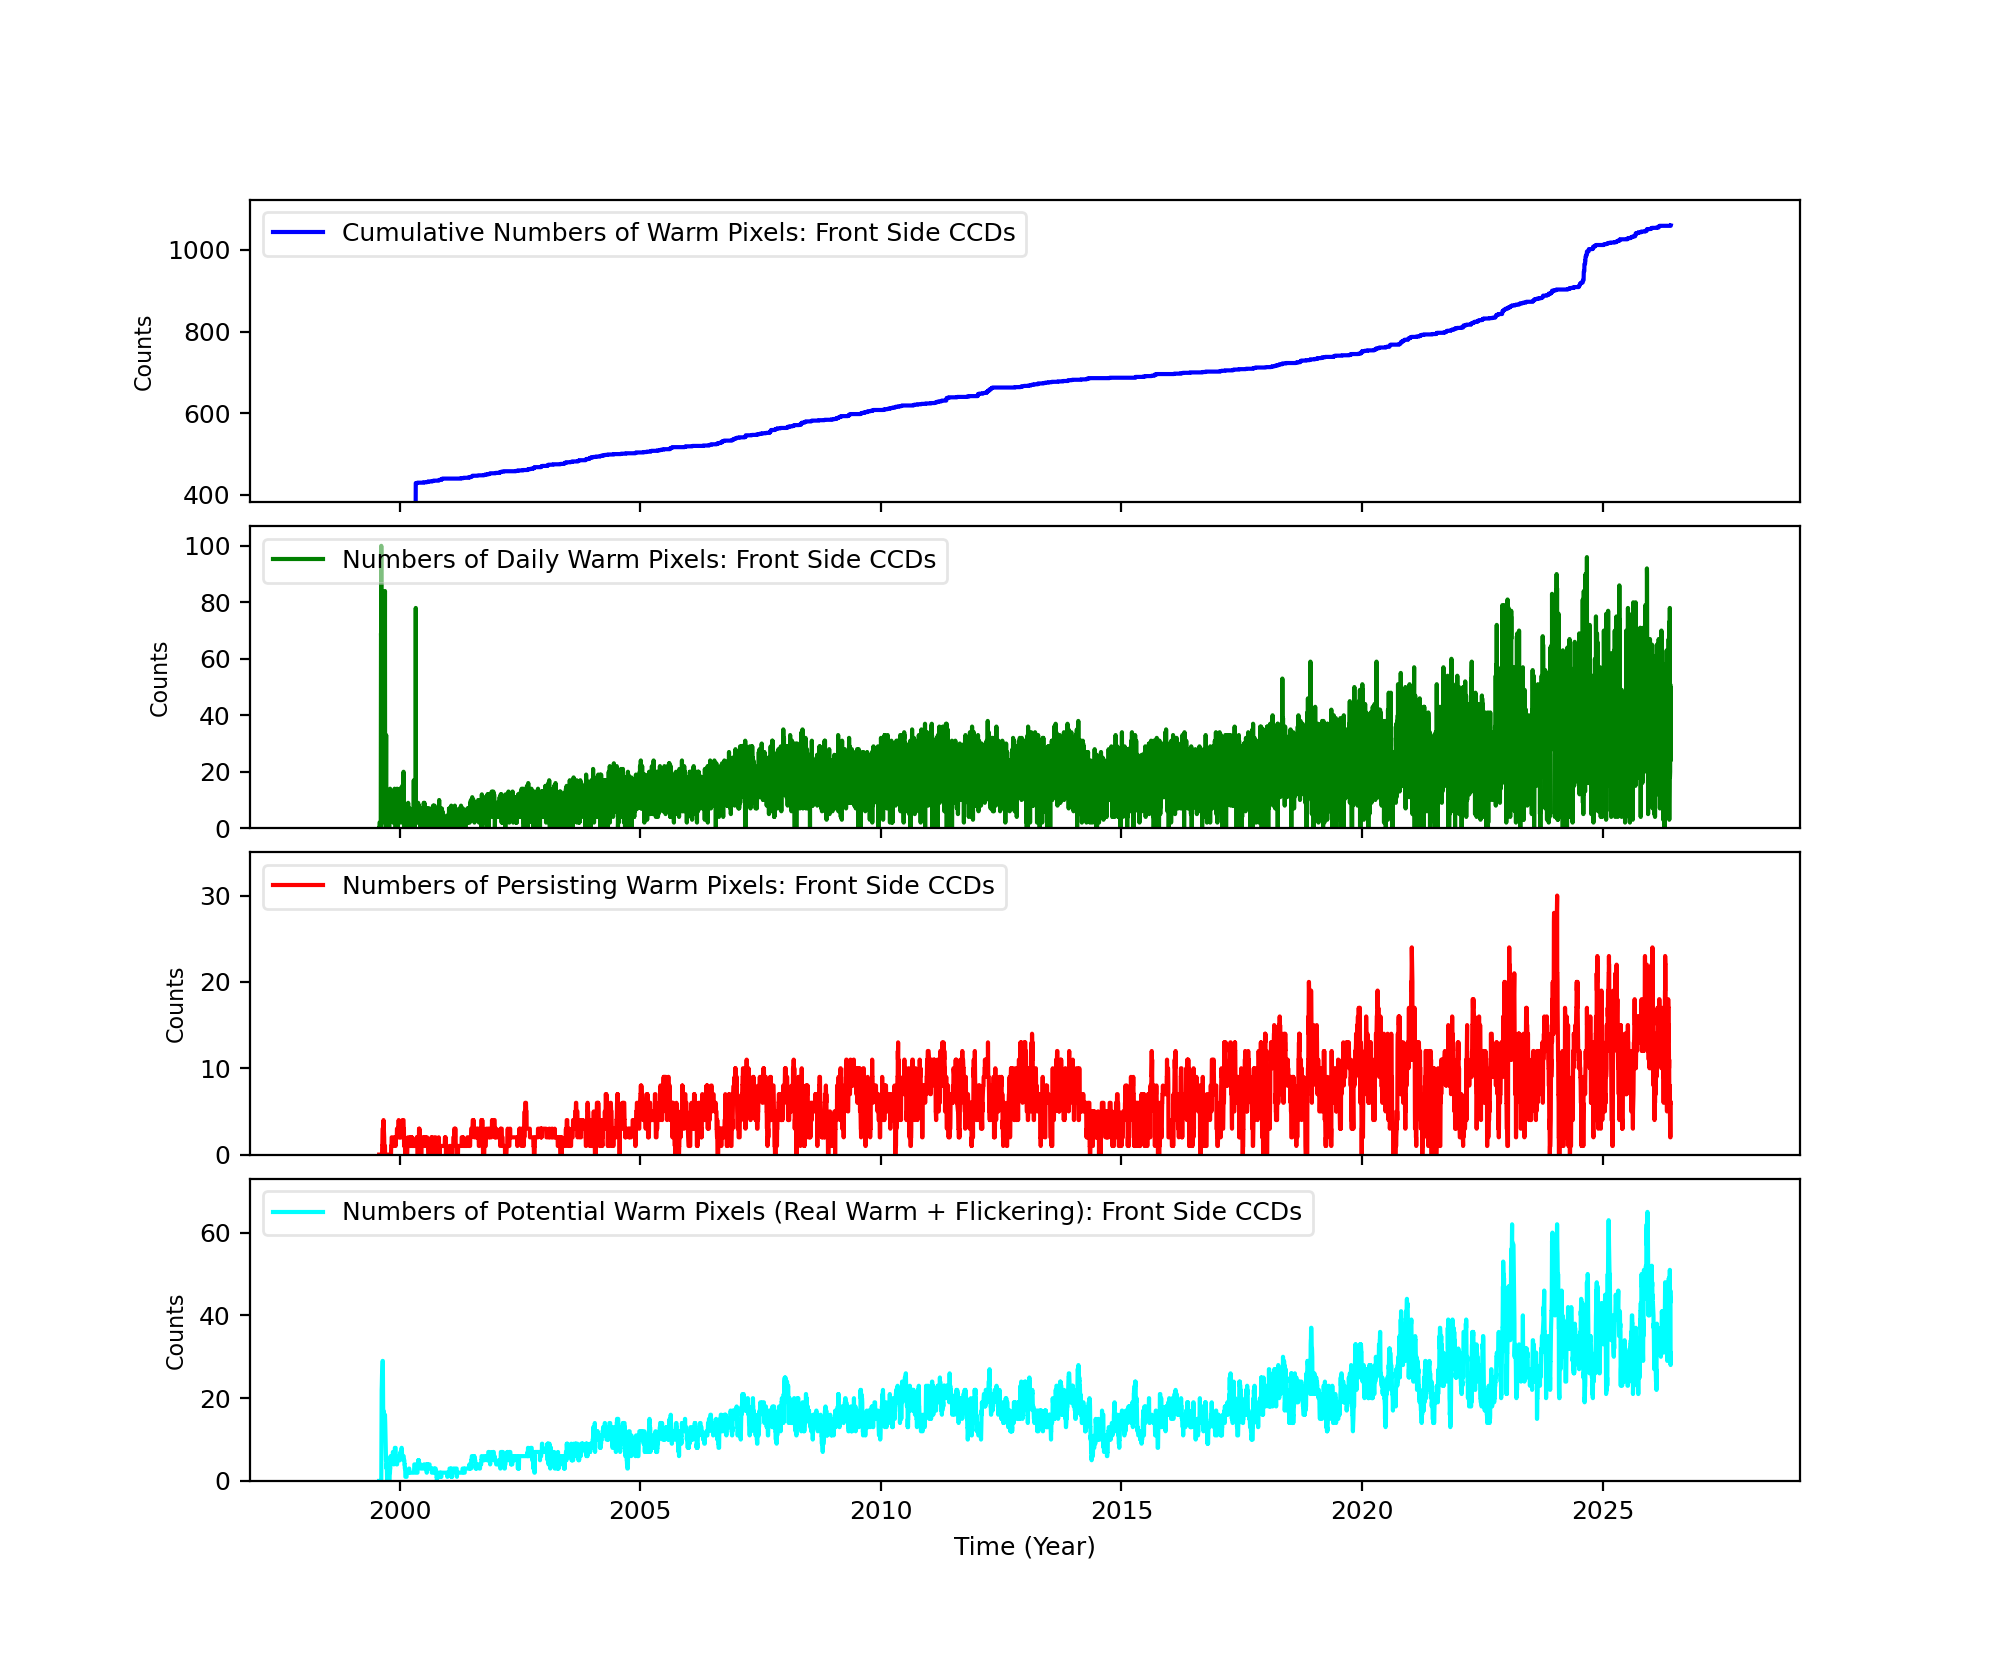
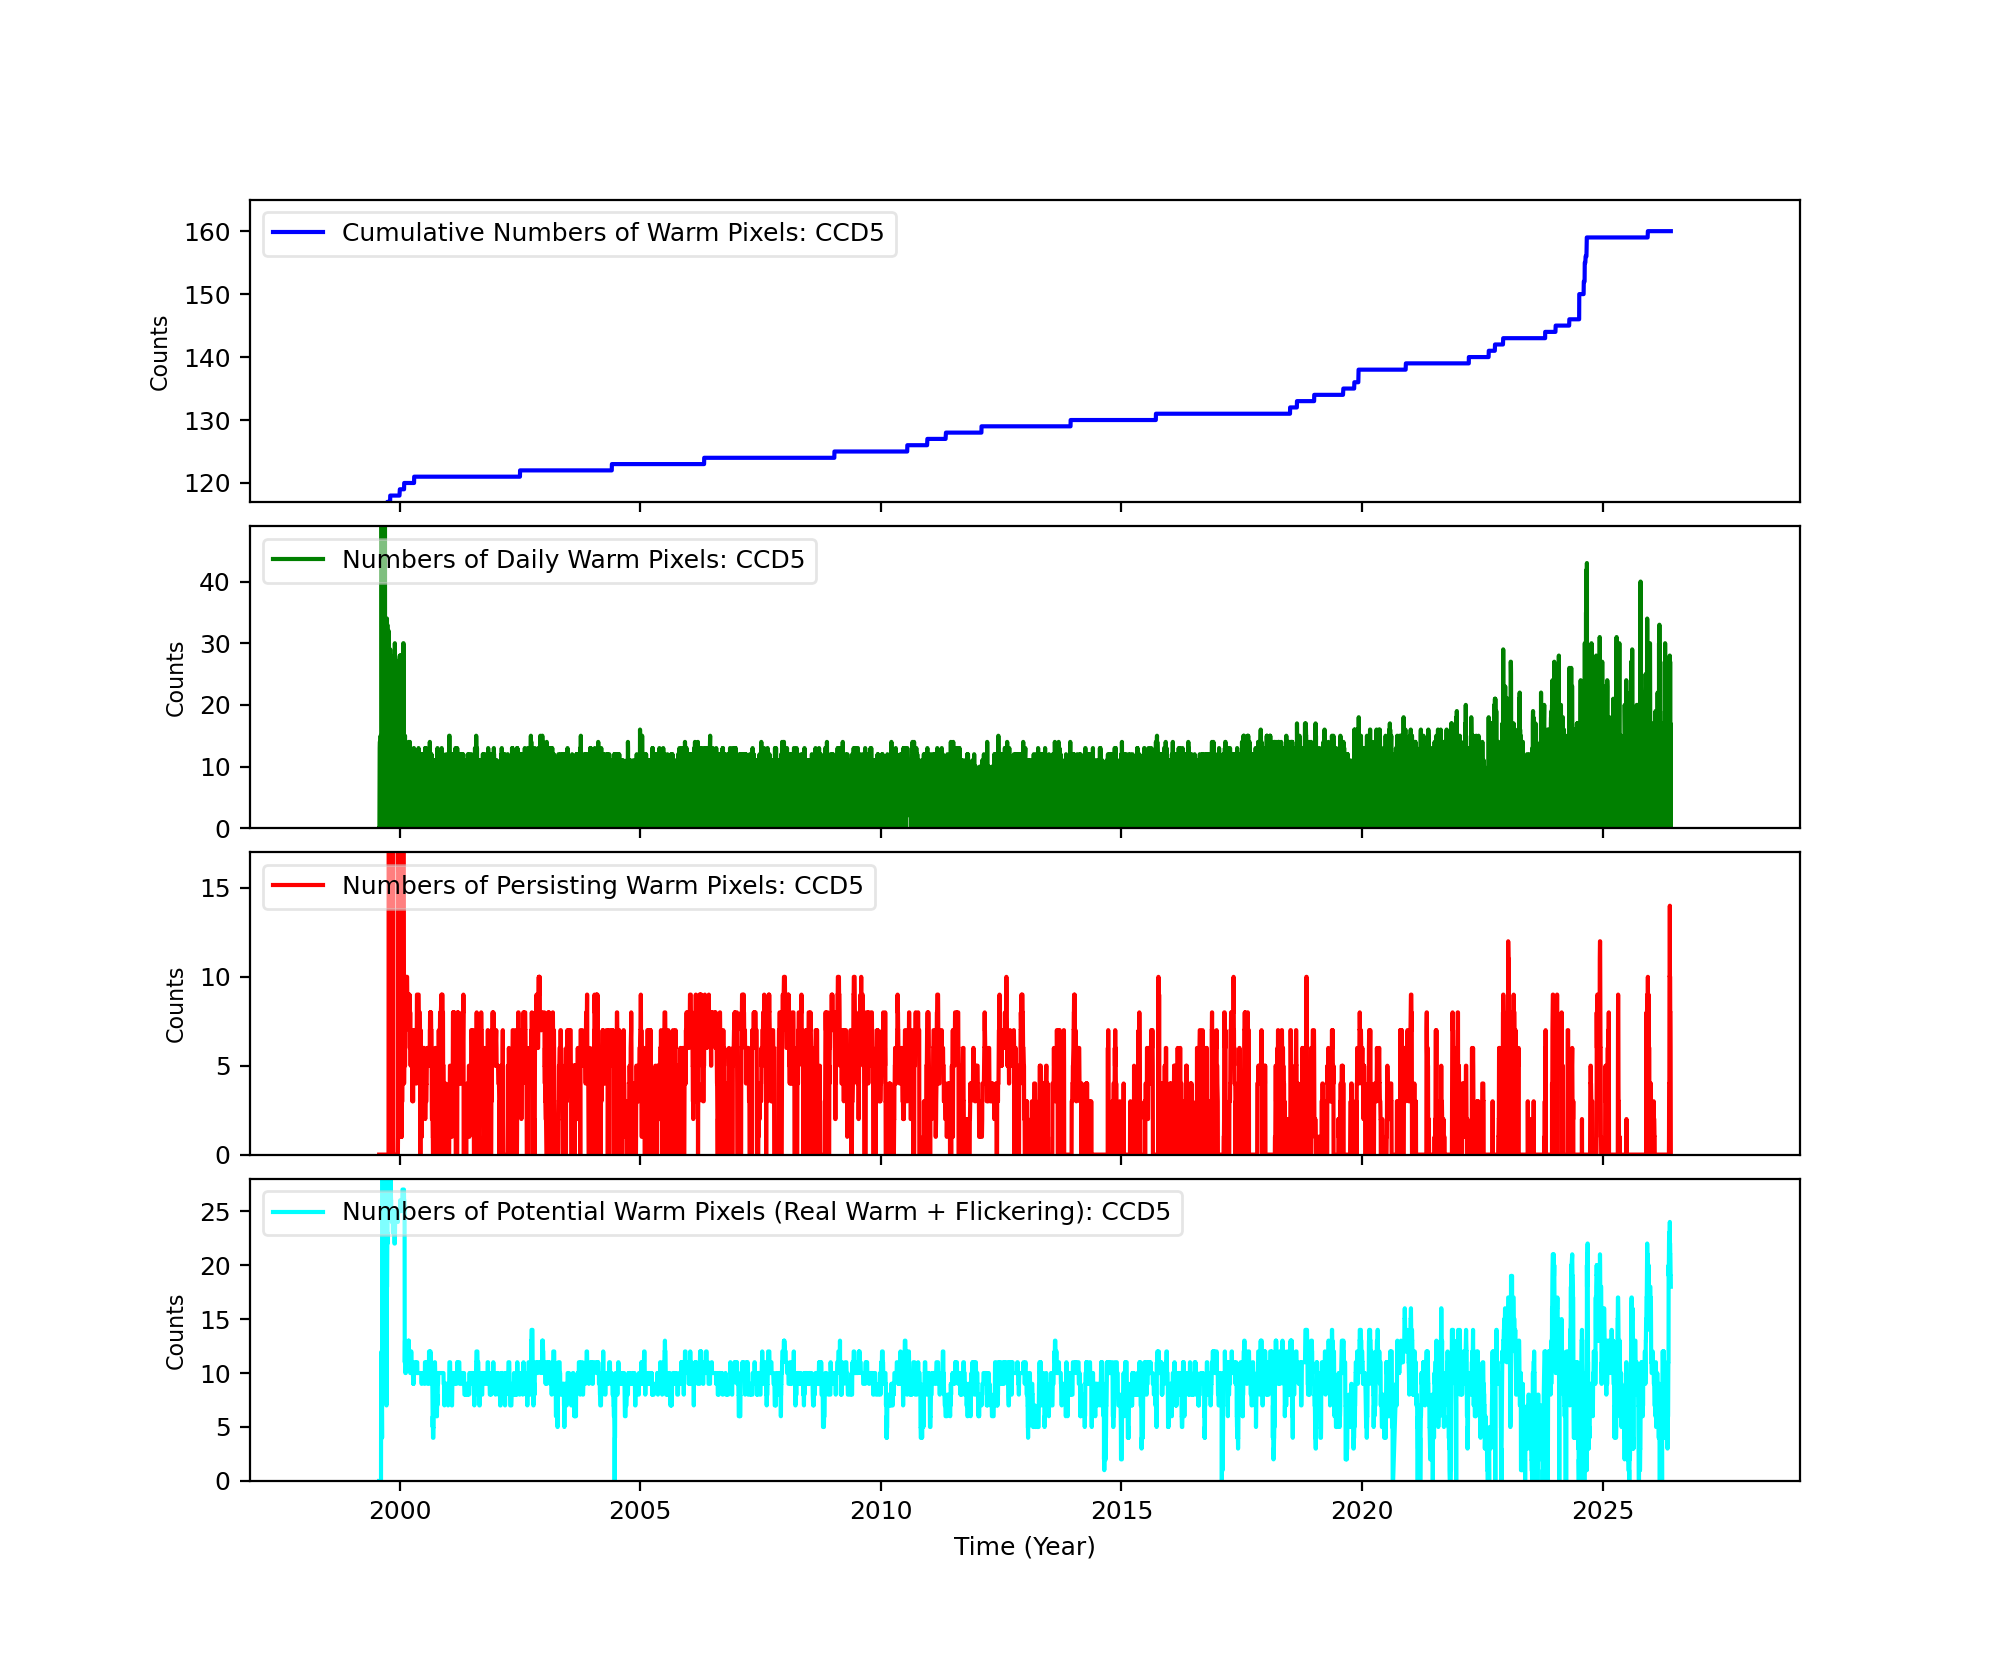
Bad Pixels
The plots below were generated with a new warm pixel finding script. Please see Acis Bad Pixel Page for details.
Front Side CCDs
Back Side CCD (CCD5)
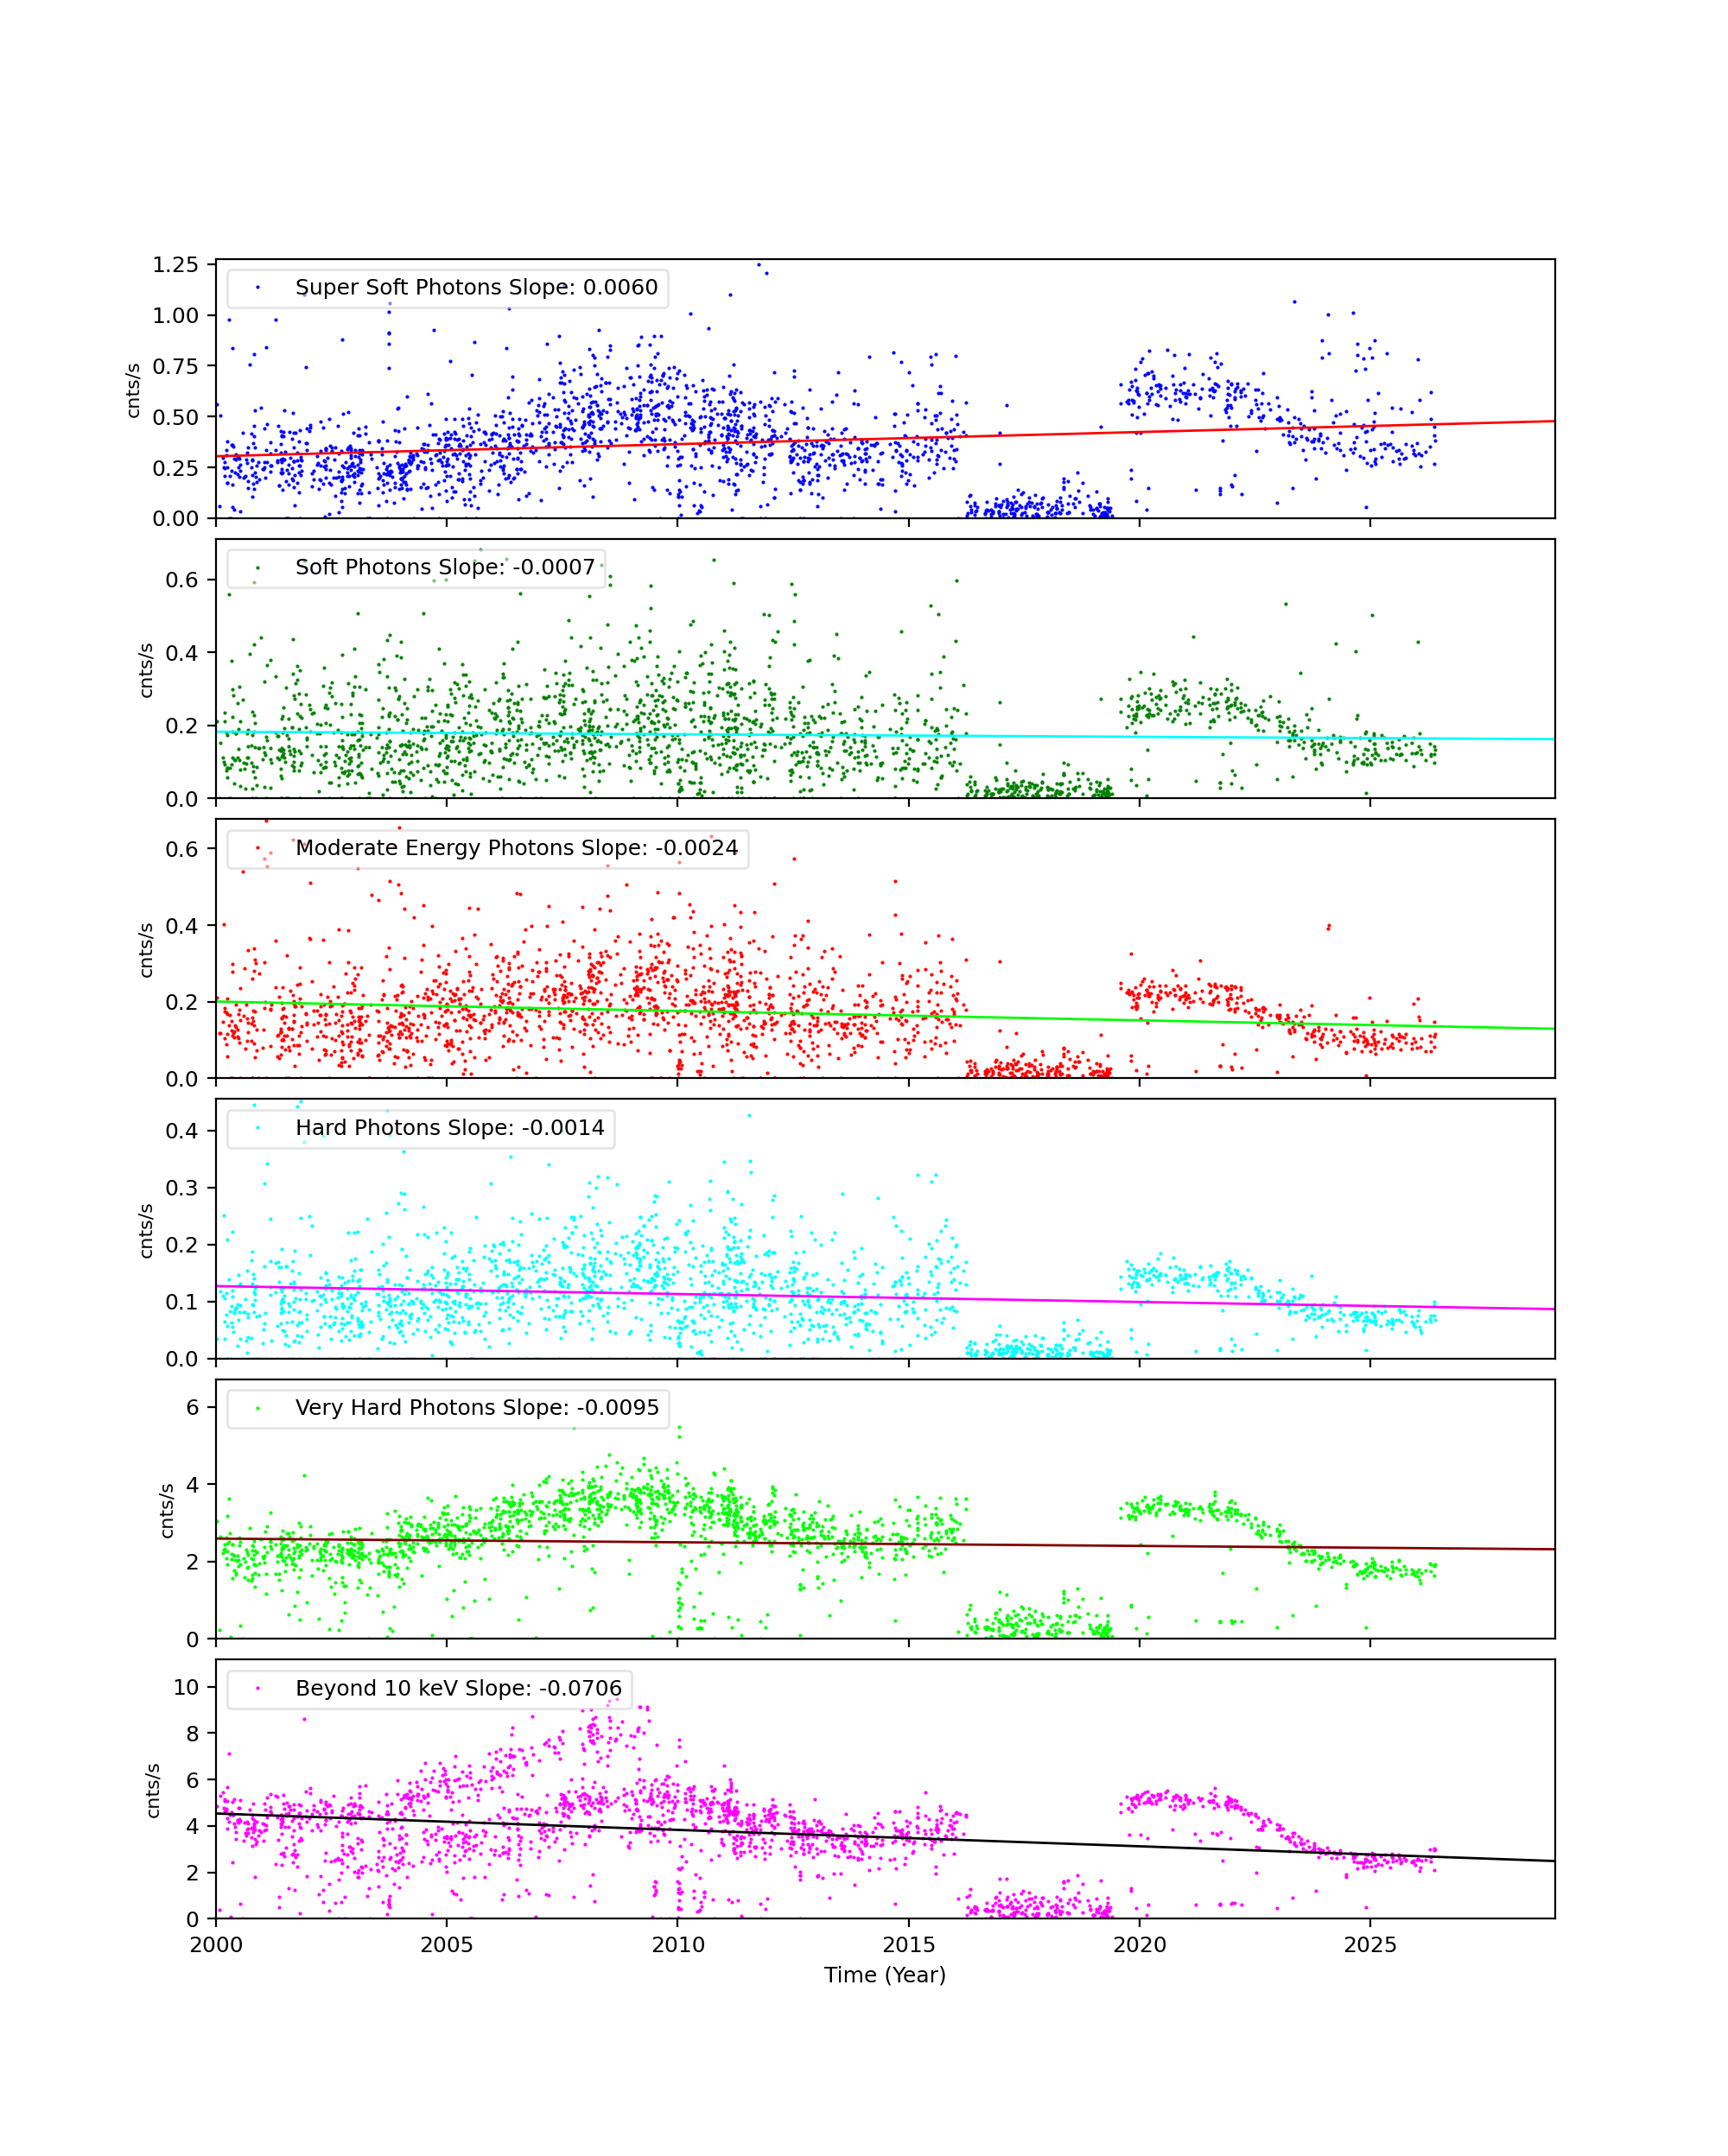
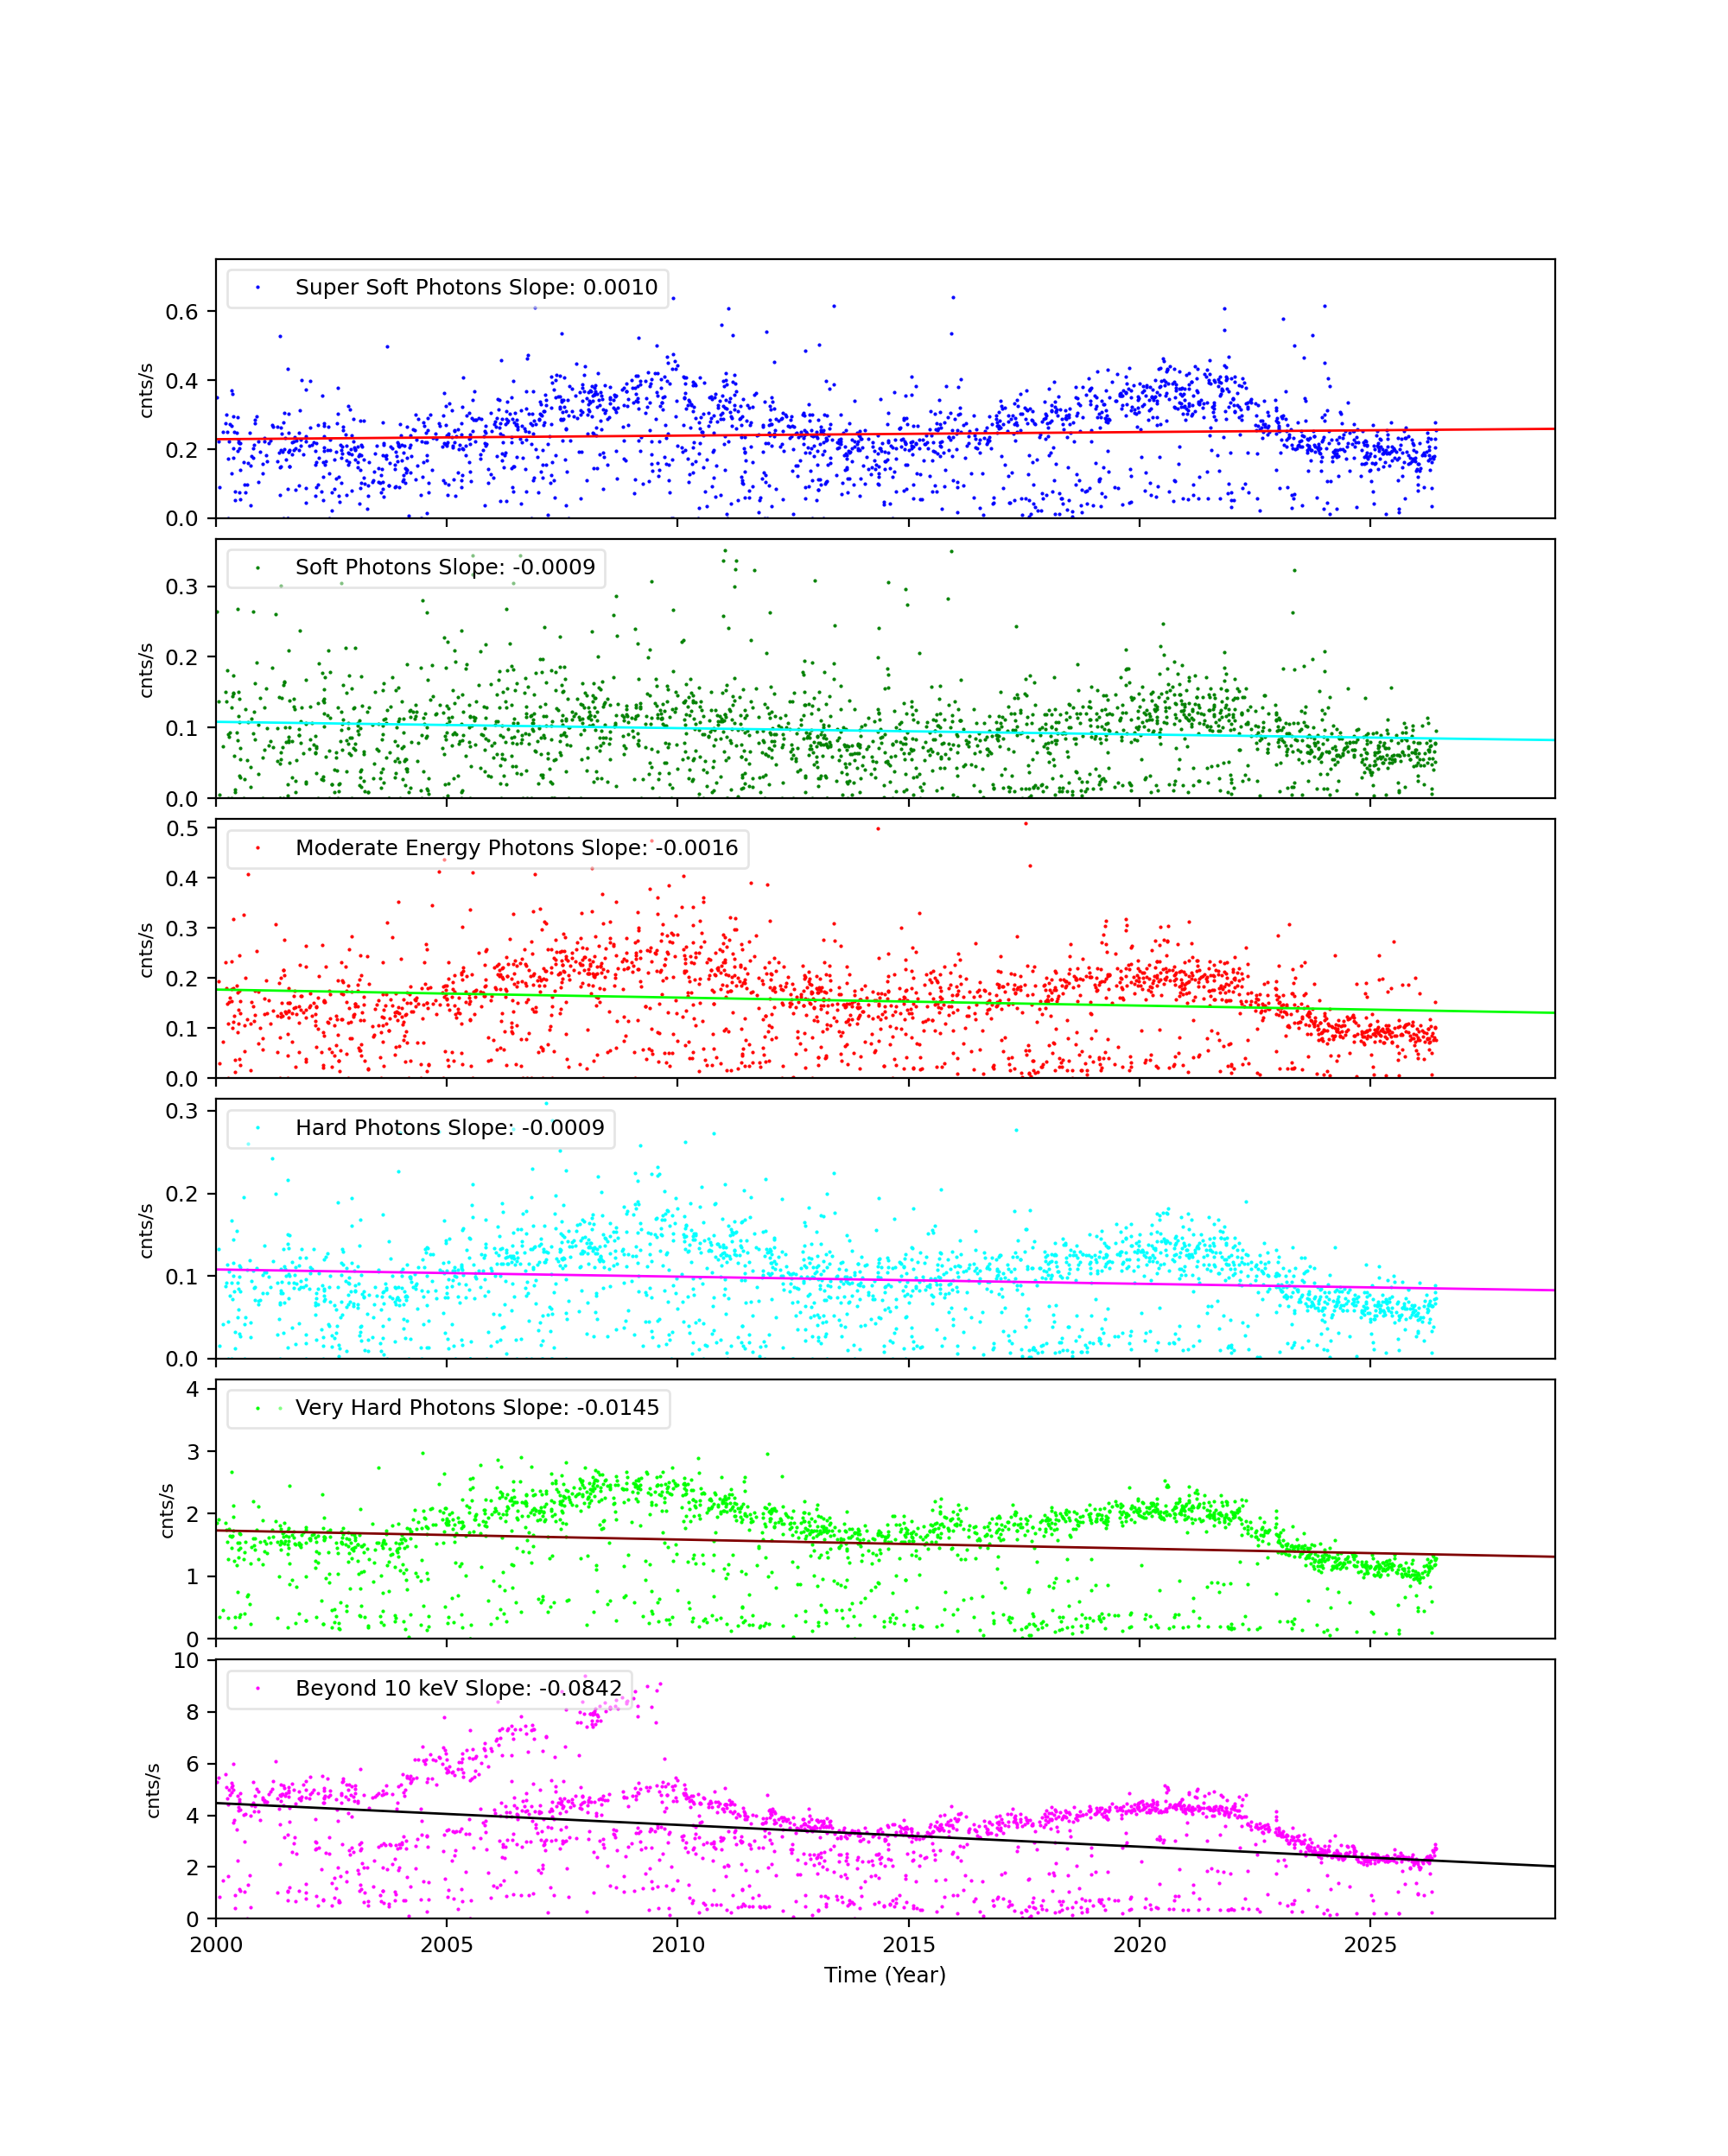
Science Instrument Background Rates
| Name | Low (keV) | High(KeV) | Description |
|---|---|---|---|
| SSoft | 0.00 | 0.50 | Super soft photons |
| Soft | 0.50 | 1.00 | Soft photons |
| Med | 1.00 | 3.00 | Moderate energy photons |
| Hard | 3.00 | 5.00 | Hard Photons |
| Harder | 5.00 | 10.00 | Very Hard photons |
| Hardest | 10.00 | Beyond 10 keV |


The following three plots show trends of SIB from year 2000. CCDs shown here are CCD3, CCD5, and CCD7. Fitted lines are linear fit after eliminating extreme outliers. For >10 keV plots, 2 lines are fit. One is with a 13 keV filter, and another without.
CCD 3
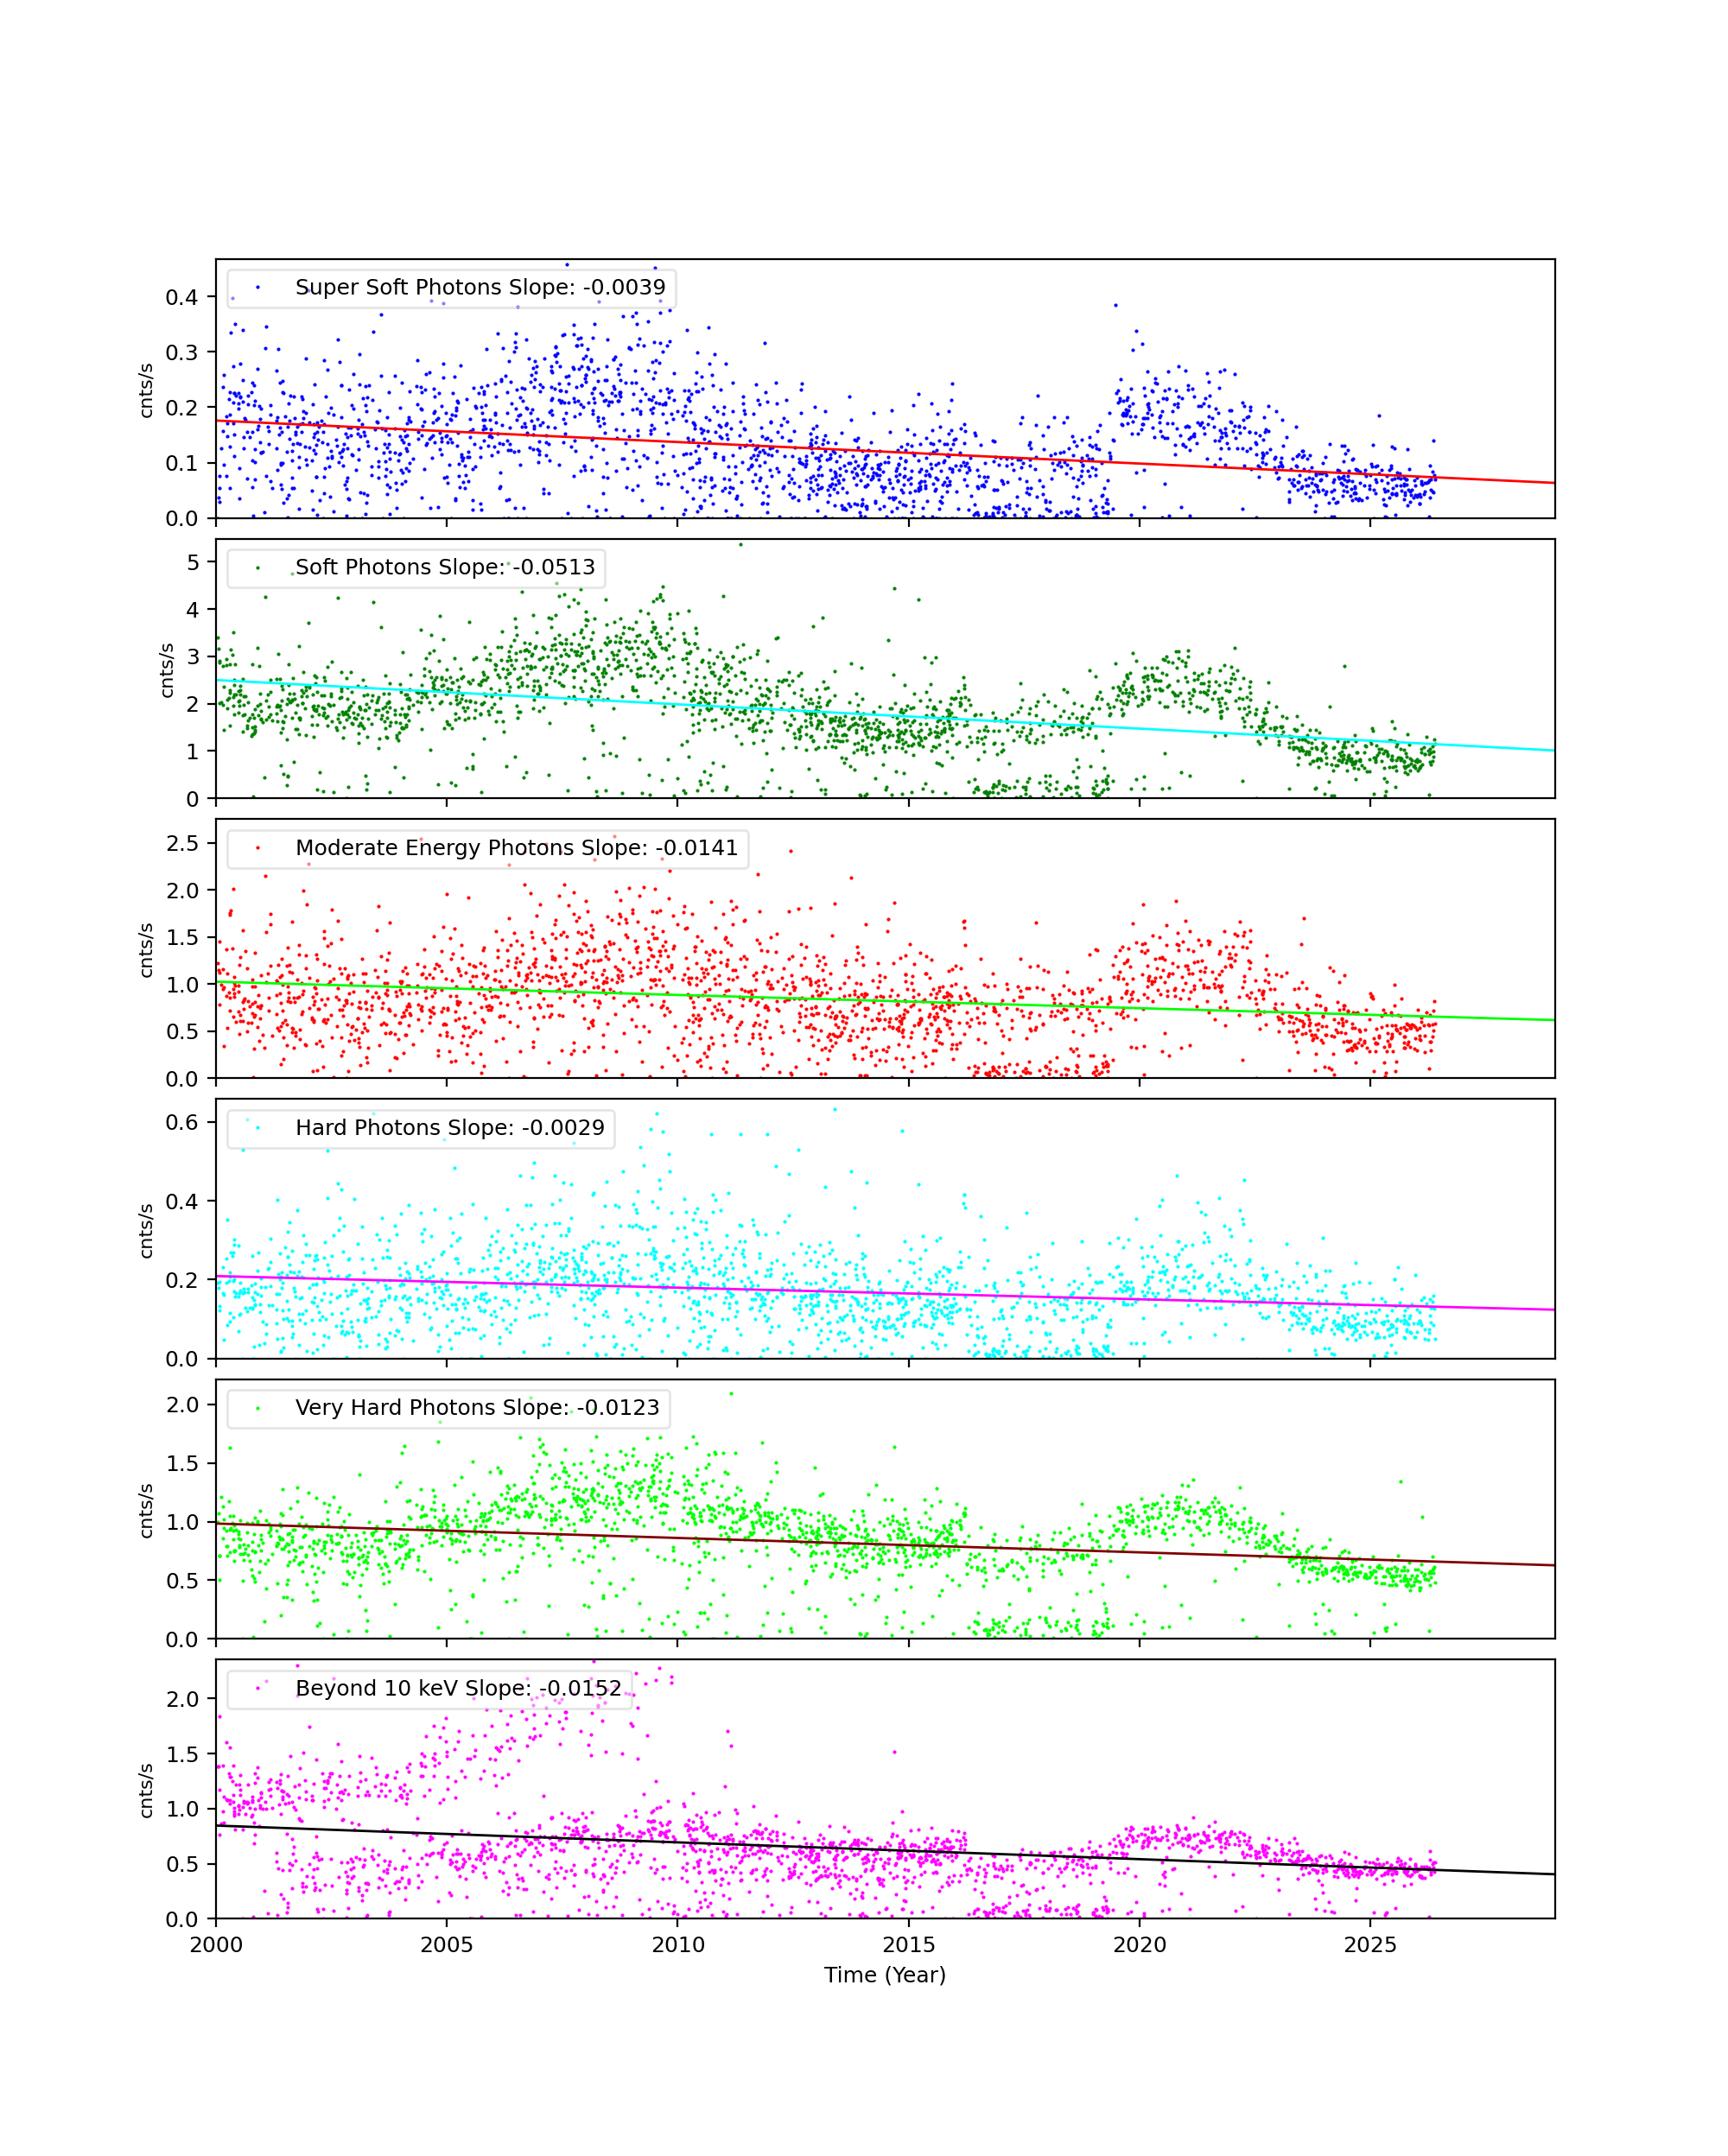
CCD 5
CCD 7
ACIS Histogram Mode Trends
We collected data from acis histogram mode data, and created trend plots of peak portions and peak widths against time (DOM). The peaks were estimated by fitting a simple Gaussian on three peaks (Al, Ti, and Mn), and the widths were estimated by a width at the half max from the peak.
All histogram data are taken under TIMED and GRADED_HIST mode, SIM position is at an external calibration source position, the focal temperature is around -119.7 C, and parameter settings in aciselec, acistemp are set to about same for all.
CCD 3, Peak Position
CCD 3, Peak Widths
CCD 3, Count Rates
HRC
DOSE of Central 4K Pore-Pairs
Please refer to Maximum Dose Trends for more details.
)
|
|---|
IMAGE                NPIX      MEAN    STDDEV      MIN       MAX
HRCI_05_2026.fits  16777216	0.011 	0.105 	0.000 	3.000
)
IMAGE                       NPIX      MEAN    STDDEV      MIN       MAX
HRCI_08_1999_05_2026.fits  16777216	na	na	na	na
No Data
)
IMAGE                       NPIX      MEAN    STDDEV      MIN       MAX
HRCS_08_1999_05_2026.fits  16777216	na	na	na	na
|
|
Max dose trend plots corrected for events that "pile-up"
in the center of the taps due to bad position information.
|
)
|
)
|
)
|
)
|
| Feb 2026 | Nov 2025 | Aug 2025 | May 2025 |
|---|
)
|
)
|
)
|
)
|
| Feb 2026 | Nov 2025 | Aug 2025 | May 2025 |
|---|
Gratings
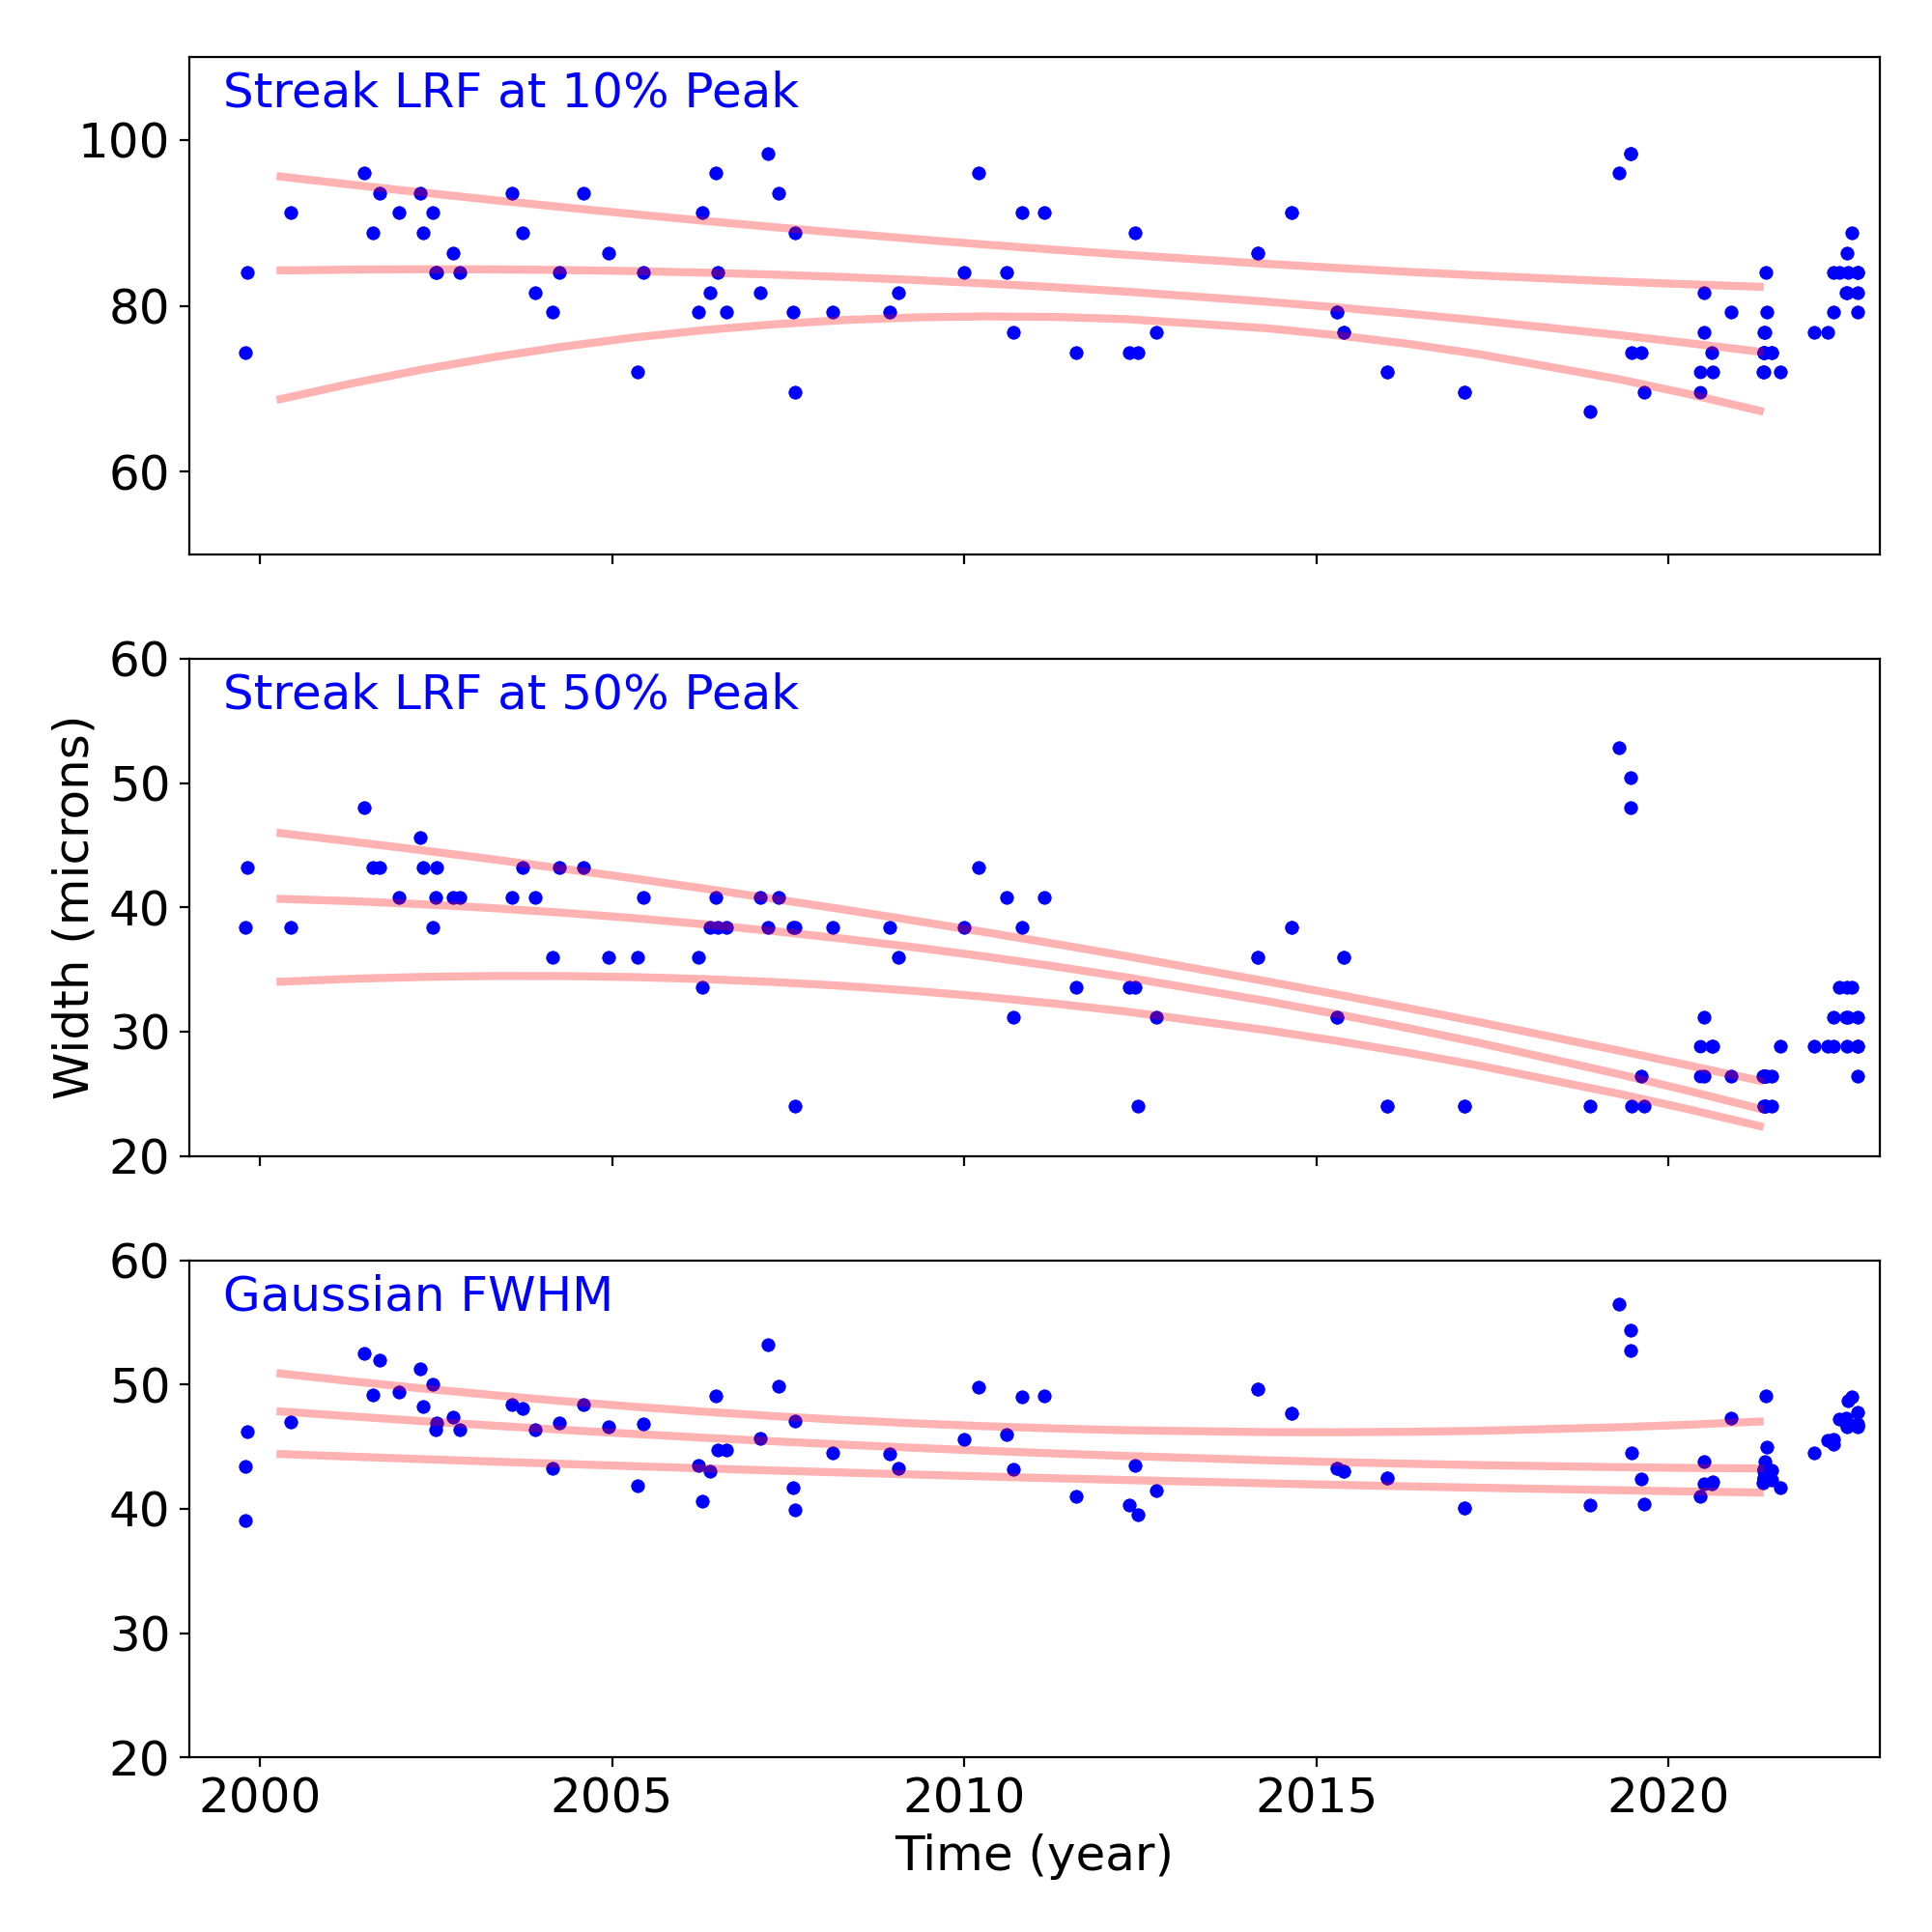
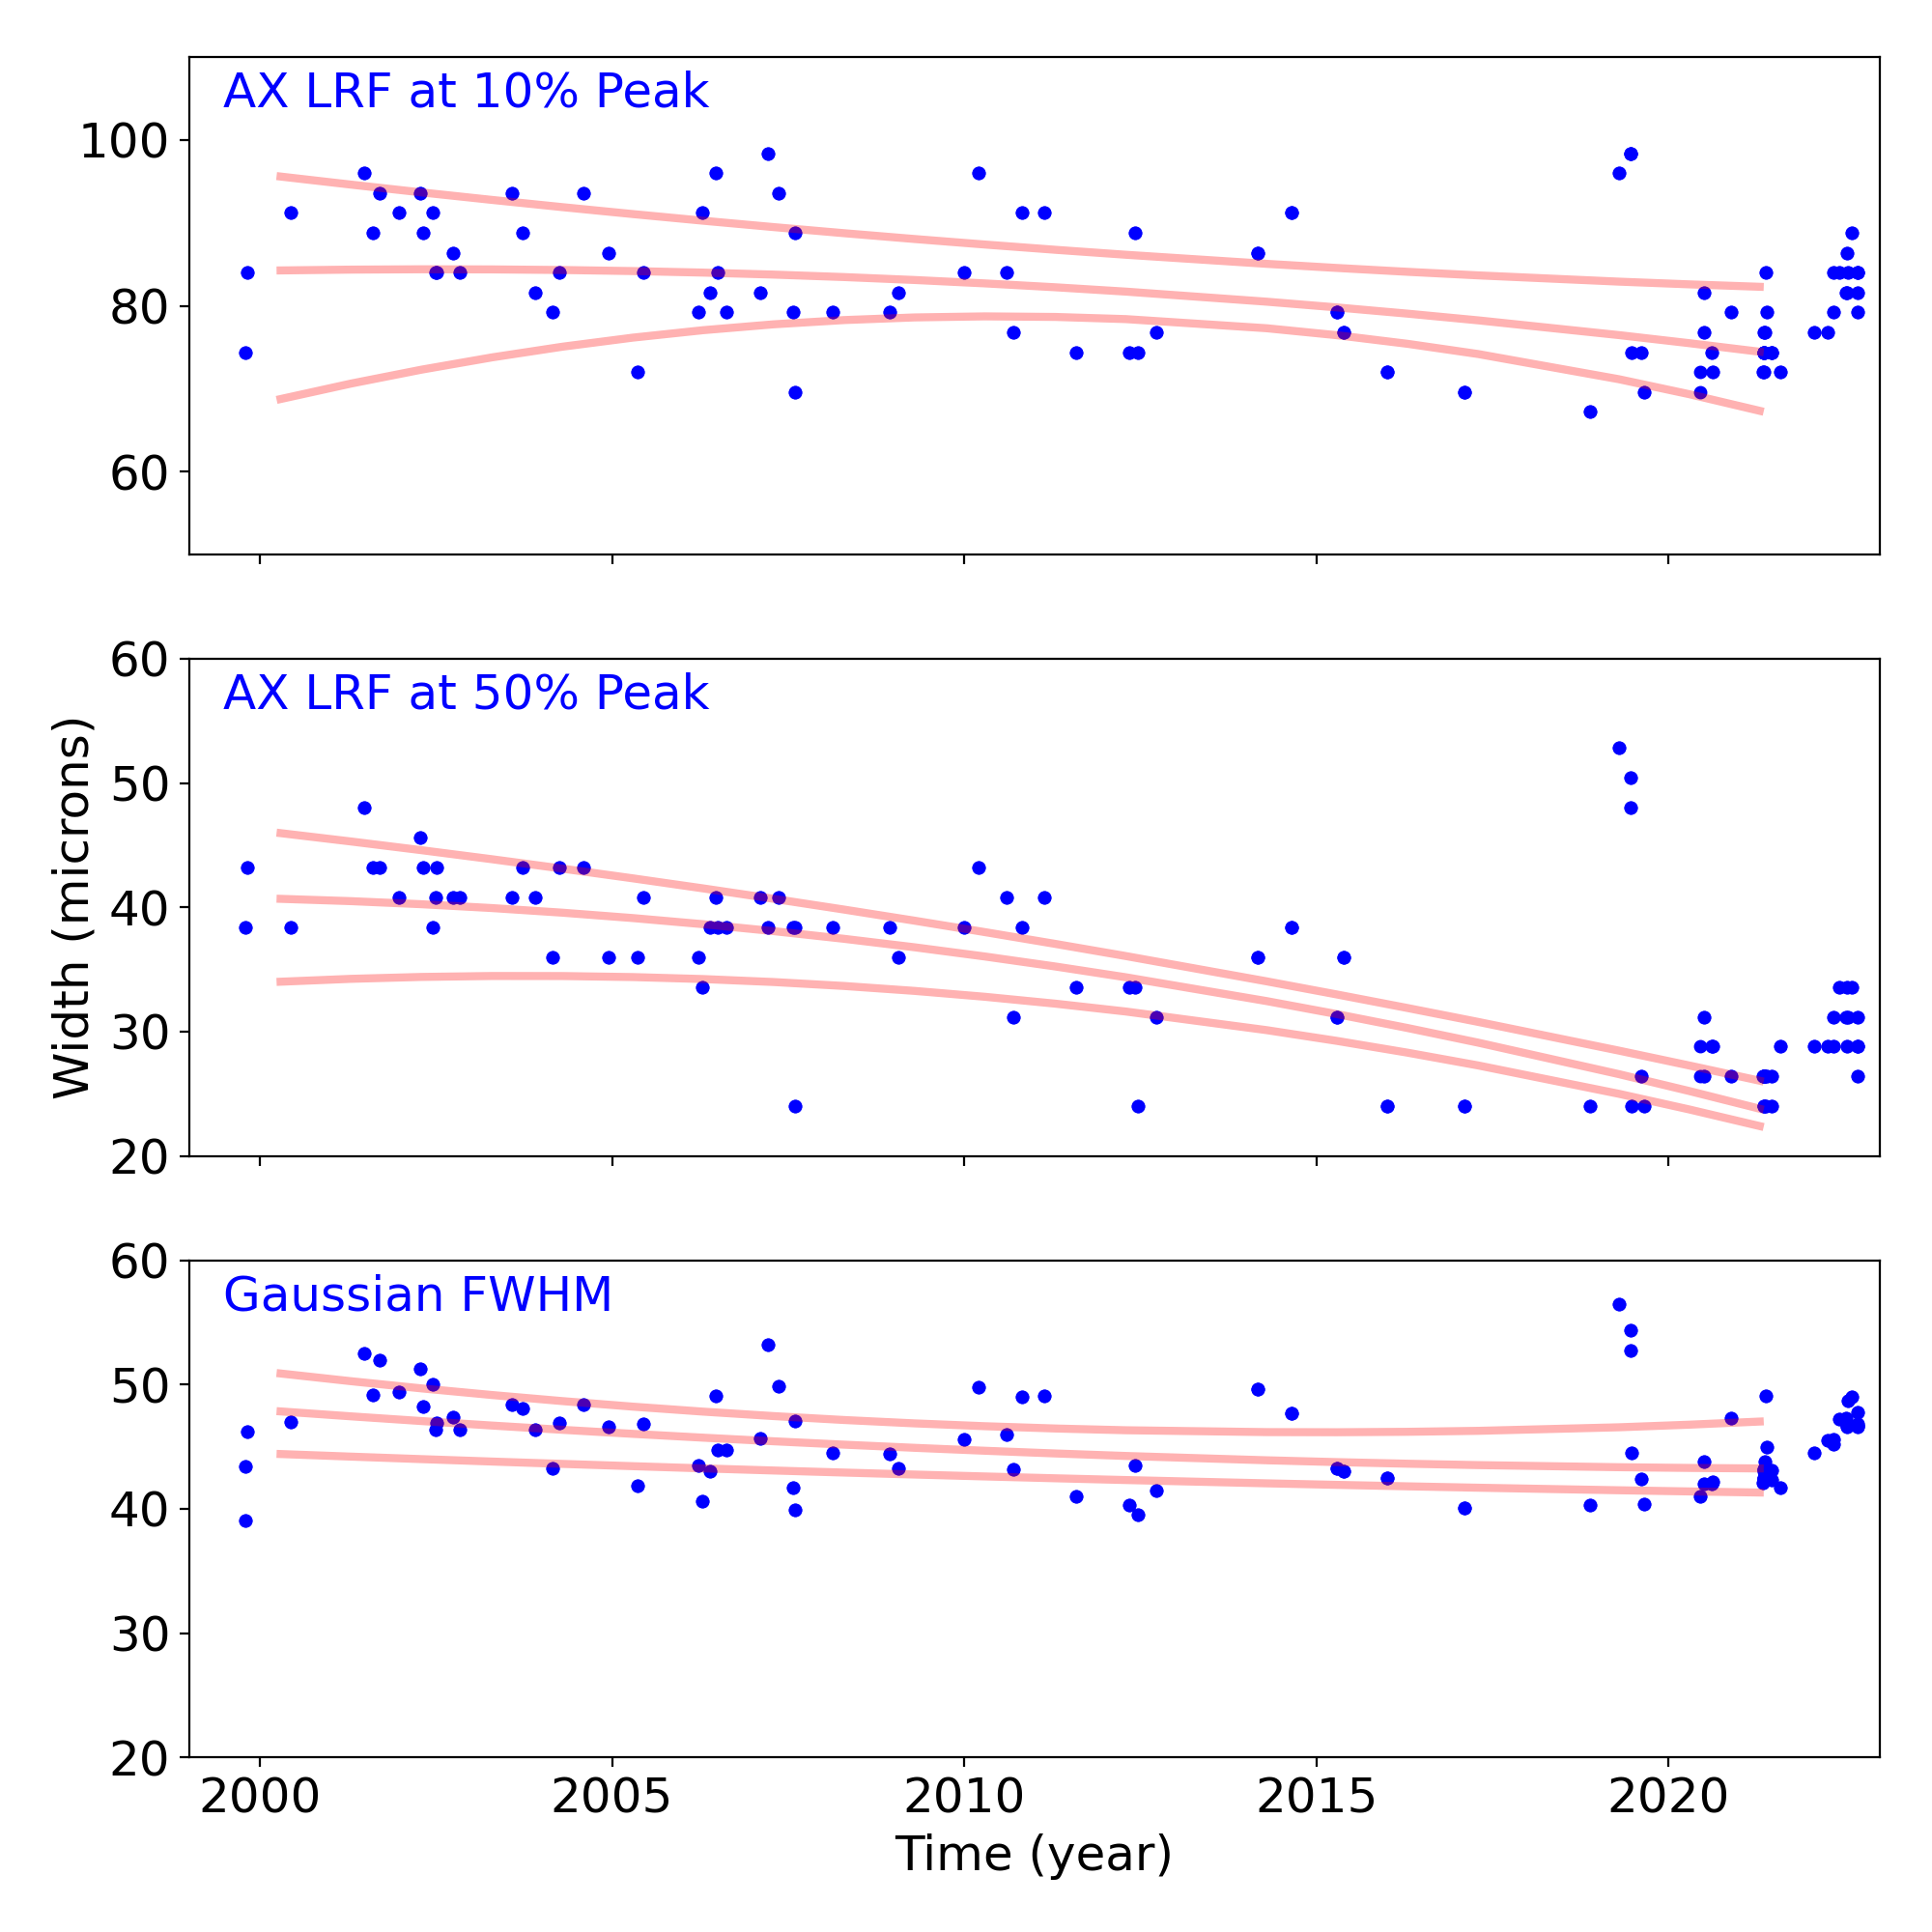
Grating Trends/Focus
We plot the width of the zero order streak of ACIS/HETG observations and the width of the zero order image for HRC/LETG observations of point sources. No significant defocusing trend is seen at this time. See Gratings Trends pages.
PCAD
ACA Trending
| ACIS |
)
|
)
|
)
|
|
|---|---|---|---|---|
)
|
)
|
)
| ||
| HRCI |
)
|
)
|
)
|
)
|
| HRCI |
)
|
)
|
)
|
)
|
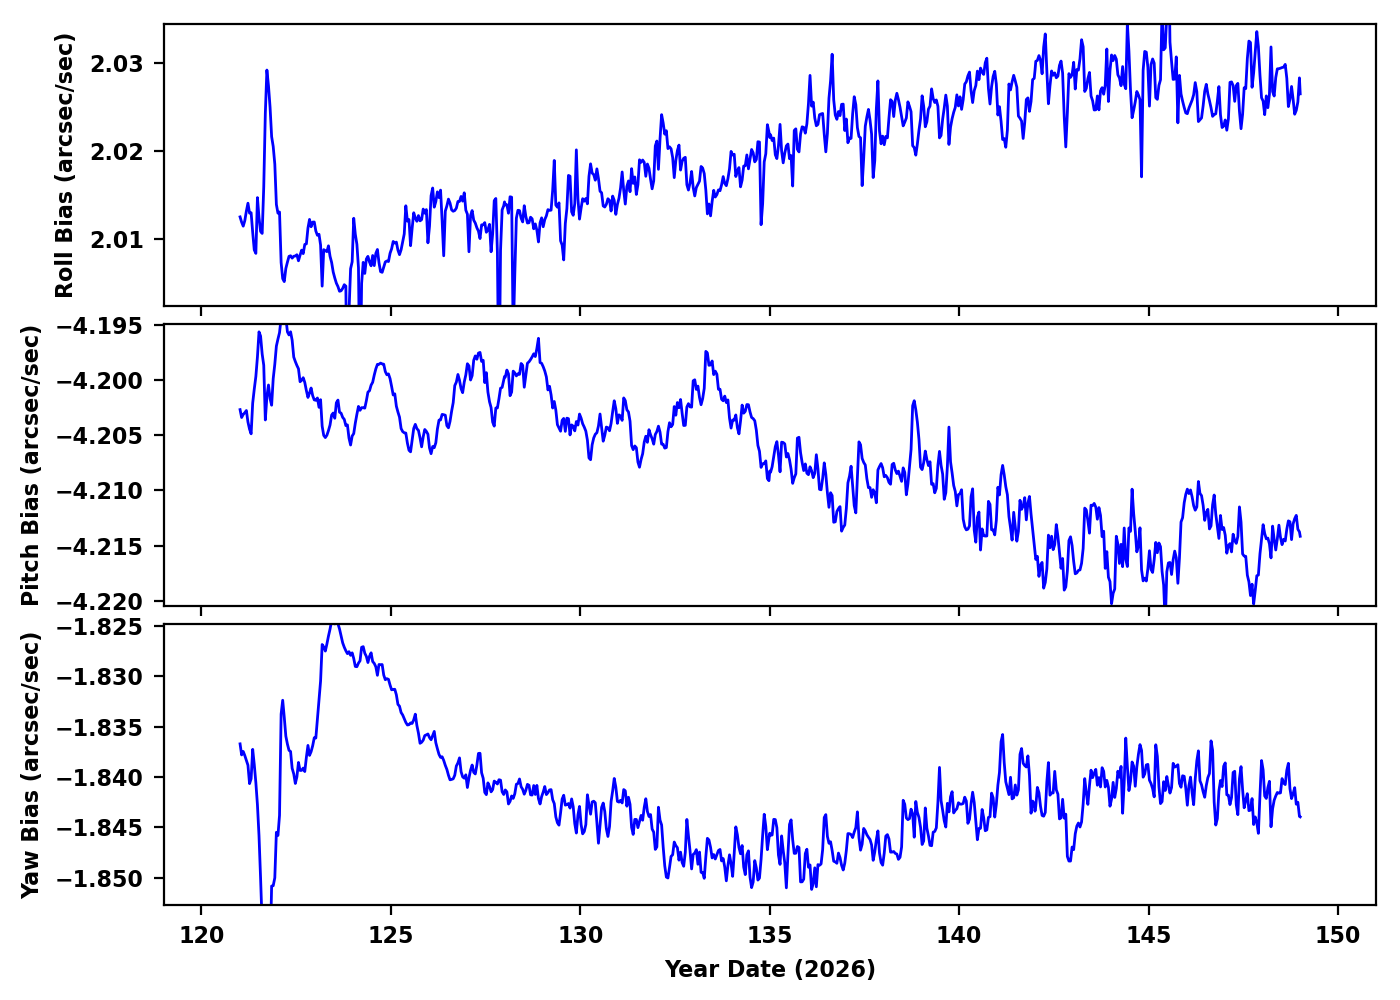
Gyro Bias Drift
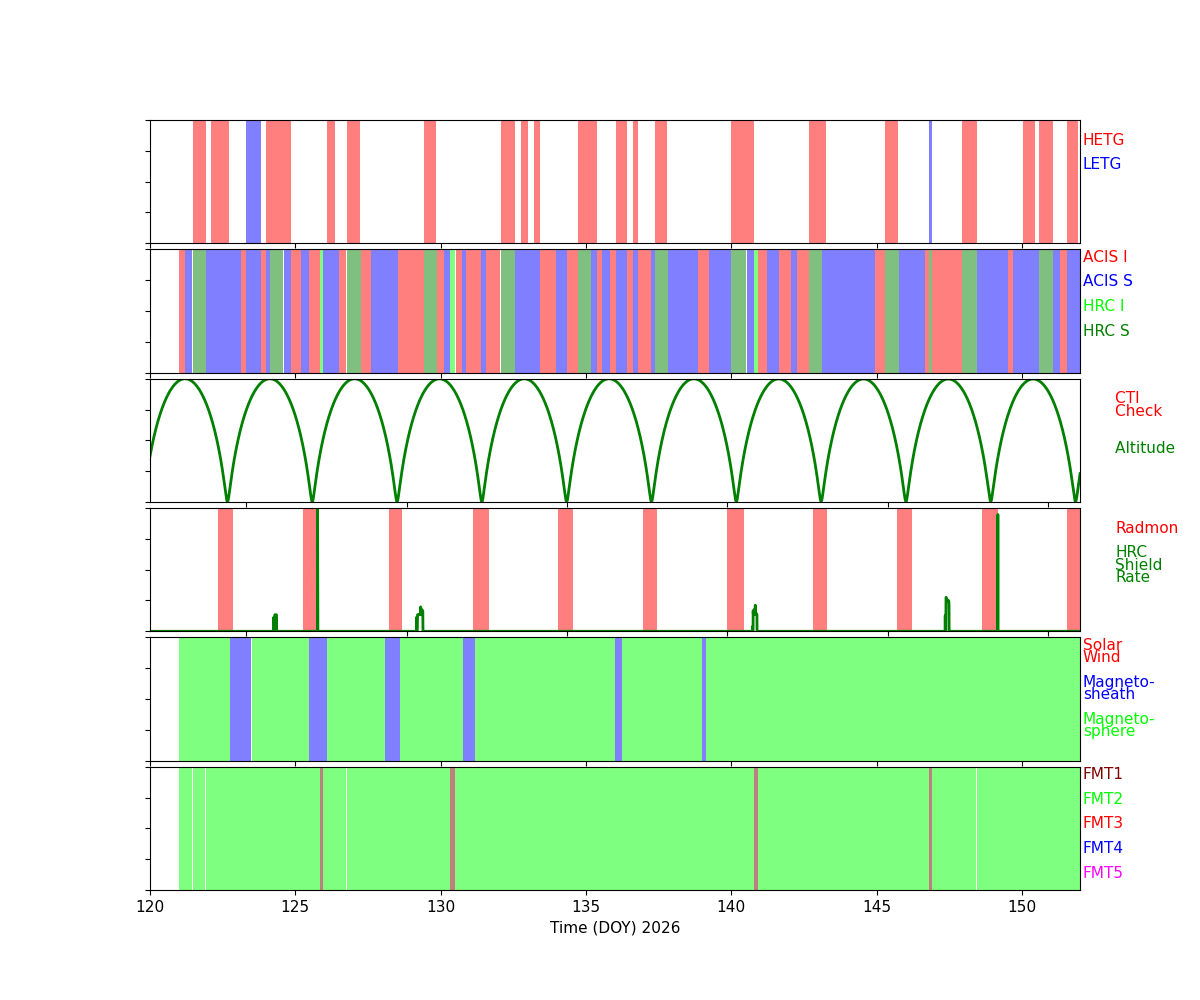
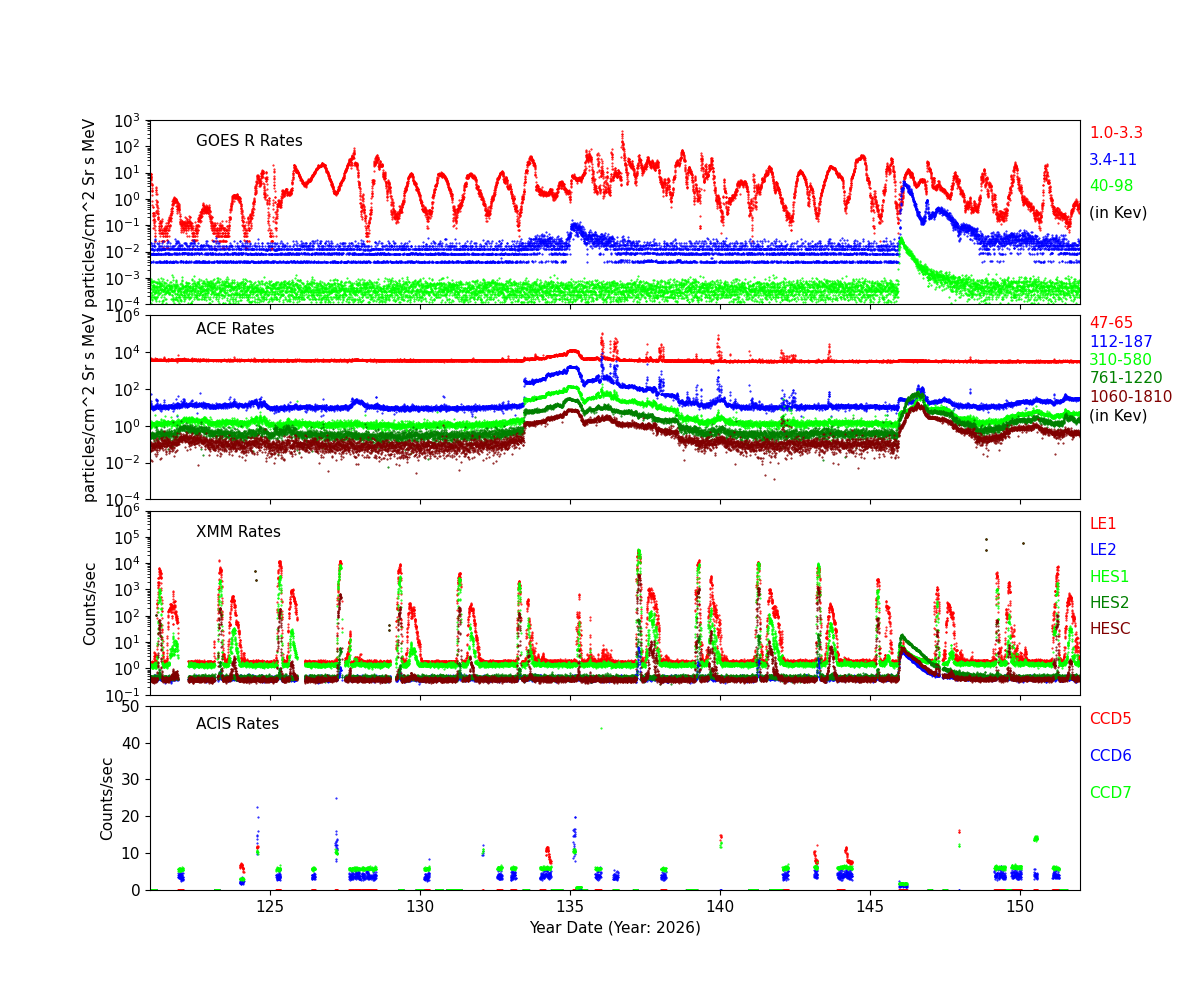
Radiation History
Radiation Count Rates of May 2026
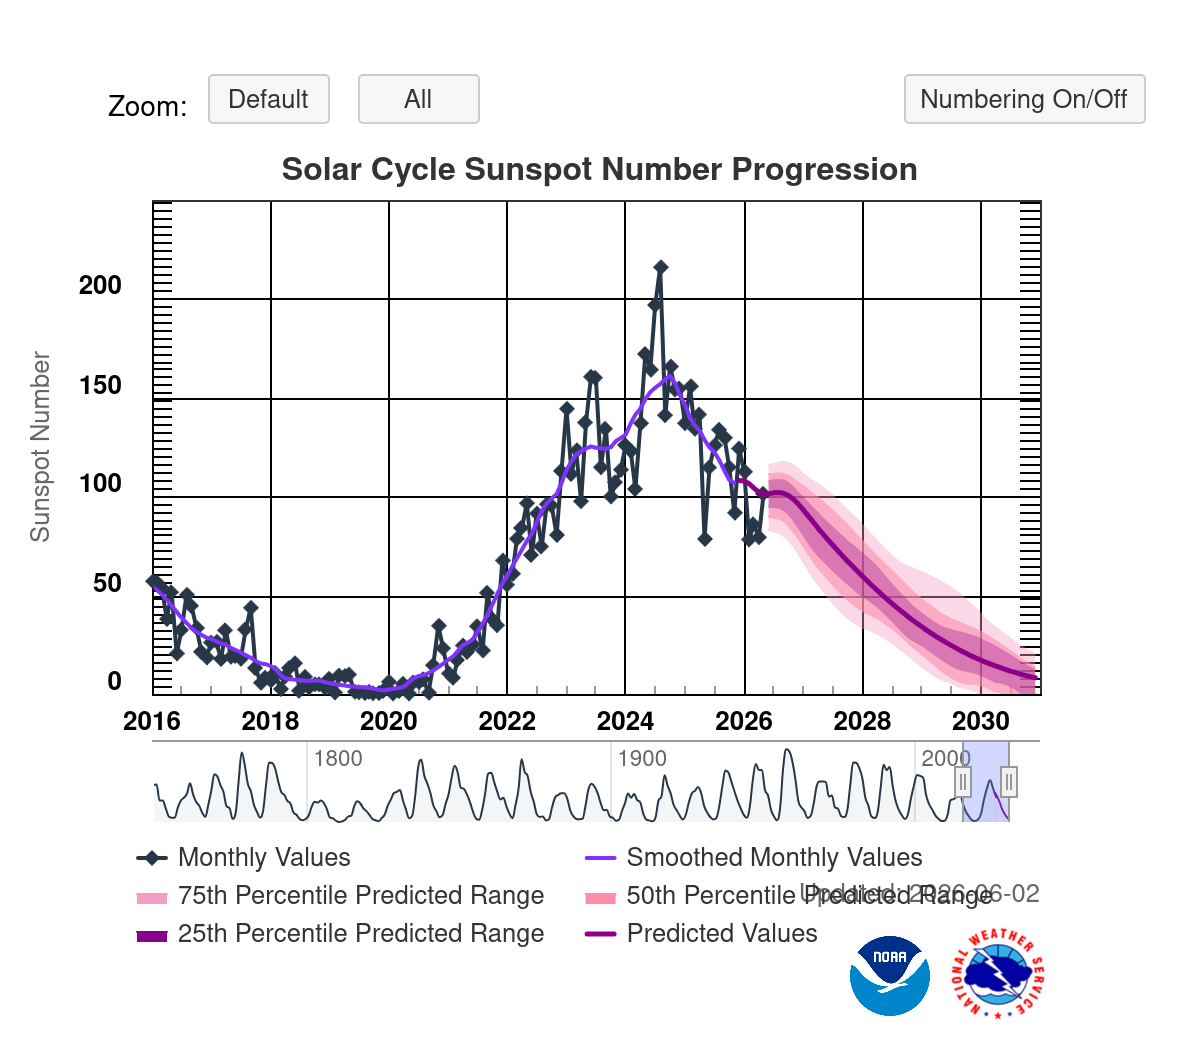
Sun Spot History (See:NOAA Page)
Trending
Quarterly Trends
- HRMA Heater
| Previous Quarter | |||||||
| MSID | MEAN | RMS | DELTA/YR | DELTA/YR/YR | UNITS | DESCRIPTION | |
| ohrthr03 | -0.001 | 8.917e-05 | (2.96+/-0.00)e2 | 0.09 +/- 0.02 | K | RT 5: HRMA FORWARD APERTURE PLATE | |
|---|---|---|---|---|---|---|---|
| ohrthr09 | -0.002 | 2.213e-04 | (2.97+/-0.01)e2 | 0.19 +/- 0.06 | K | RT 105: HRMA CAP | |
| ohrthr17 | -0.002 | 2.264e-04 | (2.97+/-0.01)e2 | 0.19 +/- 0.07 | K | RT 125: HSA OUTER CYNLINDER | |
| ohrthr24 | -0.003 | 3.985e-04 | (2.98+/-0.01)e2 | 0.46 +/- 0.18 | K | RT 12: HRMA AFT HEATER PLATE | |
| ohrthr38 | -0.002 | 9.930e-04 | (3.03+/-0.02)e2 | 0.67 +/- 0.66 | K | RT 120: HRMA AFT COLLIMATOR OUTER CYLINDER | |
| ohrthr52 | -0.002 | 2.273e-04 | (2.96+/-0.01)e2 | 0.20 +/- 0.07 | K | RT 100: HRMA CAP | |
- HRMA Thermal
| Previous Quarter | |||||||
| MSID | MEAN | RMS | DELTA/YR | DELTA/YR/YR | UNITS | DESCRIPTION | |
| 4rt568t | -0.002 | 0.001 | (3.02+/-0.02)e2 | 0.84 +/- 0.69 | K | RT 568 - HRMA TEMP | |
|---|---|---|---|---|---|---|---|
| 4rt569t | -0.002 | 3.541e-04 | (2.98+/-0.01)e2 | 0.38 +/- 0.15 | K | RT 569 - HRMA TEMP | |
| 4rt570t | -0.002 | 2.123e-04 | (2.97+/-0.01)e2 | 0.16 +/- 0.06 | K | RT 570 - HRMA TEMP | |
| 4rt575t | -0.001 | 0.001 | (3.08+/-0.03)e2 | 0.79 +/- 0.91 | K | RT 575 - OB CONE TEMP | |
| 4rt576t | -0.002 | 0.001 | (2.98+/-0.03)e2 | 0.73 +/- 0.71 | K | RT 576 - OB CONE TEMP | |
| 4rt578t | -0.002 | 0.002 | (3.07+/-0.04)e2 | 1.39 +/- 1.10 | K | RT 578 - OB CONE TEMP | |
- MUPS
| Previous Quarter | |||||||
| MSID | MEAN | RMS | DELTA/YR | DELTA/YR/YR | UNITS | DESCRIPTION | |
| pm1thv1t | -0.002 | 0.008 | (3.61+/-0.18)e2 | -0.56 +/- 3.45 | K | MUPS 1 THRUSTER VALVE 01 TEMP | |
|---|---|---|---|---|---|---|---|
| pline02t | -6.632e-05 | 0.006 | (3.49+/-0.14)e2 | 0.92 +/- 3.39 | K | PROP LINE TEMP 02 | |
| pline03t | -5.320e-04 | 0.006 | (3.39+/-0.14)e2 | 0.72 +/- 2.42 | K | PROP LINE TEMP 03 | |
| pline04t | -0.008 | 0.005 | (3.30+/-0.11)e2 | 2.71 +/- 2.91 | K | PROP LINE TEMP 04 | |
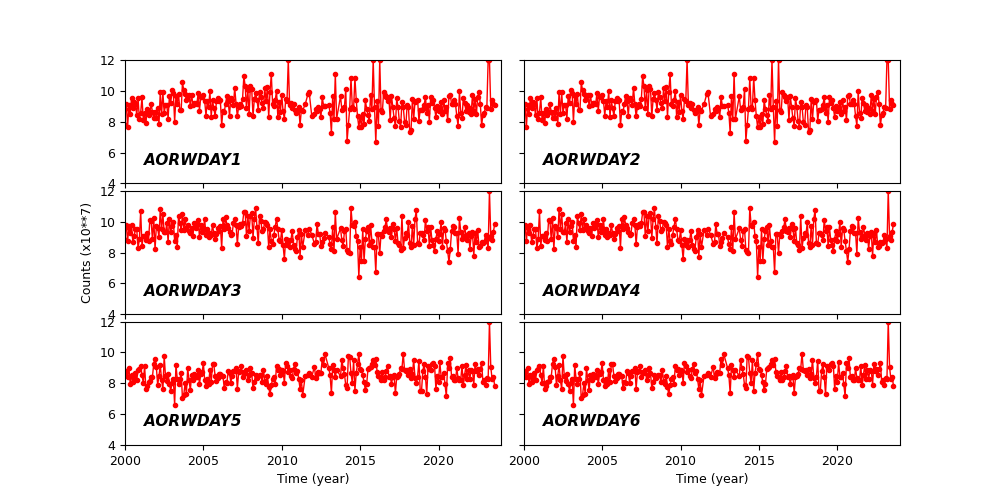
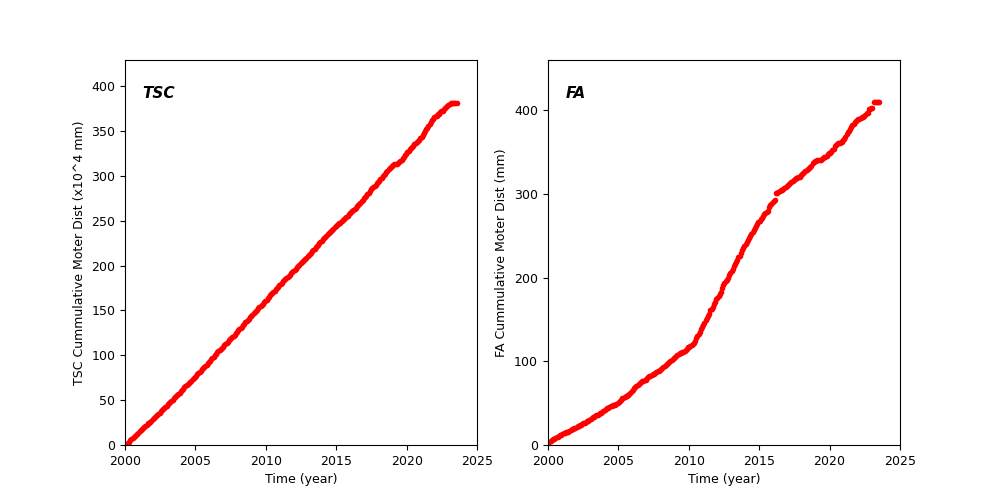
Spacecraft Motions
TSC and FA Cummulative Moter Distance
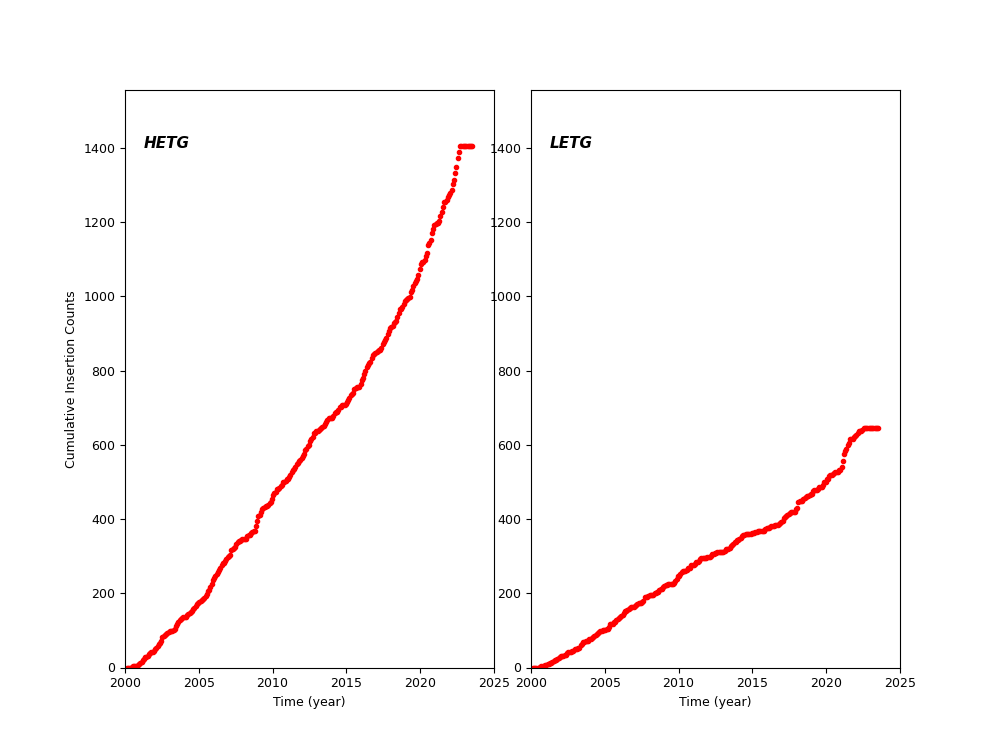
HETG and LETG Cummulative Insertion Counts
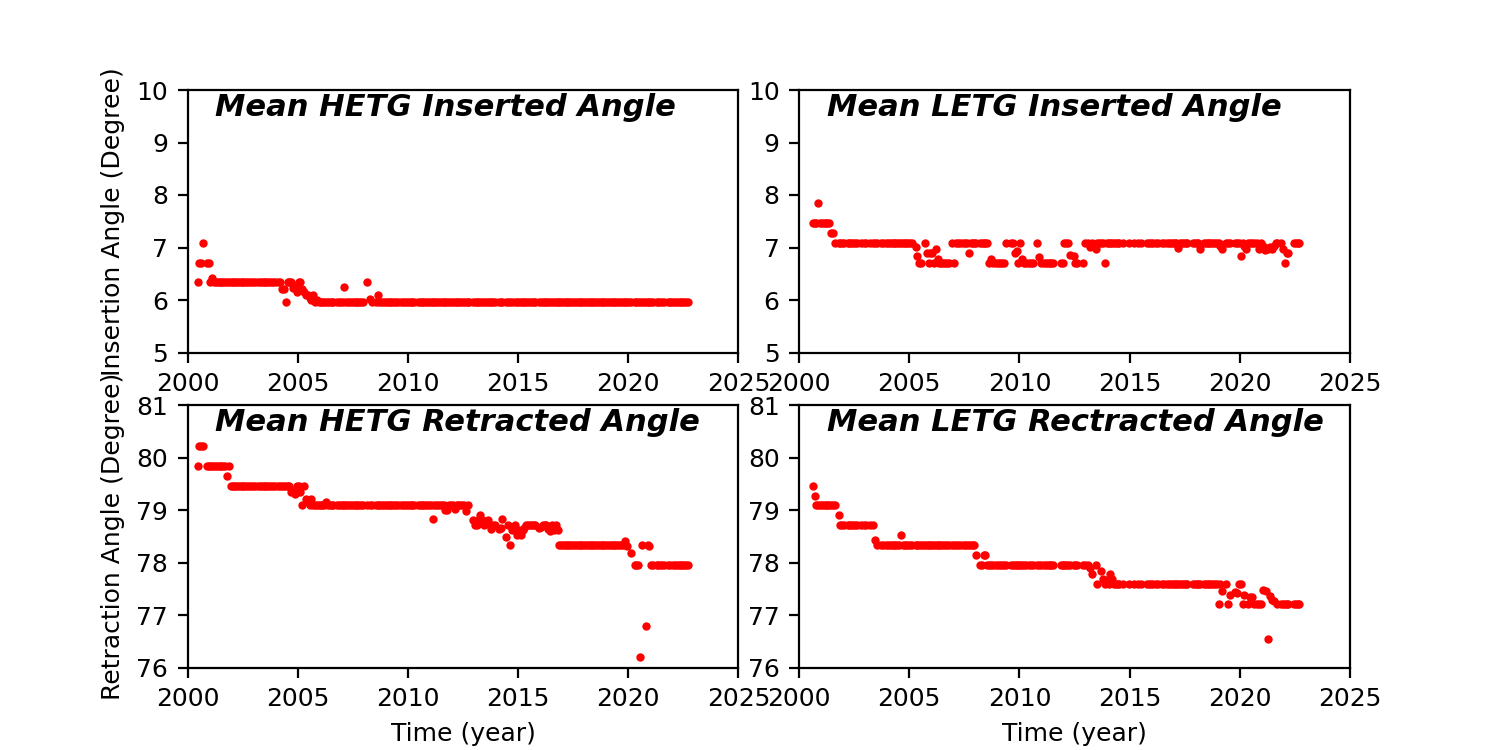
HETG/LETG Insertion/Retraction Angle
Reaction Wheel Rotations