ACIS
ACIS DOSE Registered-Photon-Map
The steps we took to compute the dose map are;
- Level 1 Event files for a specified month are obtained from archive.
- Image data including I2, I3, S2, S3 CCDs are extracted from all event files.
- All the extracted image data were merged to create a month long exposure map for the month.
- The exposure map is opened with ds9, and check a distribution of count rates against energy. From this, estimate the upper threshold value. Any events beyond this upper threshold are assumed erroneous events such as bad pixels.
- Using this upper threshold, the data is filtered, and create a cleaned exposure map for the month.
- The exposure map from each month from the Sep 1999 is added up to create a cumulative exposure map for each month.
- Using fimgstatistic, we compute count rate statistics for each CCDs.
- For observations with high data drop rates (e.g., Crab nebula, Cas A), we corrected the observations by adding events.
Please check more detail plots at Telemetered Photon Dose Trend page.
)
)
)
Statistics:
# IMAGE     NPIX     MEAN        RMS        MIN     MAX
ACIS_apr26 6004901       4.666         9.221           0.0     4760


I2 node 0  262654	4.424921	2.715923	0.0	 60.0
I2 node 1  262654	7.952913	7.524962	0.0	1390.0
I2 node 2  262654	6.227916	4.433847	0.0	 91.0
I2 node 3  262654	4.032045	3.011655	0.0	775.0

I3 node 0  262654	4.560207	2.803518	0.0	531.0
I3 node 1  262654	4.999564	11.176822	0.0	3546.0
I3 node 2  262654	4.873408	2.921109	0.0	 81.0
I3 node 3  262654	4.352831	13.203416	0.0	4760.0

S2 node 0  262654	5.086079	7.594788	0.0	3181.0
S2 node 1  262654	5.940830	5.234009	0.0	895.0
S2 node 2  262654	6.483858	12.751416	0.0	4754.0
S2 node 3  262654	6.581736	5.232080	0.0	533.0

S3 node 0  262654	11.262649	28.196090	0.0	1546.0
S3 node 1  262654	8.900412	4.451340	0.0	166.0
S3 node 2  262654	8.269263	5.058890	0.0	136.0
S3 node 3  262654	7.093585	4.870077	0.0	154.0
)
)
)
Statistics:
 IMAGE     NPIX      MEAN        RMS           MIN      MAX
ACIS_total   6004901       2783.326         3500.732           0.0   169725


I2 node 0  262654	2415.534197	492.317945	514.0	16322.0
I2 node 1  262654	2556.907449	723.233453	530.0	167719.0
I2 node 2  262654	2585.996292	556.439304	551.0	18190.0
I2 node 3  262654	2597.233028	685.482595	509.0	37929.0

I3 node 0  262654	2825.761913	731.395059	508.0	18320.0
I3 node 1  262654	2881.906682	1765.261722	537.0	56128.0
I3 node 2  262654	2578.502489	487.597262	504.0	15797.0
I3 node 3  262654	2548.821551	522.246232	487.0	38734.0

S2 node 0  262654	3240.776861	525.137966	1742.0	22717.0
S2 node 1  262654	3444.722584	789.973668	1917.0	23186.0
S2 node 2  262654	3823.510960	797.005670	2332.0	34584.0
S2 node 3  262654	3779.115147	659.352806	2050.0	90518.0

S3 node 0  262654	5759.987826	3174.065861	2522.0	56888.0
S3 node 1  262654	6957.084687	2420.148884	0.0	83602.0
S3 node 2  262654	5694.143696	1401.693573	2682.0	27887.0
S3 node 3  262654	4482.663418	800.542441	2691.0	26987.0
)
|
)
|
)
|
)
|
| Jan 2026 | Oct 2025 | Jul 2025 | Apr 2025 |
|---|
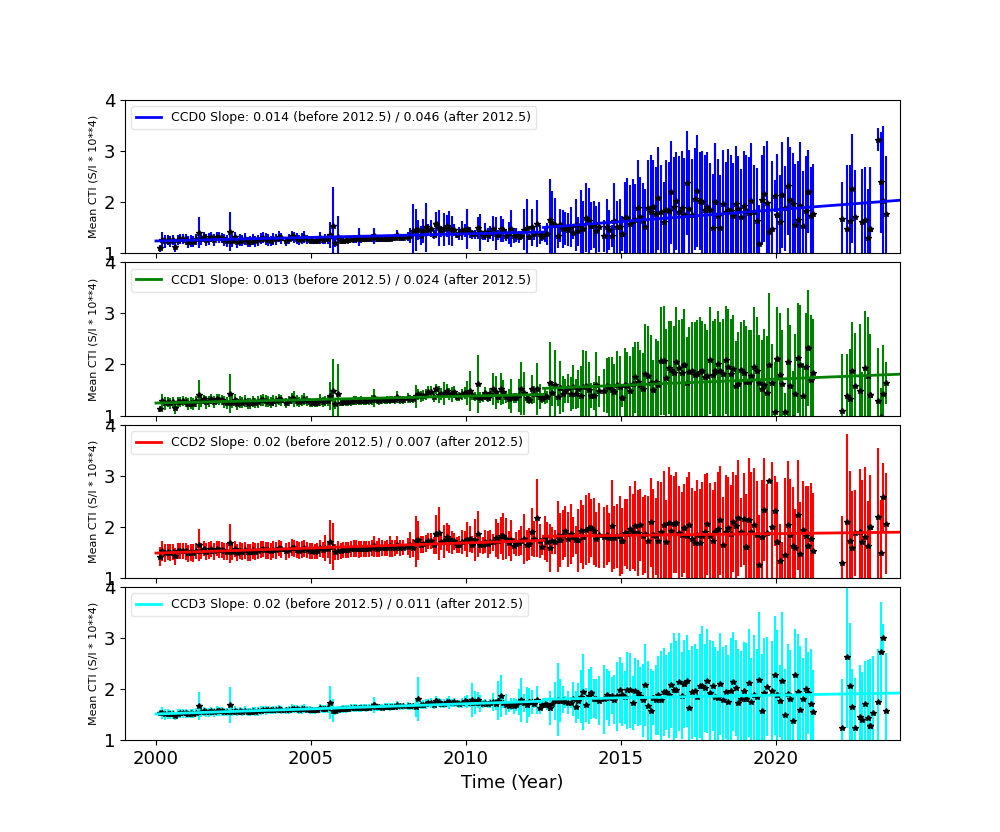
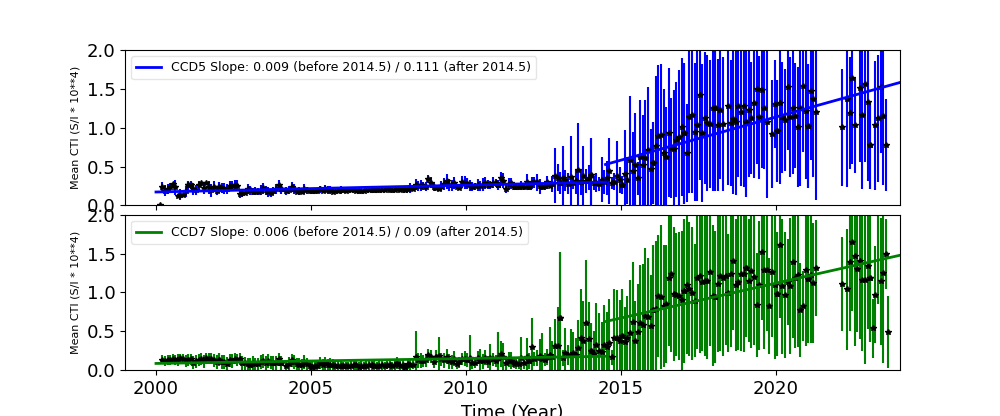
The Mean Detrended CTI
We report CTIs with a refined data definition. CTIs were computed for the temperature dependency corrected data. Please see CTI page for detailed explanation. CTI's are computed for Mn K alpha, and defined as slope/intercept x10^4 of row # vs ADU. Data file: here
Imaging CCDs
Spectral CCDs
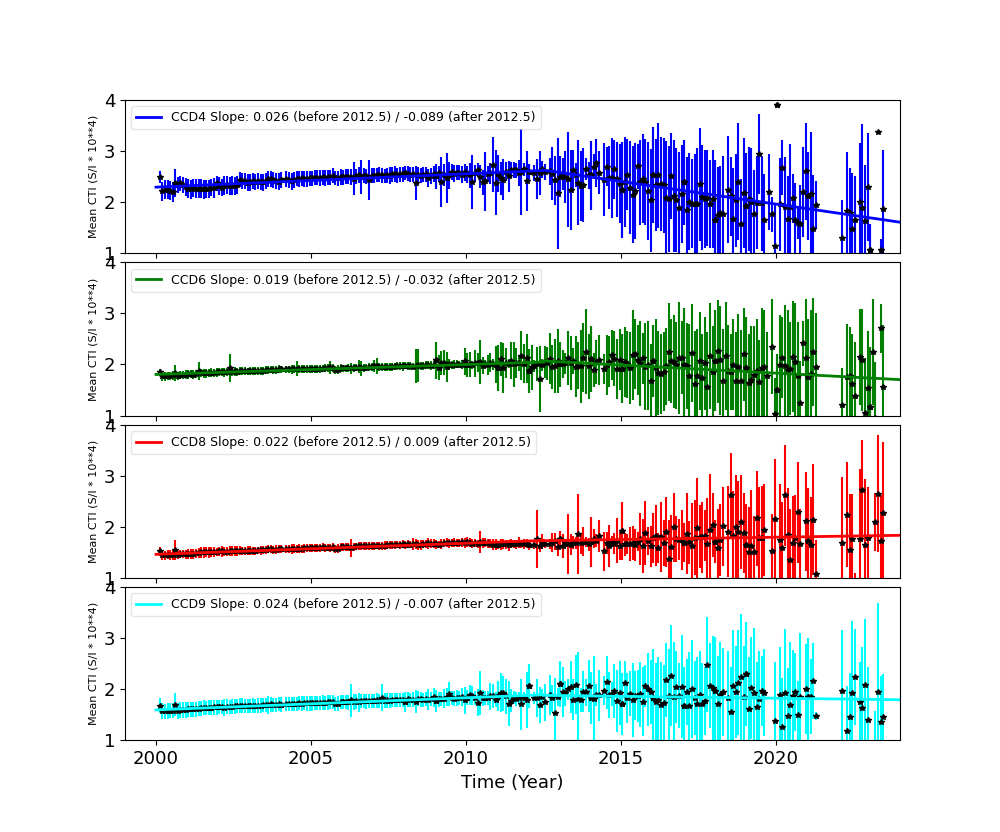
Backside CCDs
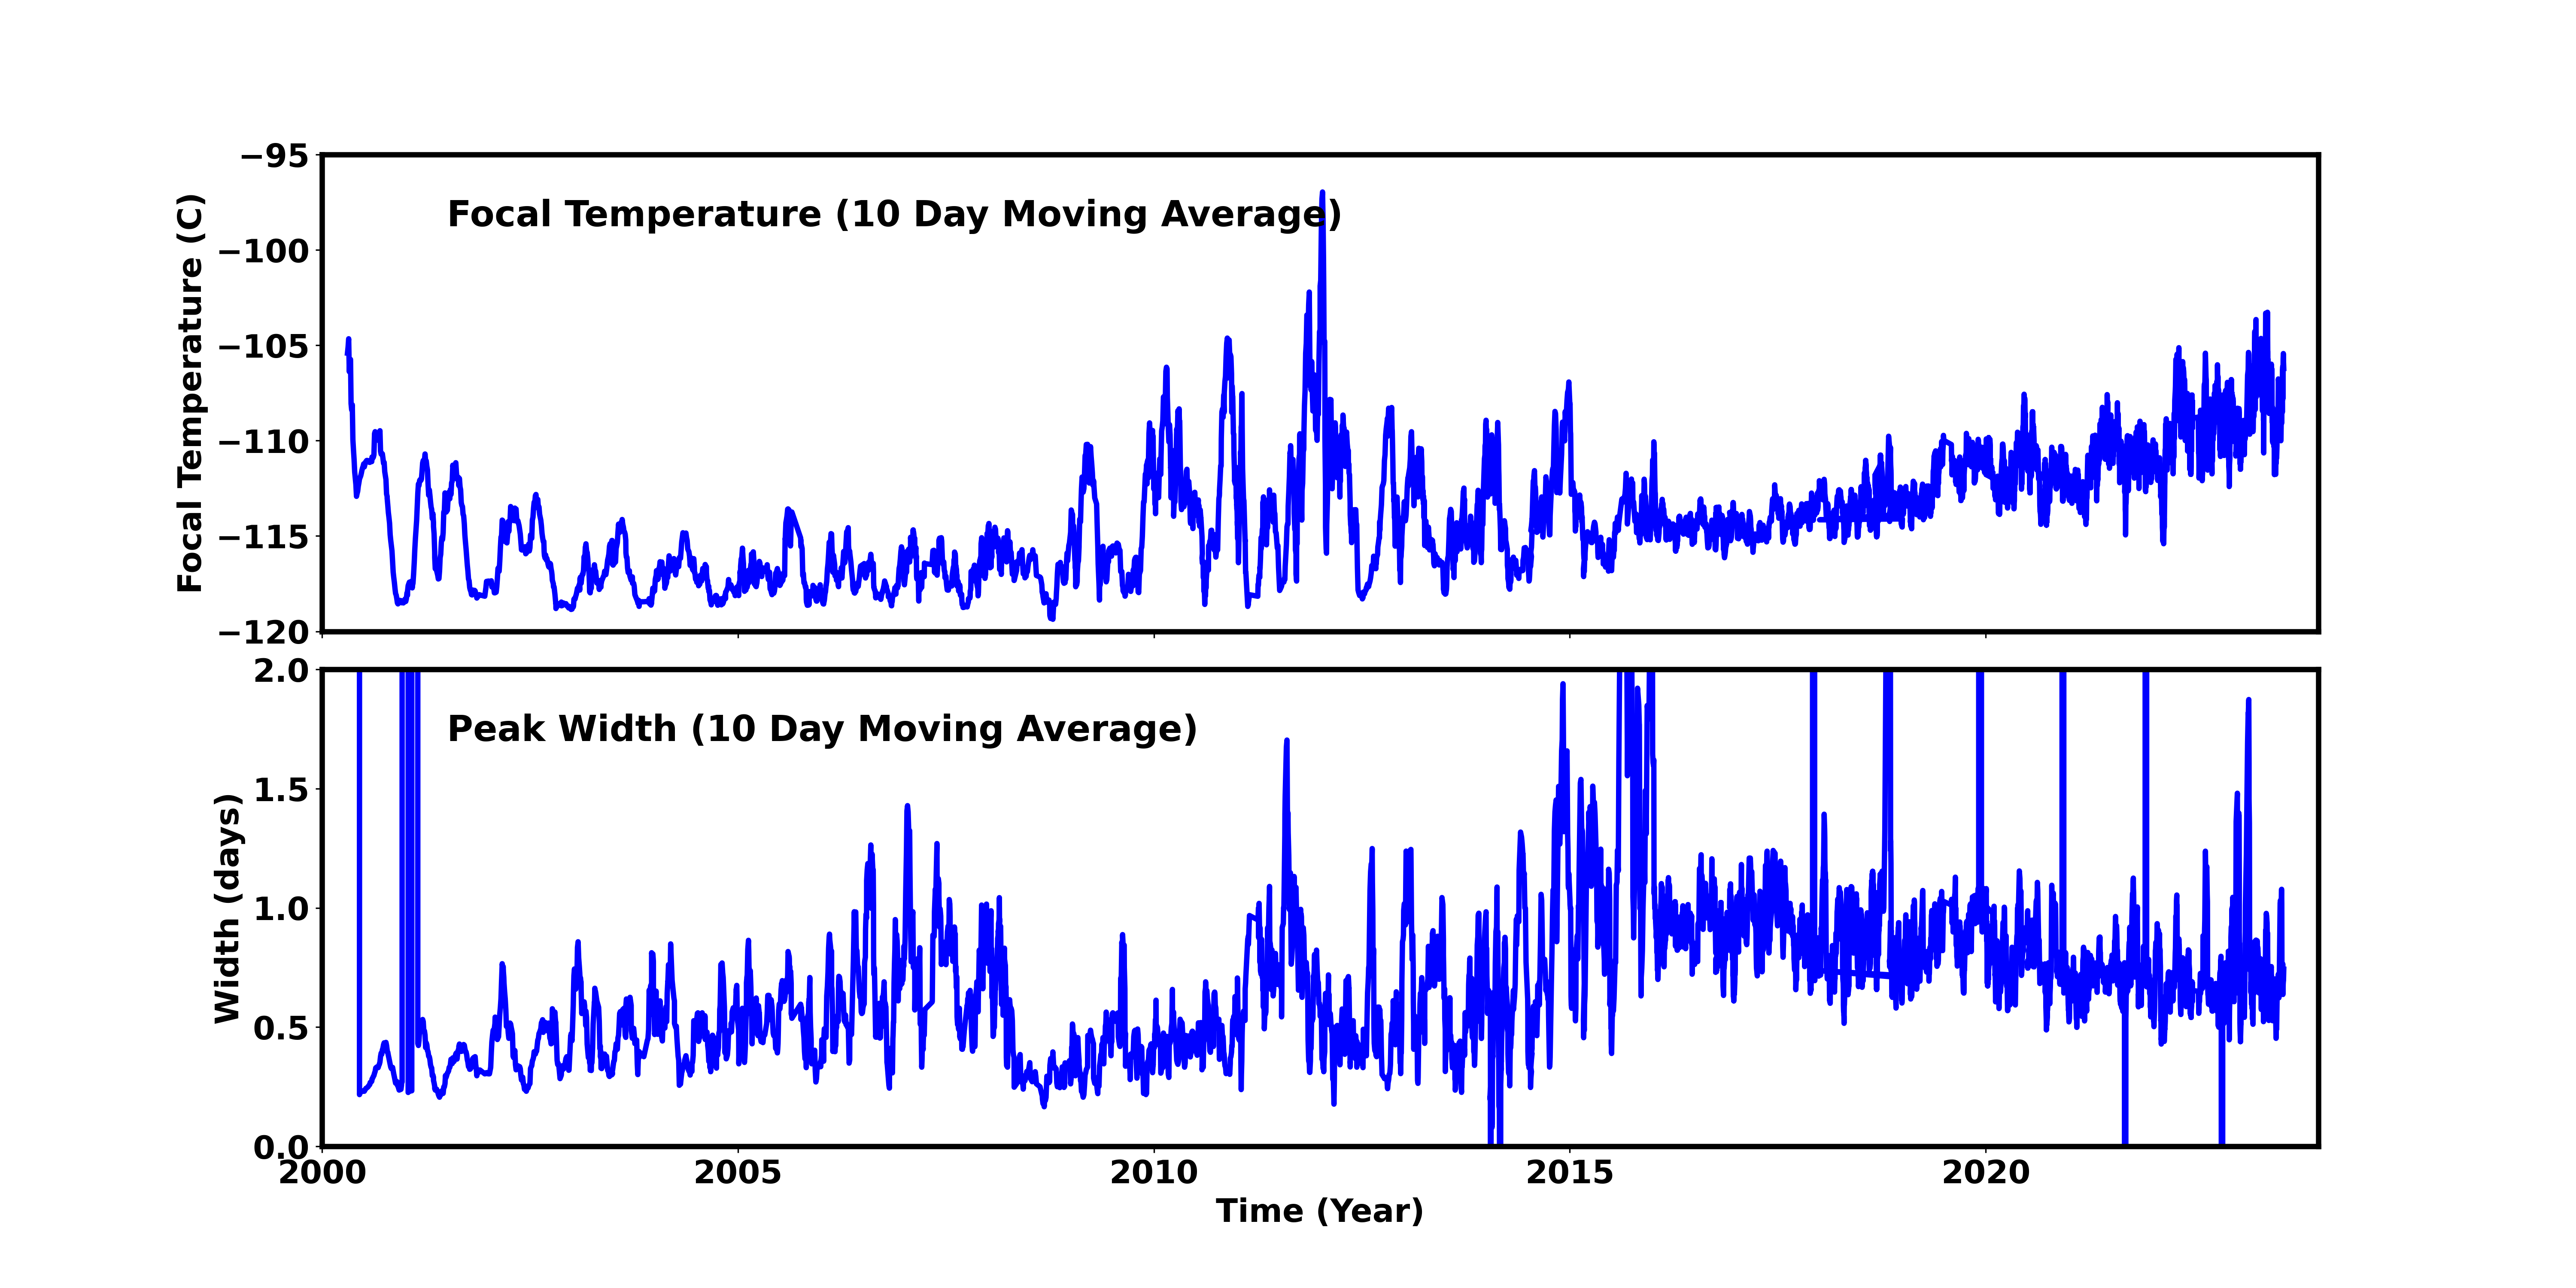
Focal Plane Temperature
Apr 2026 Focal Temperature
| The Mean (max) FPT: | |
|---|---|
| -107.53 | +/- 7.69 C |
| Mean Width: | |
| 0.8 | +/- 0.58 days |
Averaged Focal Plane Temperature
We are using 10 period moving averages to show trends of peak temperatures and peak widths. Note, the gaps in the width plot are due to missing/corrupted data.
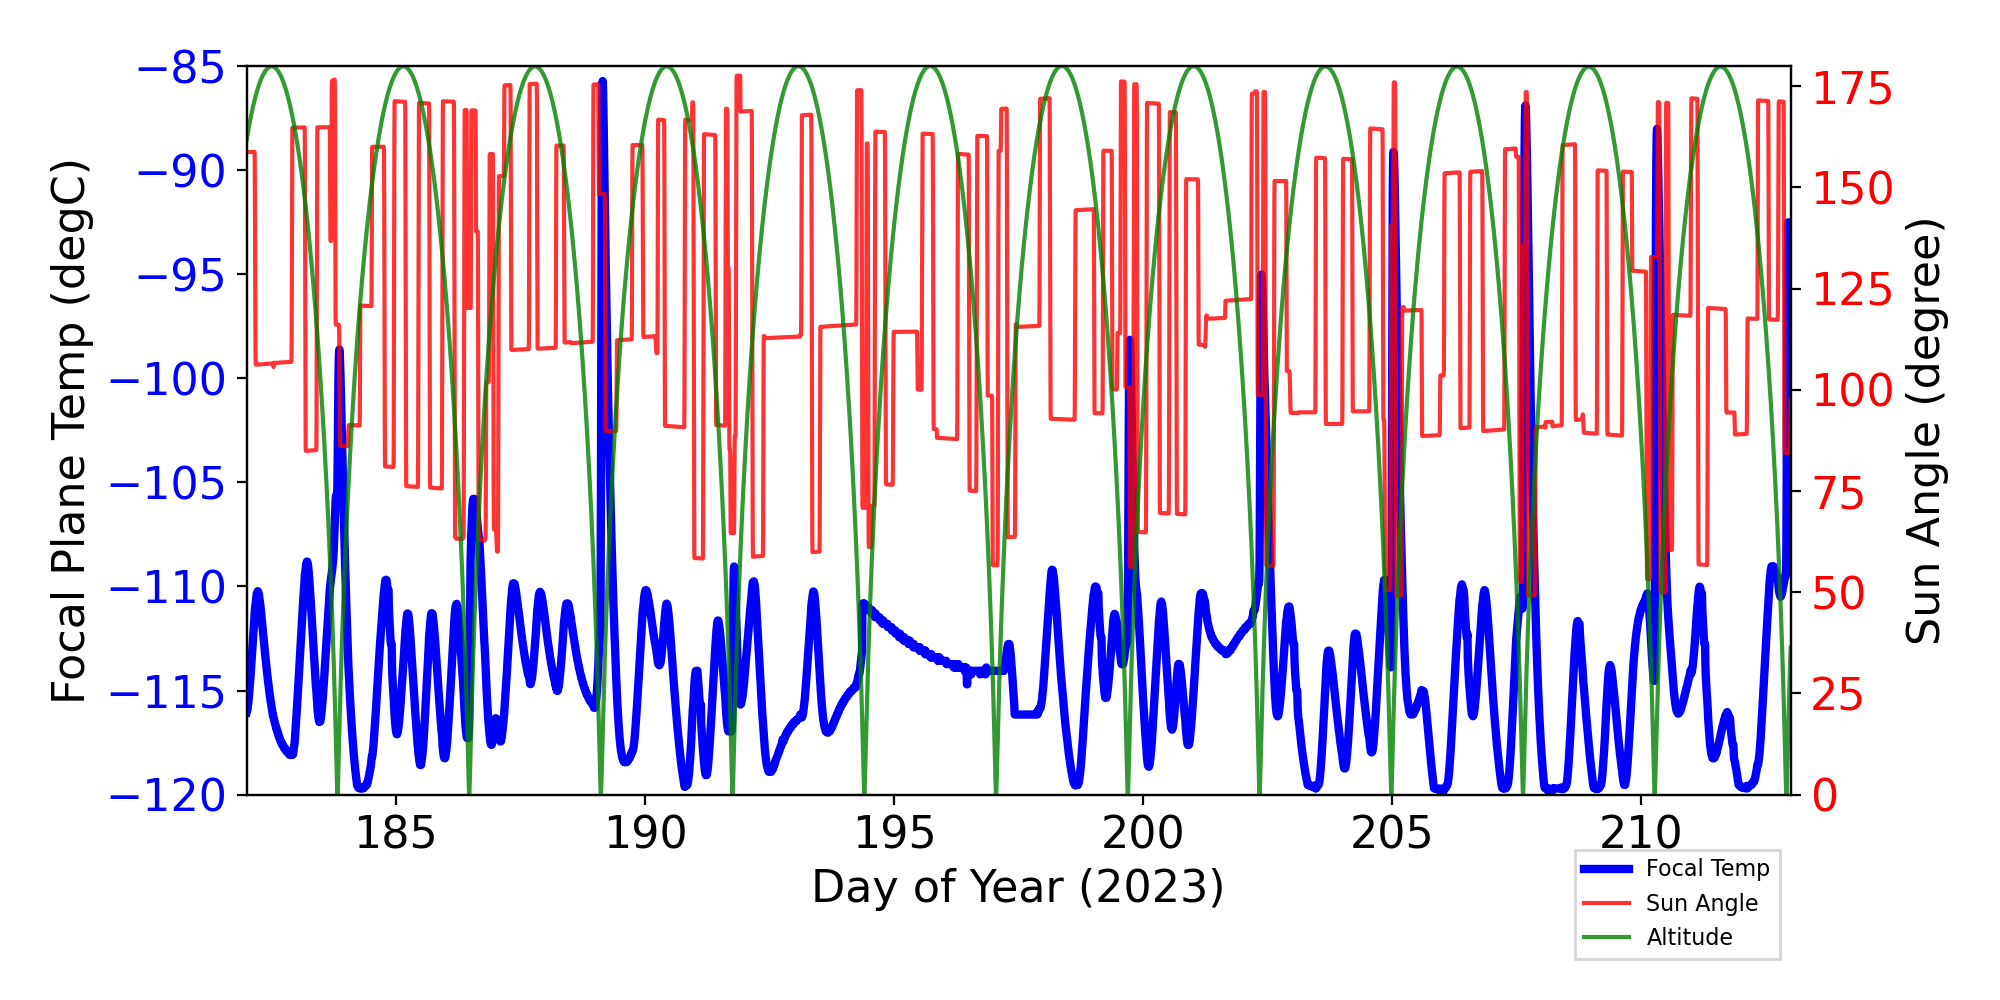
Focal Plane Temperature, Sun Angle and Altitude
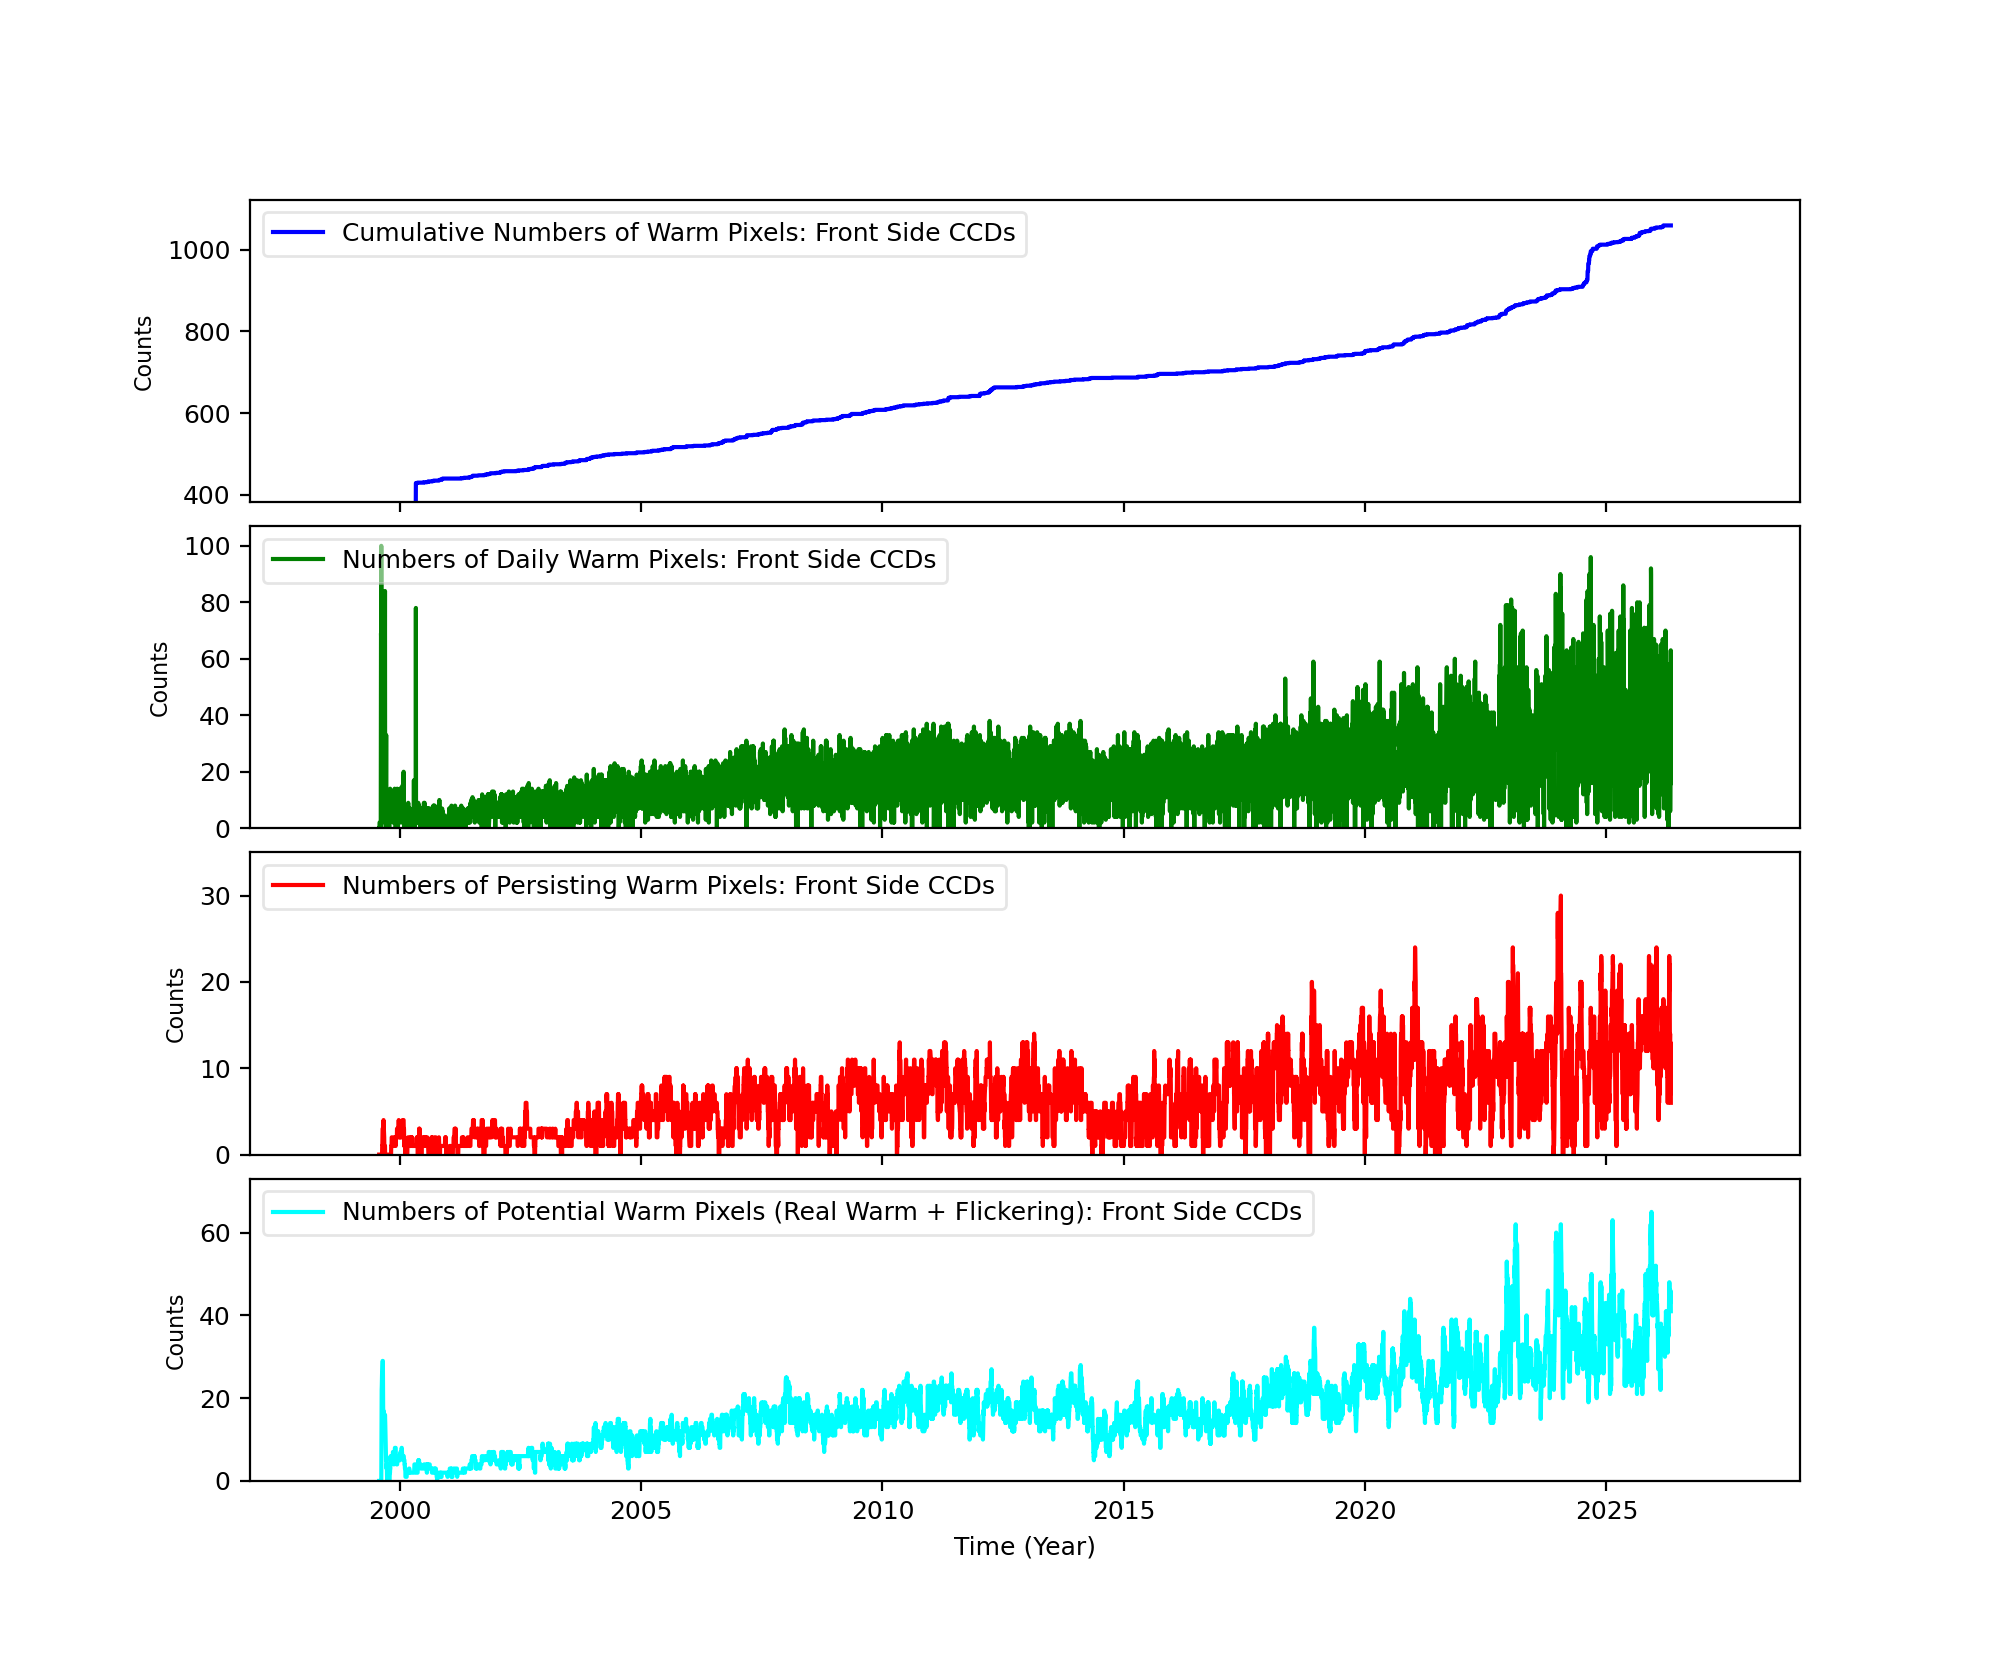
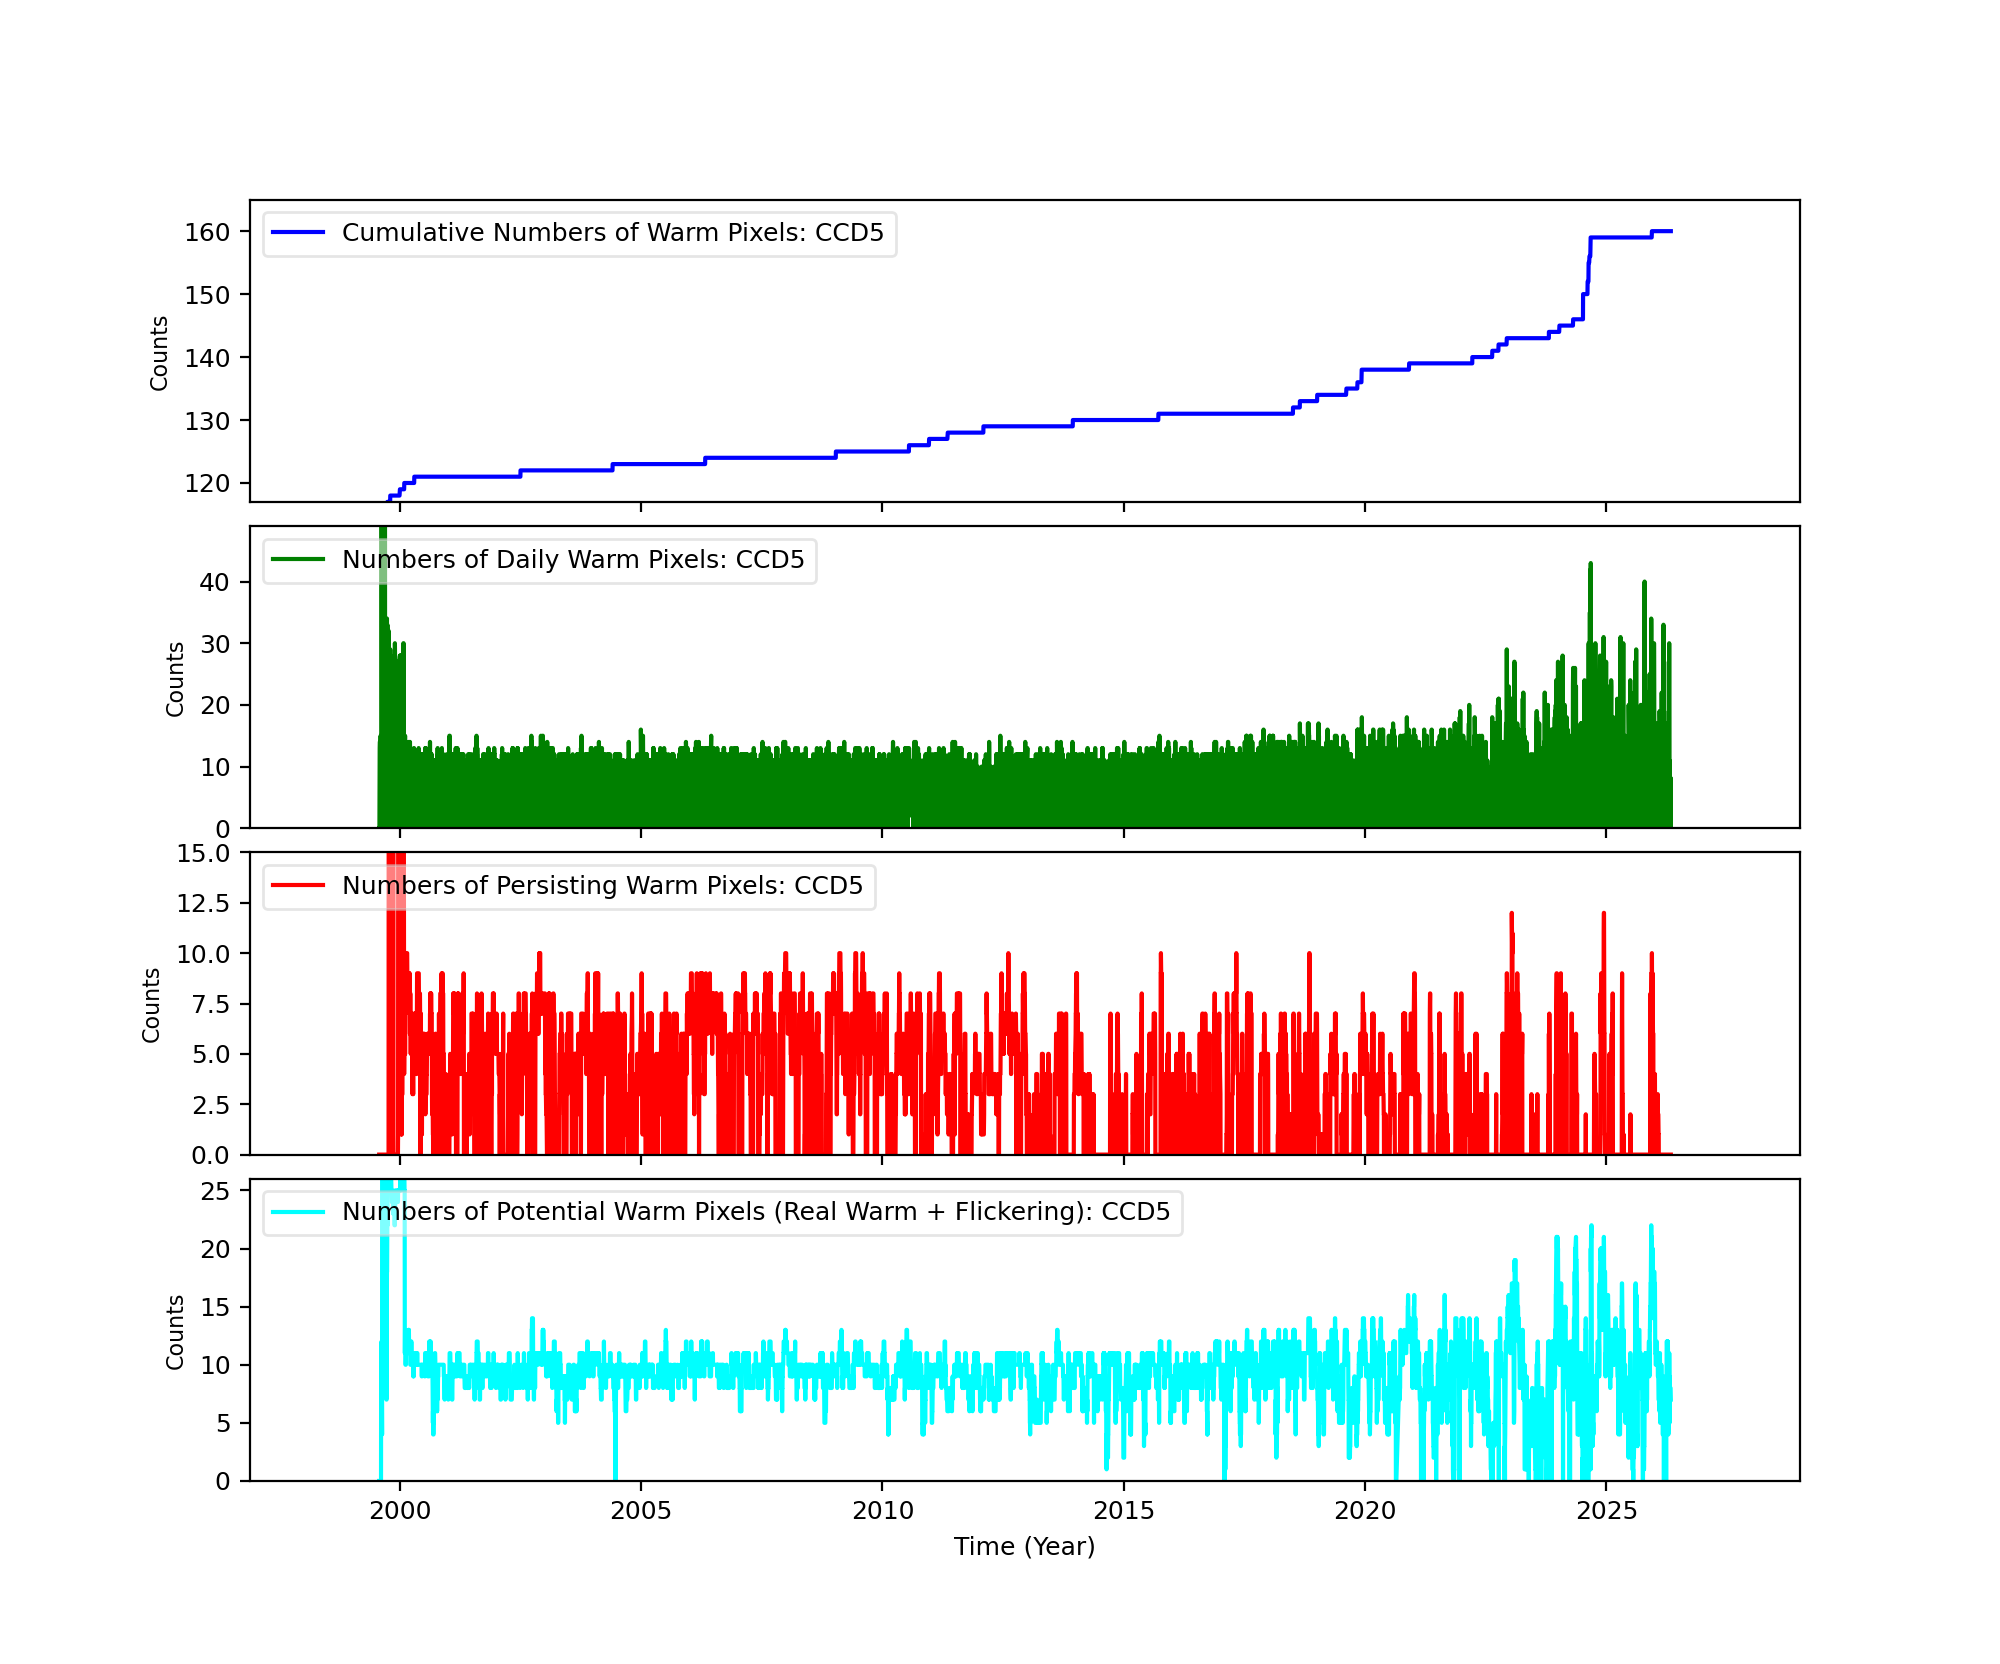
Bad Pixels
The plots below were generated with a new warm pixel finding script. Please see Acis Bad Pixel Page for details.
Front Side CCDs
Back Side CCD (CCD5)
Science Instrument Background Rates
| Name | Low (keV) | High(KeV) | Description |
|---|---|---|---|
| SSoft | 0.00 | 0.50 | Super soft photons |
| Soft | 0.50 | 1.00 | Soft photons |
| Med | 1.00 | 3.00 | Moderate energy photons |
| Hard | 3.00 | 5.00 | Hard Photons |
| Harder | 5.00 | 10.00 | Very Hard photons |
| Hardest | 10.00 | Beyond 10 keV |


HRC
DOSE of Central 4K Pore-Pairs
Please refer to Maximum Dose Trends for more details.
)
|
|---|
IMAGE                NPIX      MEAN    STDDEV      MIN       MAX
HRCI_04_2026.fits  16777216	0.053 	0.536 	0.000 	51.000
)
IMAGE                       NPIX      MEAN    STDDEV      MIN       MAX
HRCI_08_1999_04_2026.fits  16777216	na	na	na	na
No Data
)
IMAGE                       NPIX      MEAN    STDDEV      MIN       MAX
HRCS_08_1999_04_2026.fits  16777216	na	na	na	na
|
|
Max dose trend plots corrected for events that "pile-up"
in the center of the taps due to bad position information.
|
)
|
)
|
)
|
)
|
| Jan 2026 | Oct 2025 | Jul 2025 | Apr 2025 |
|---|
)
|
)
|
)
|
)
|
| Jan 2026 | Oct 2025 | Jul 2025 | Apr 2025 |
|---|
Gratings
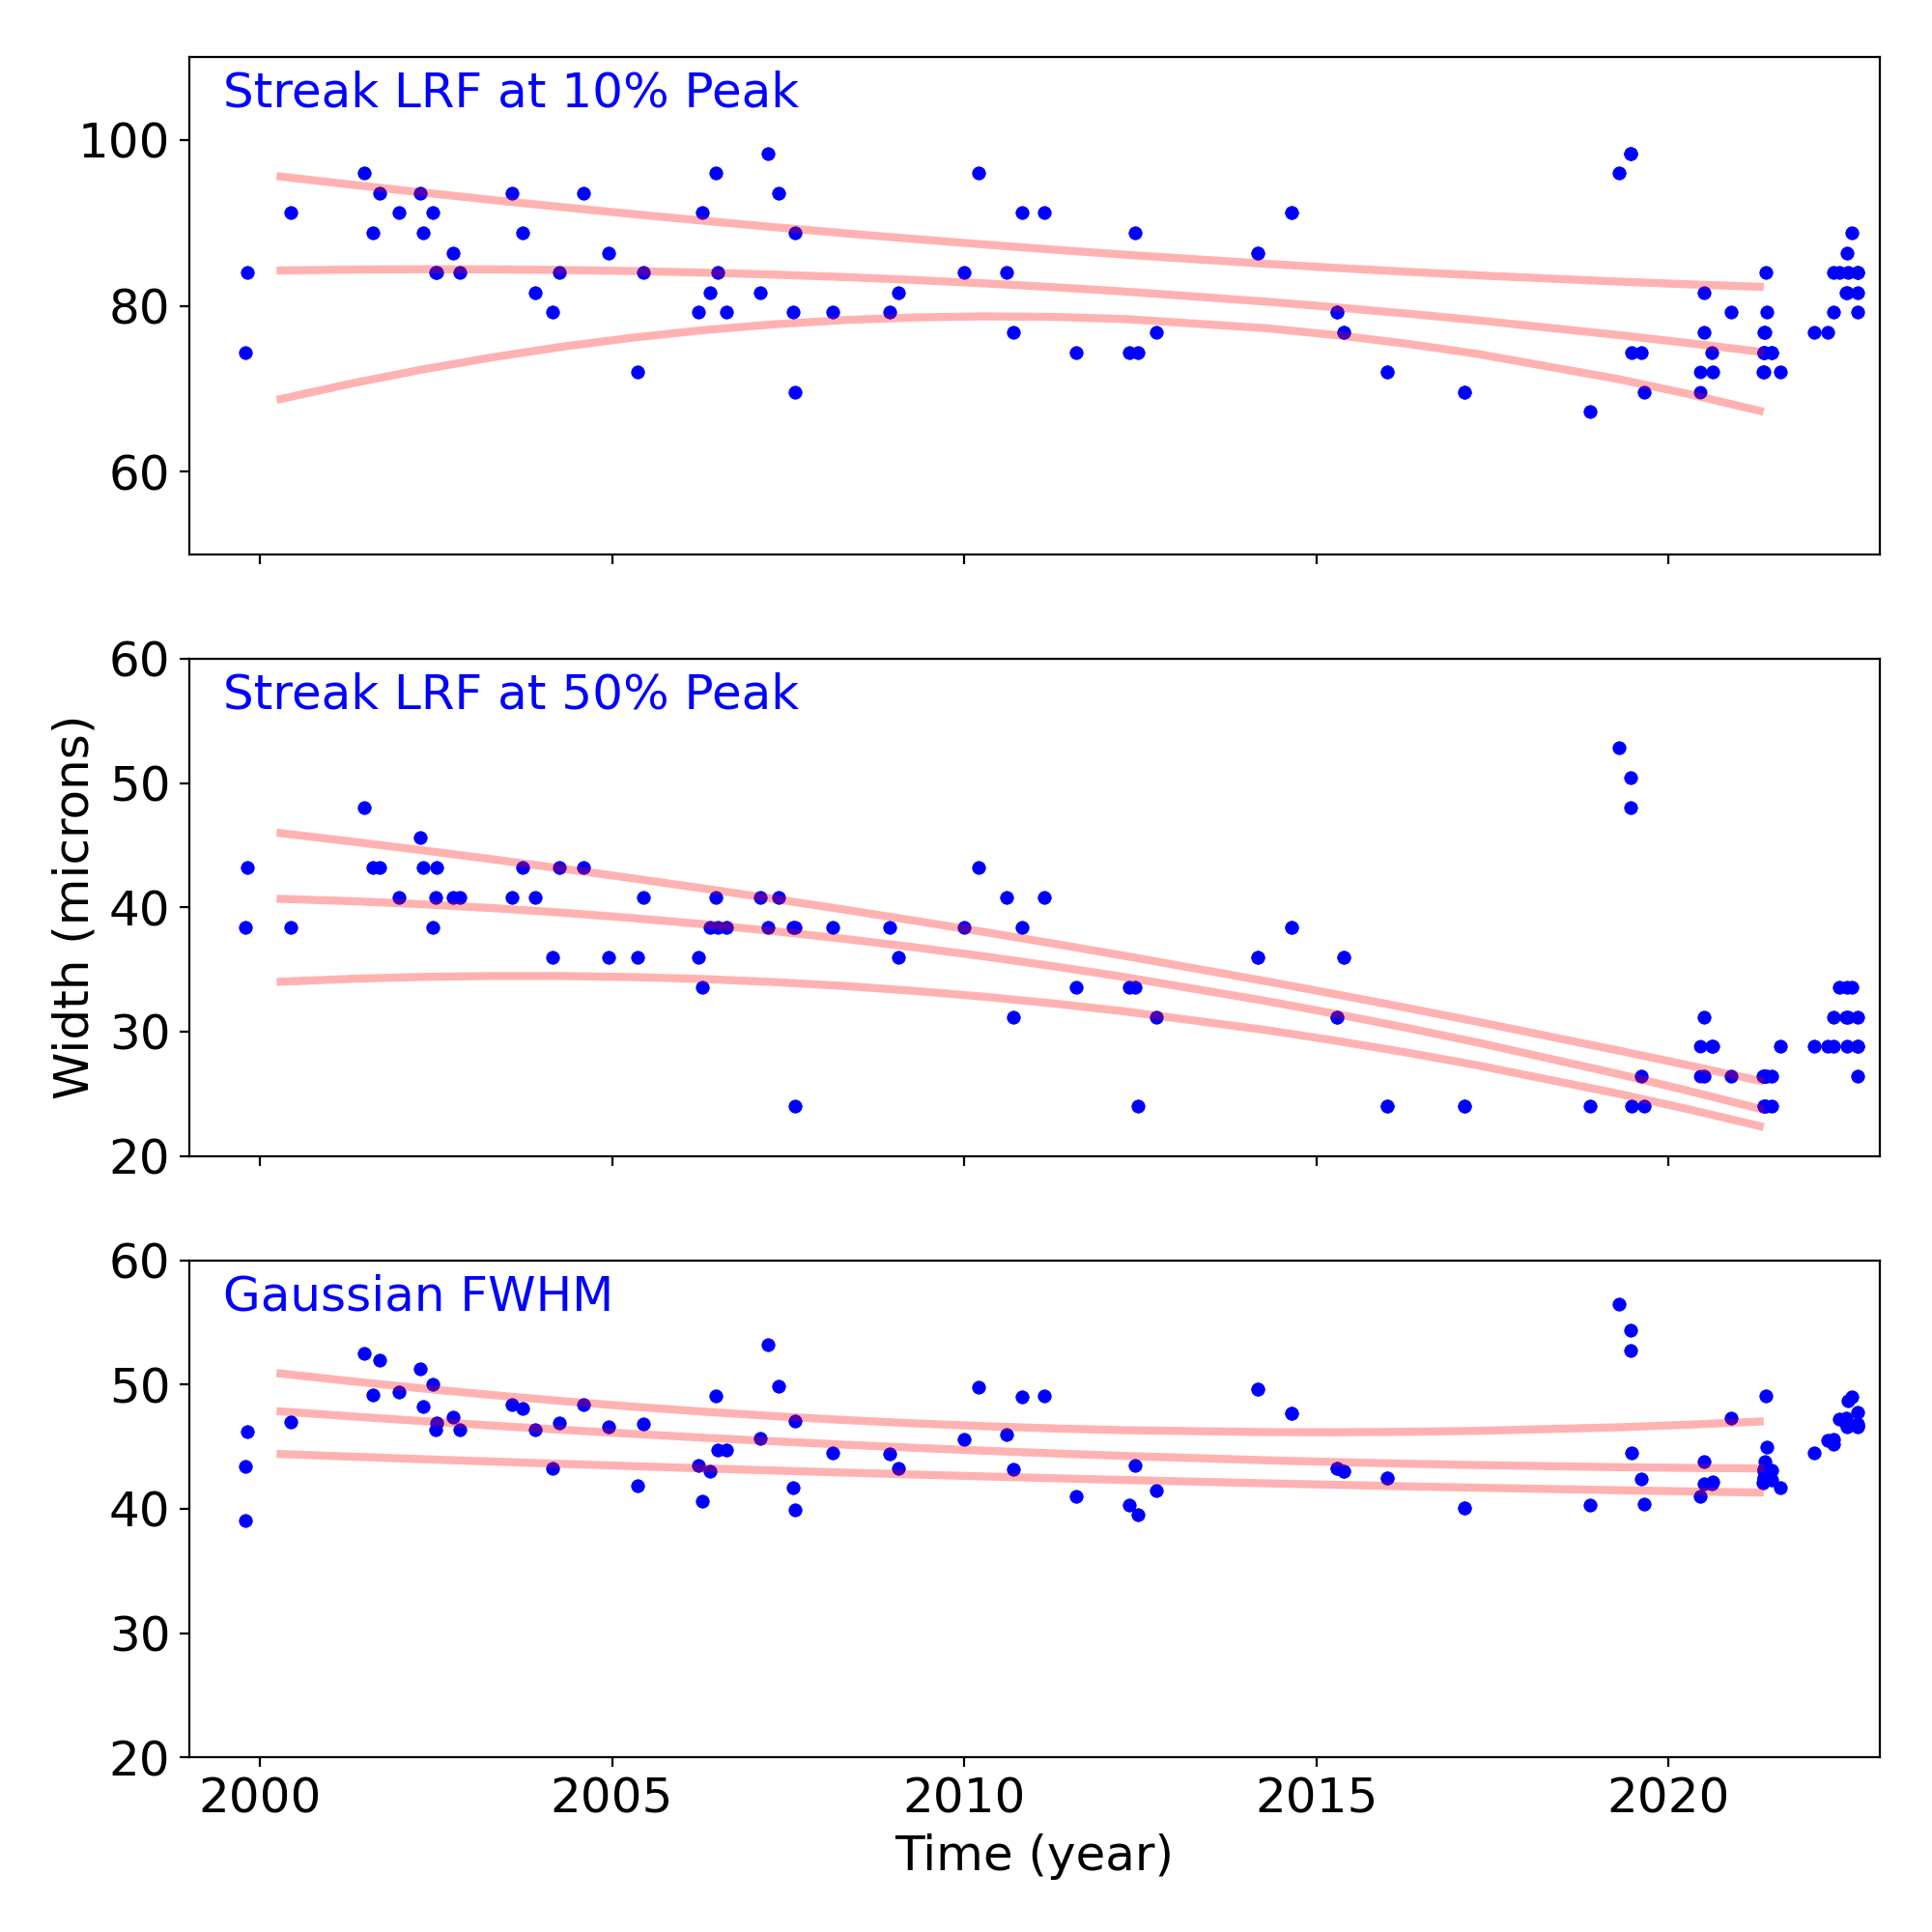
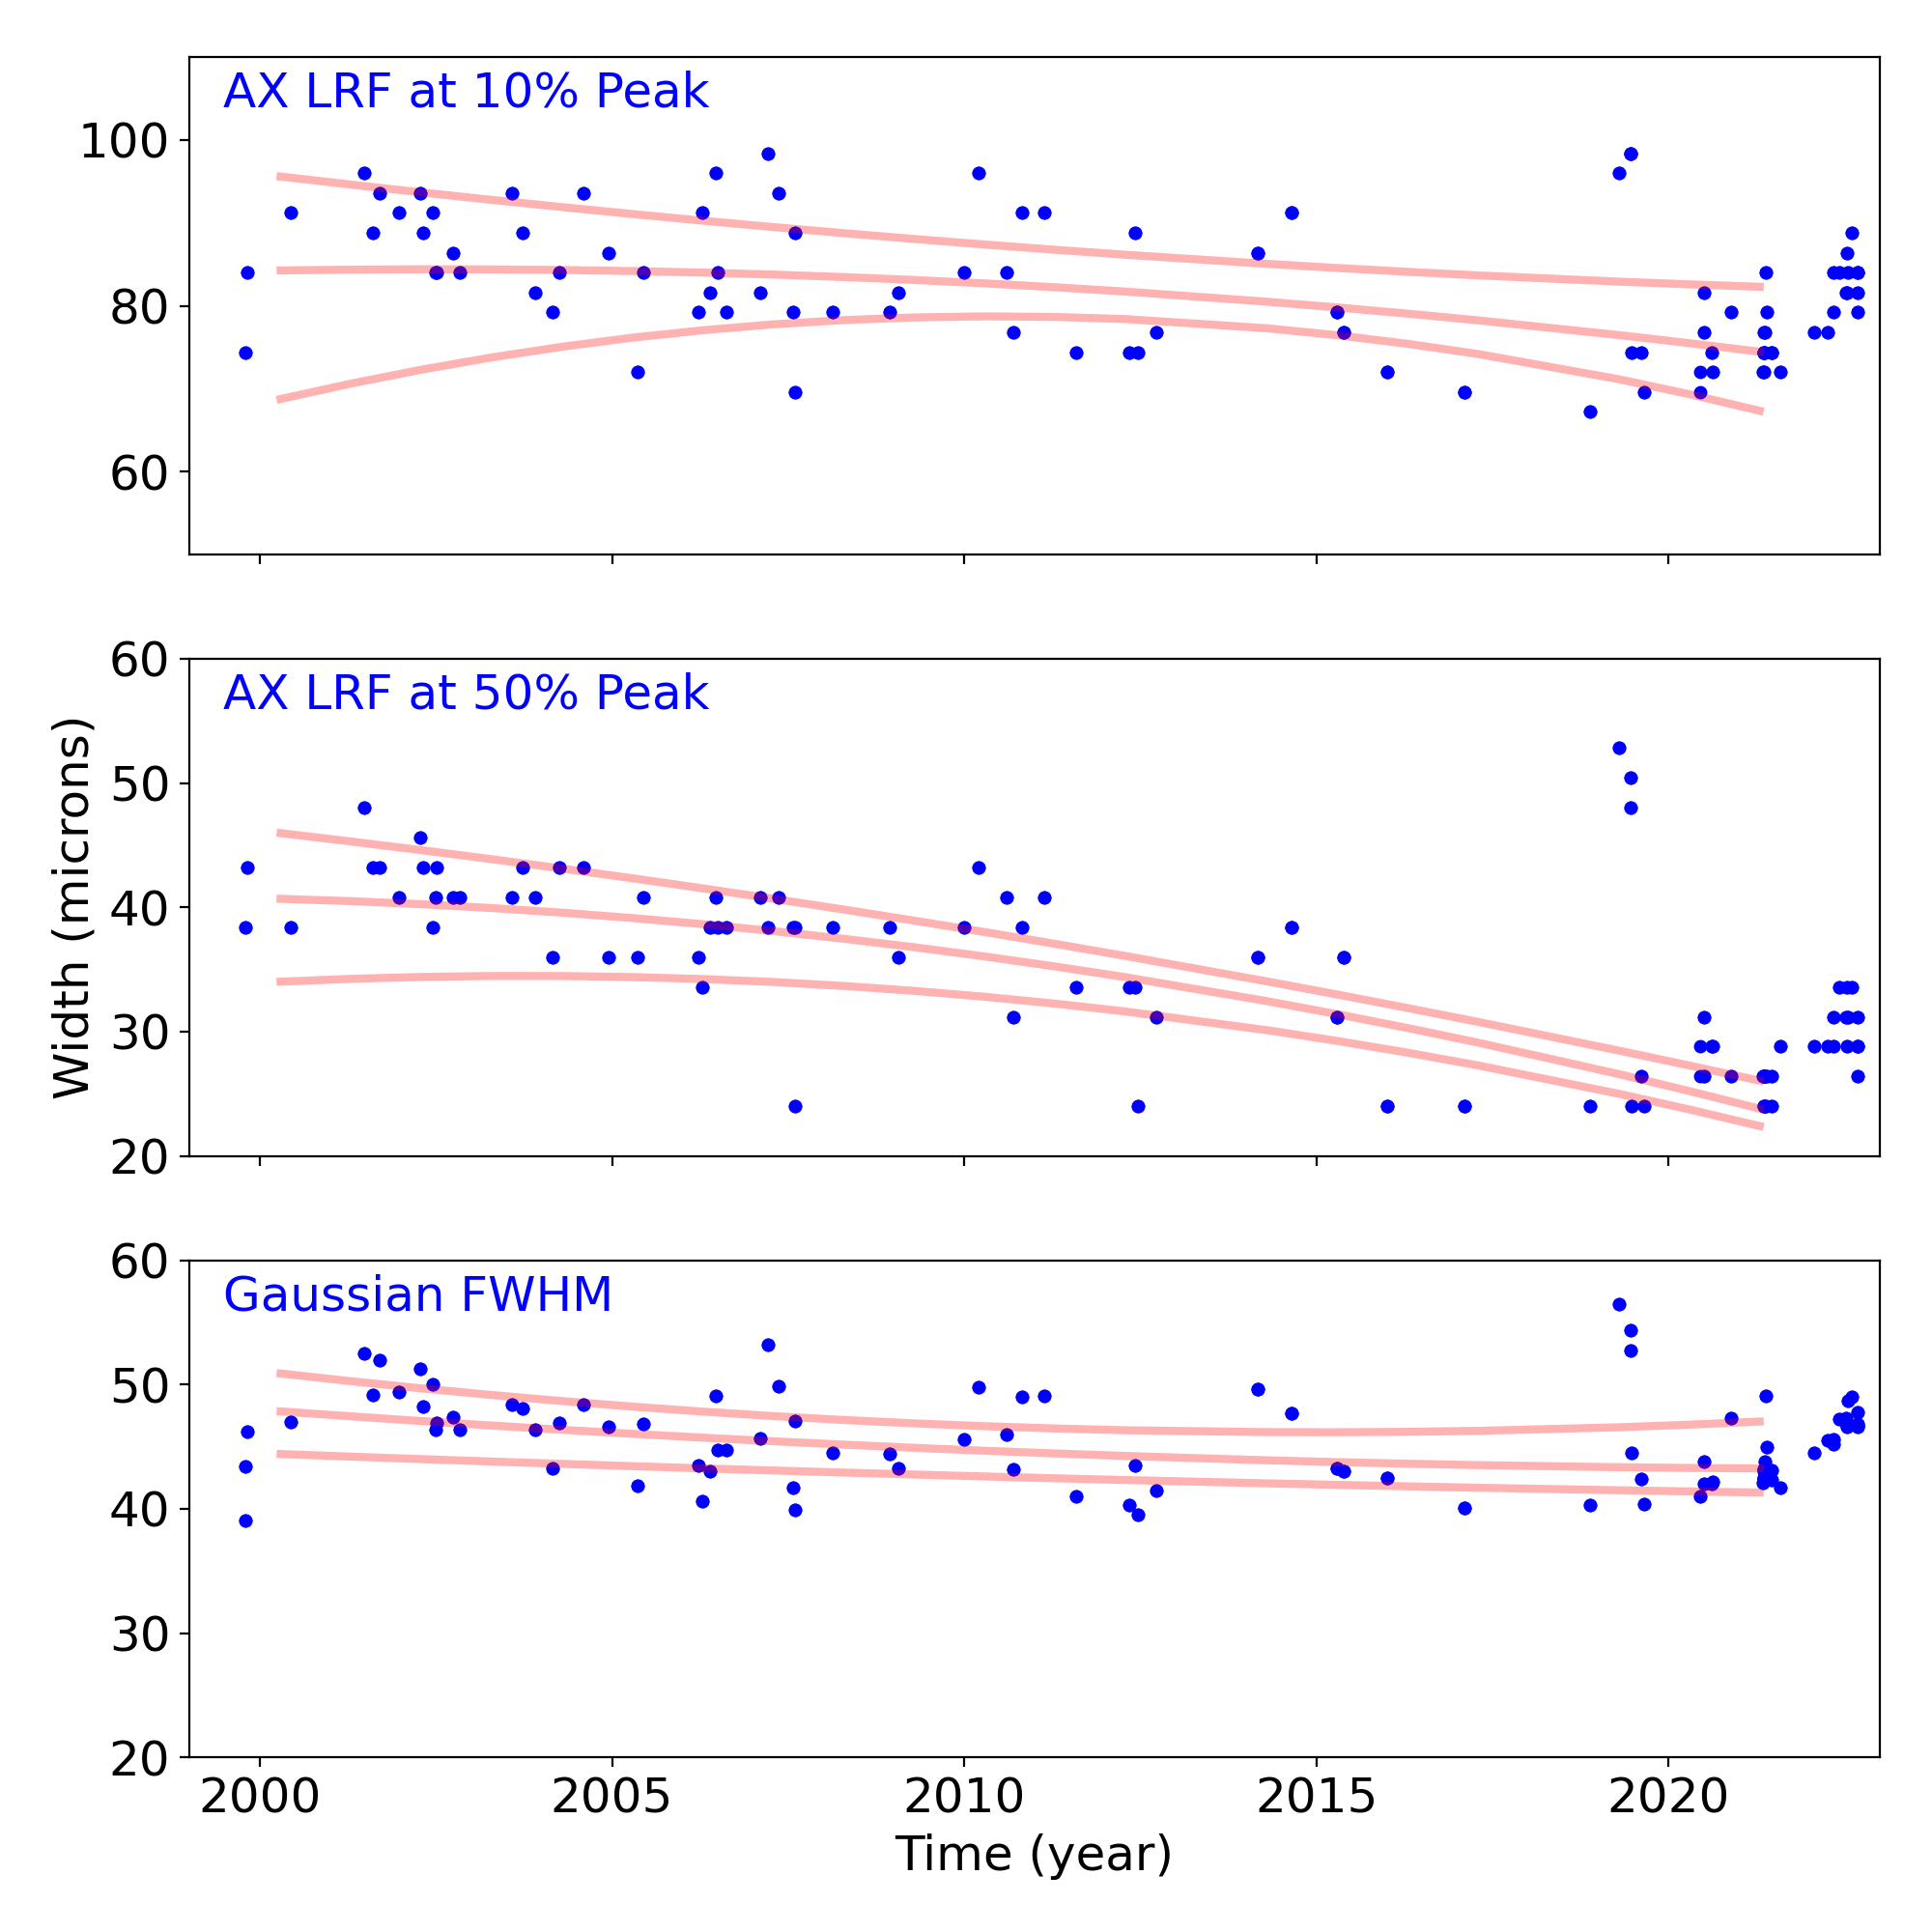
Grating Trends/Focus
We plot the width of the zero order streak of ACIS/HETG observations and the width of the zero order image for HRC/LETG observations of point sources. No significant defocusing trend is seen at this time. See Gratings Trends pages.
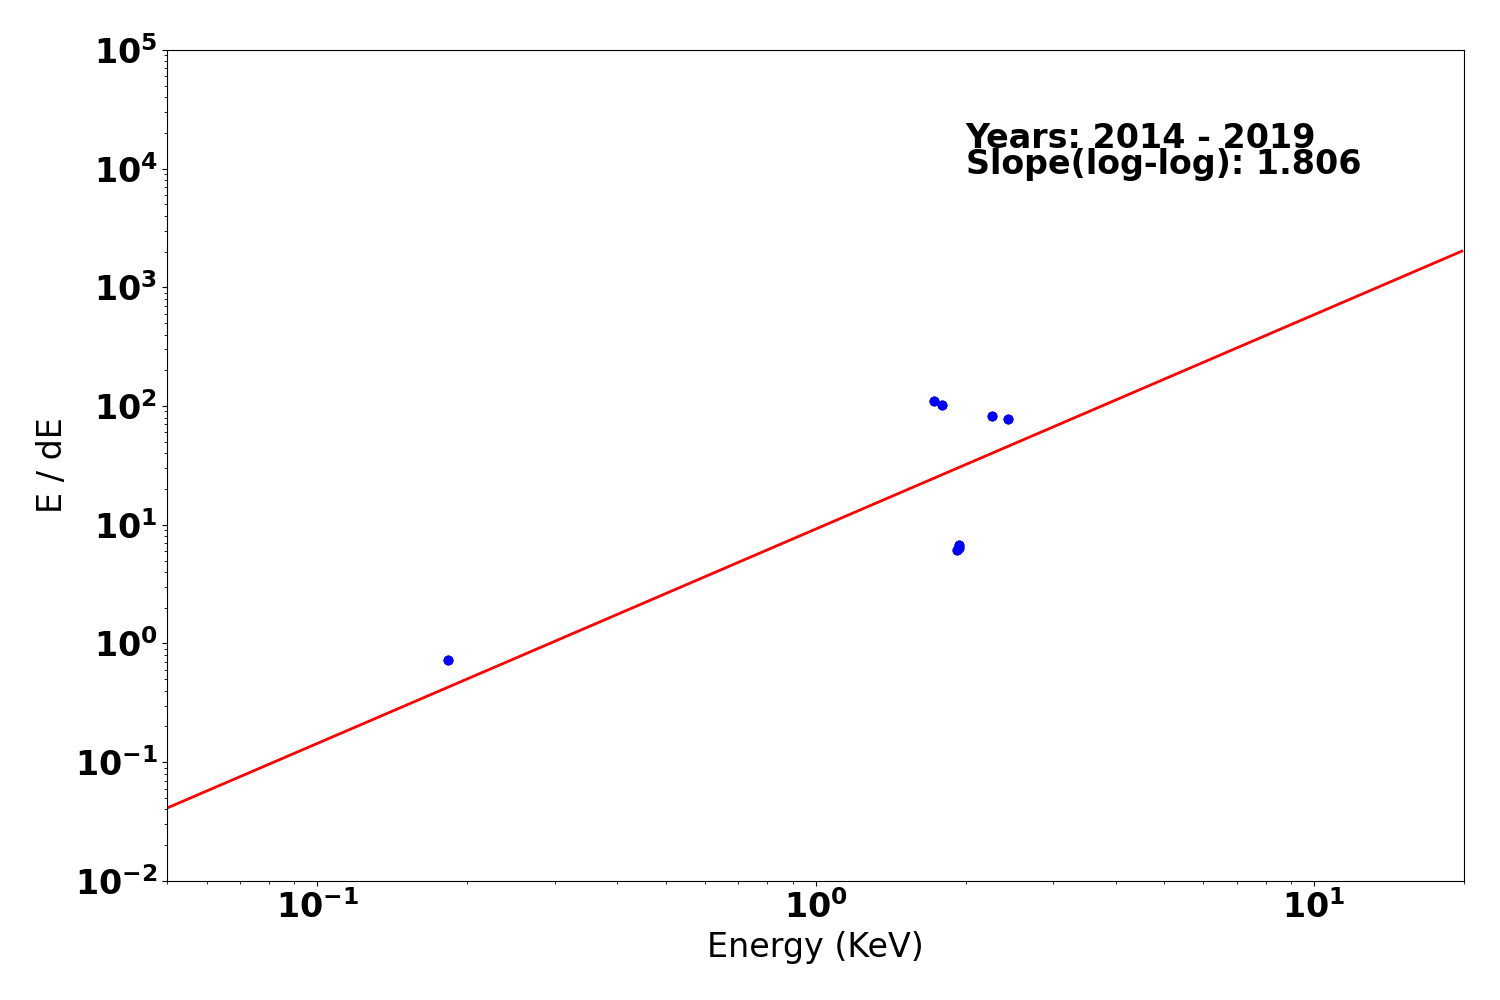
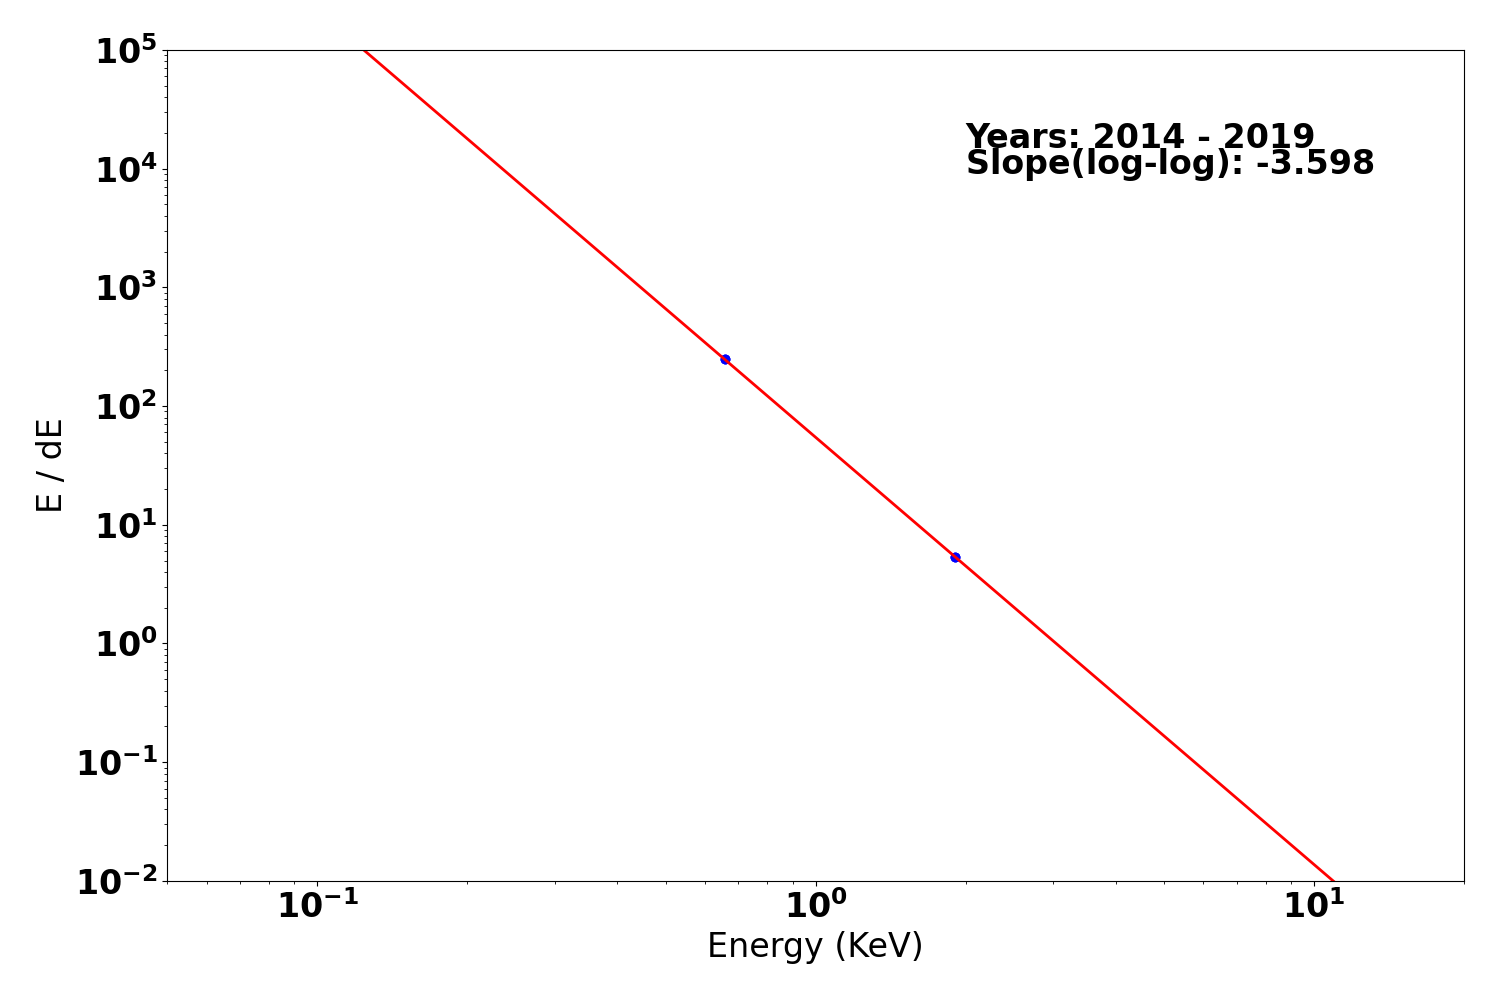
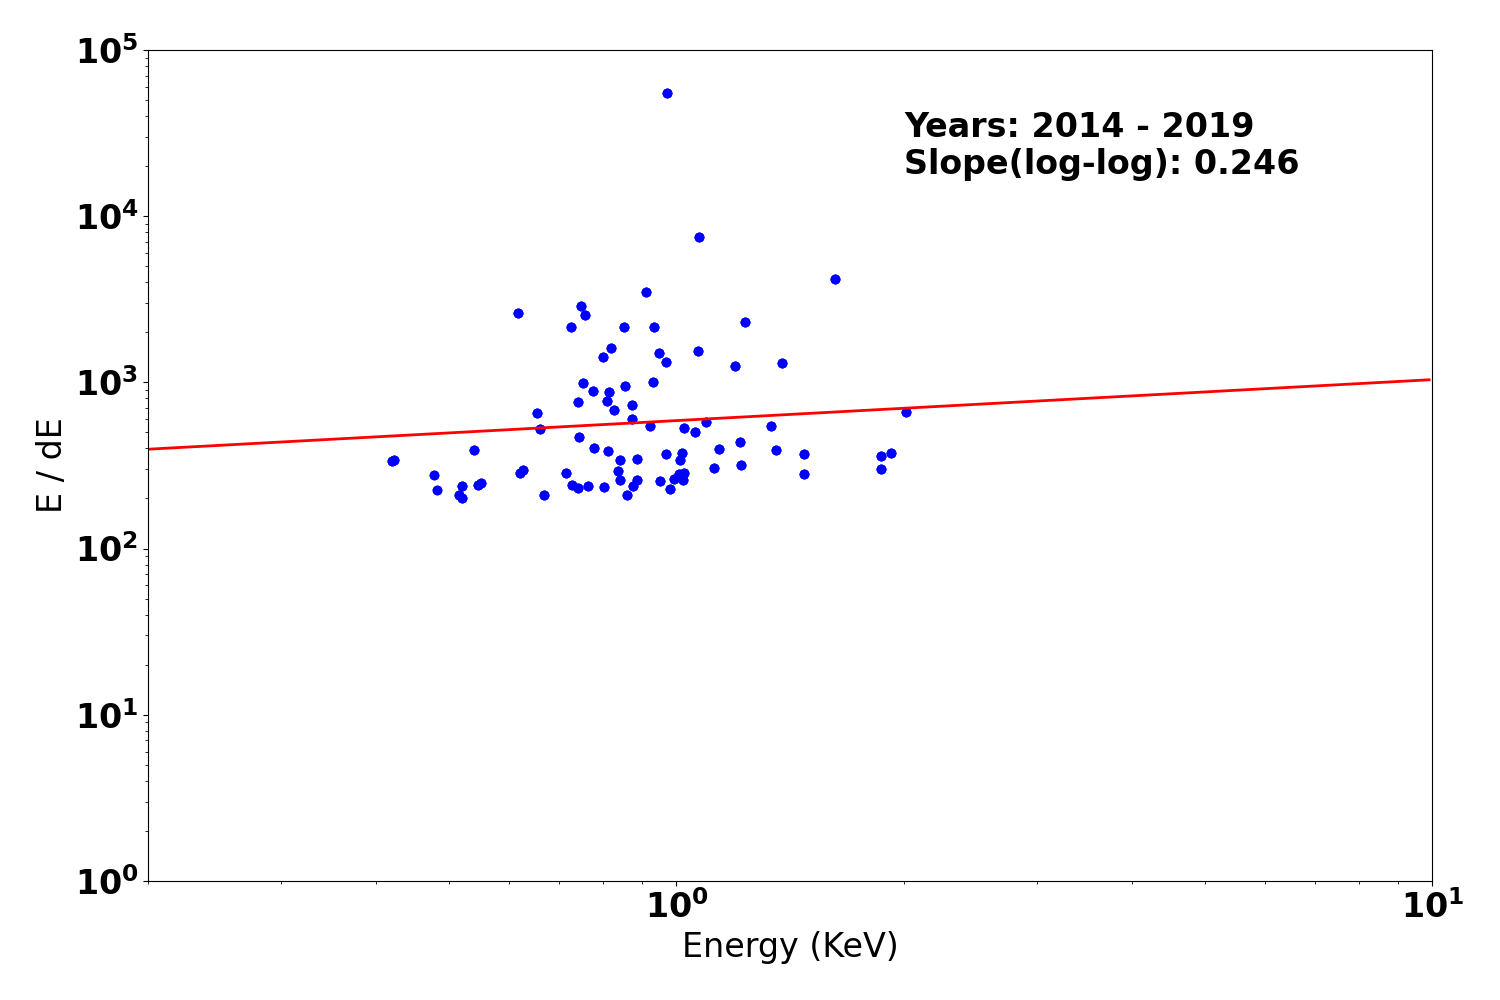
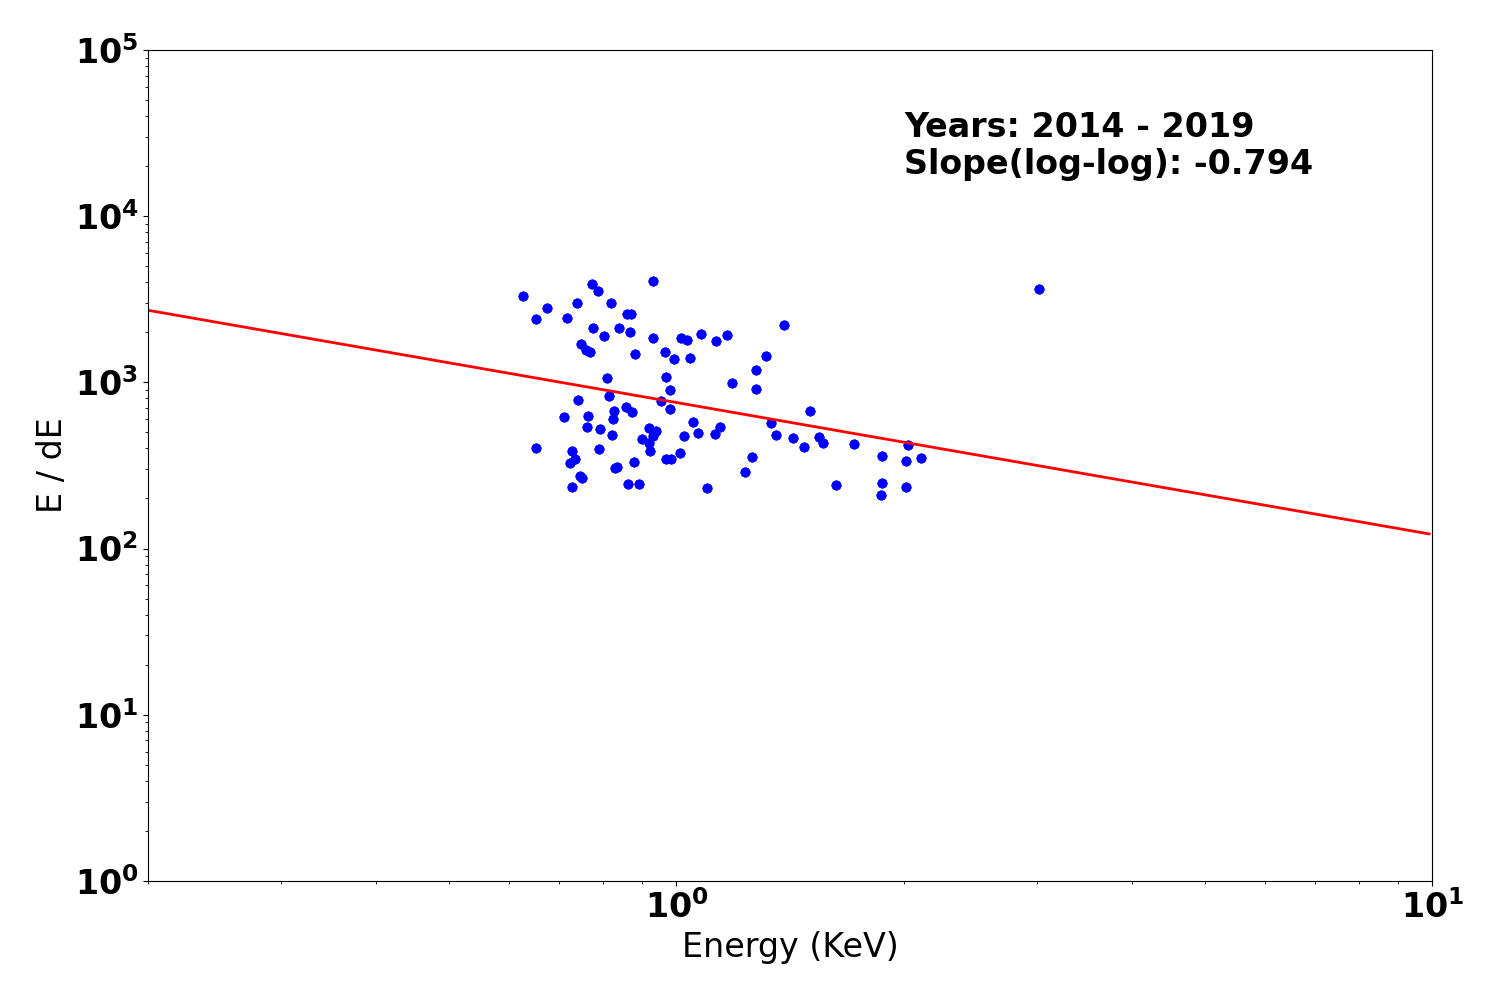
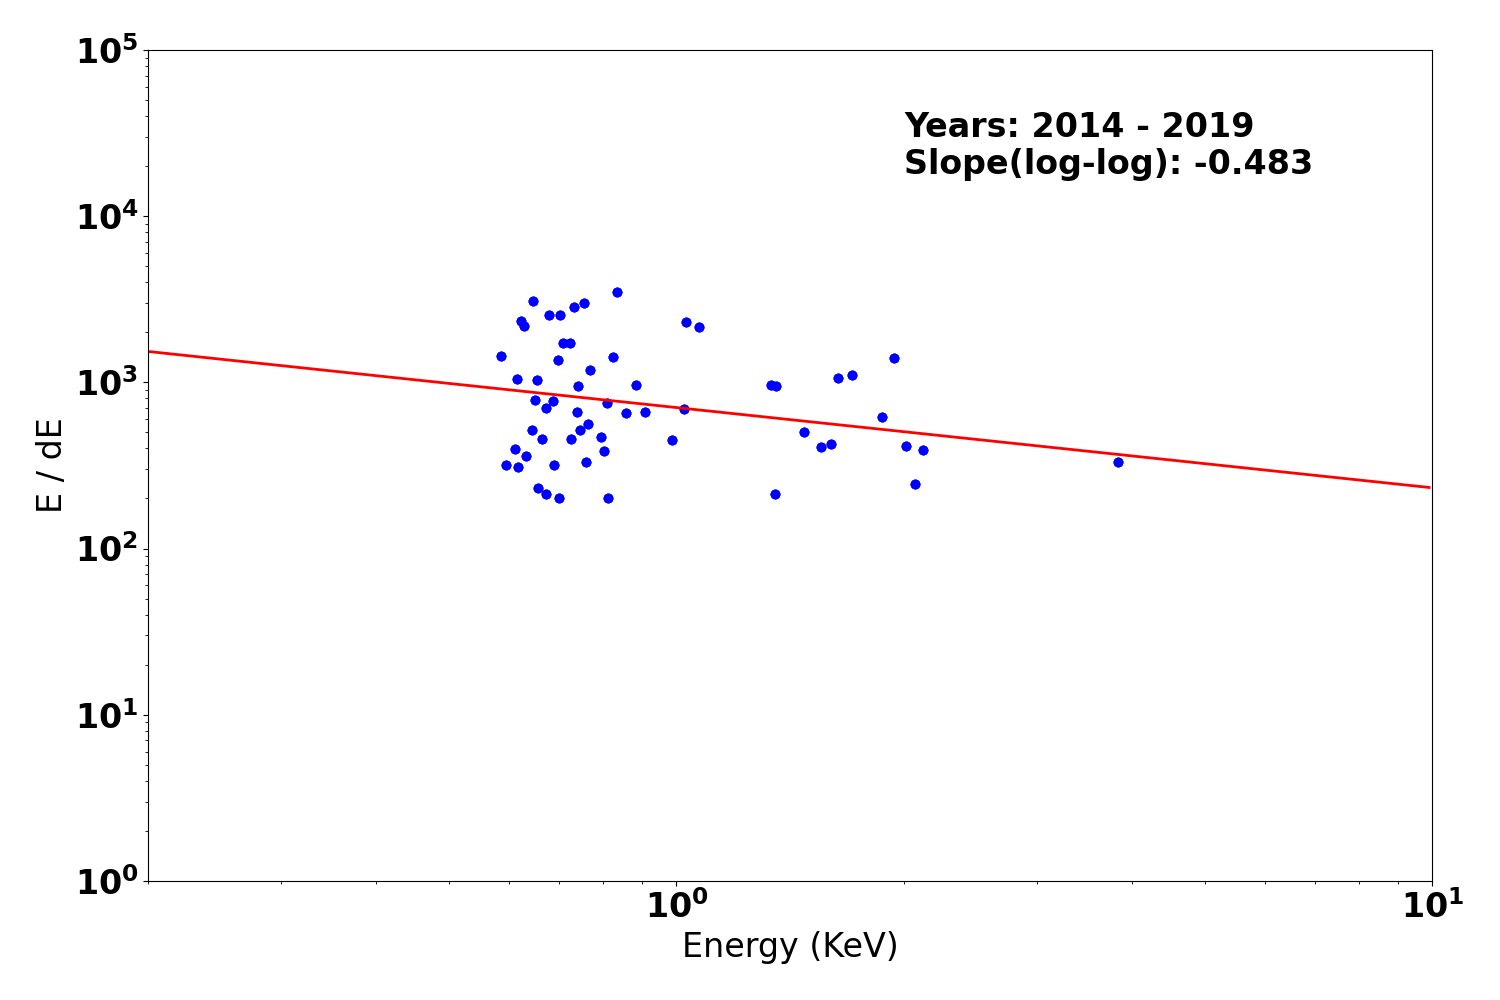
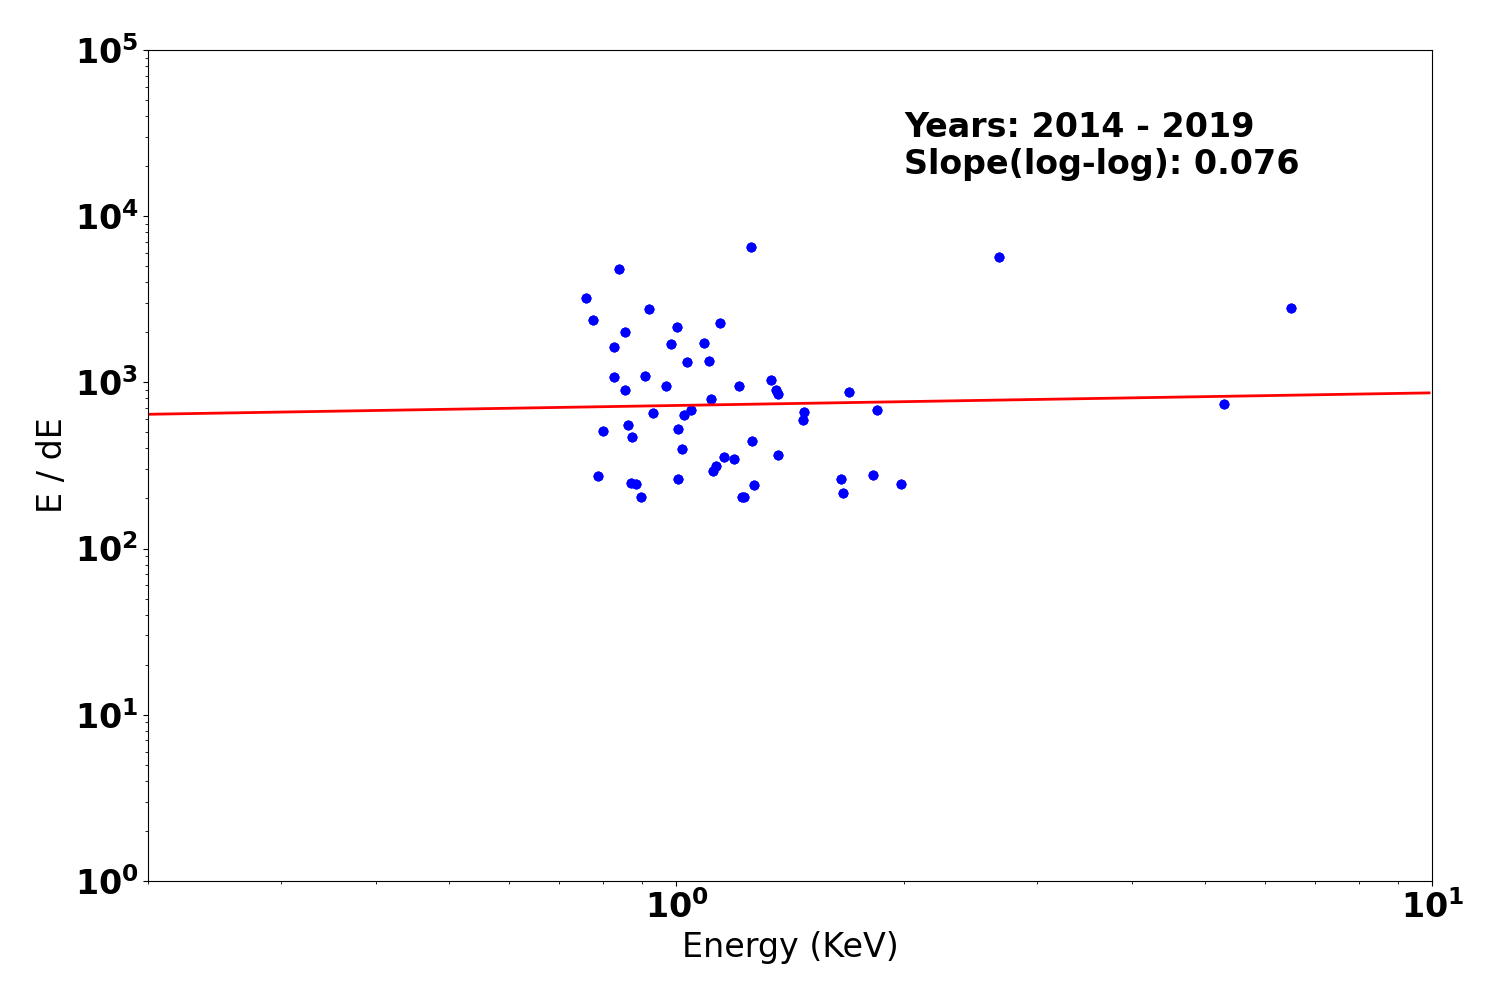
Gratings Resolving Power
We plot E/dE vs. E for fits to detected lines with fwhm_error/fwhm less than 0.15 for the plus and minus arms of HEG, MEG, and LEG. Also shown are conservative (dotted line) and optimistic (dashed line) pre-launch resolving power expectations.
We have selected only calibration observations of Capella, HR1099, and Sigma Gem. See MIT technotes for a parallel analysis.
| Year 2014 - | |
|---|---|
| Letg minus side | Letg plus side |
 |
 |
| Metg minus side | Metg plus side |
 |
 |
| Hetg minus side | Hetg plus side |
 |
 |
PCAD
ACA Trending
| ACIS |
)
|
)
|
)
|
|
|---|---|---|---|---|
)
|
)
|
)
| ||
| HRCI |
)
|
)
|
)
|
)
|
| HRCI |
)
|
)
|
)
|
)
|
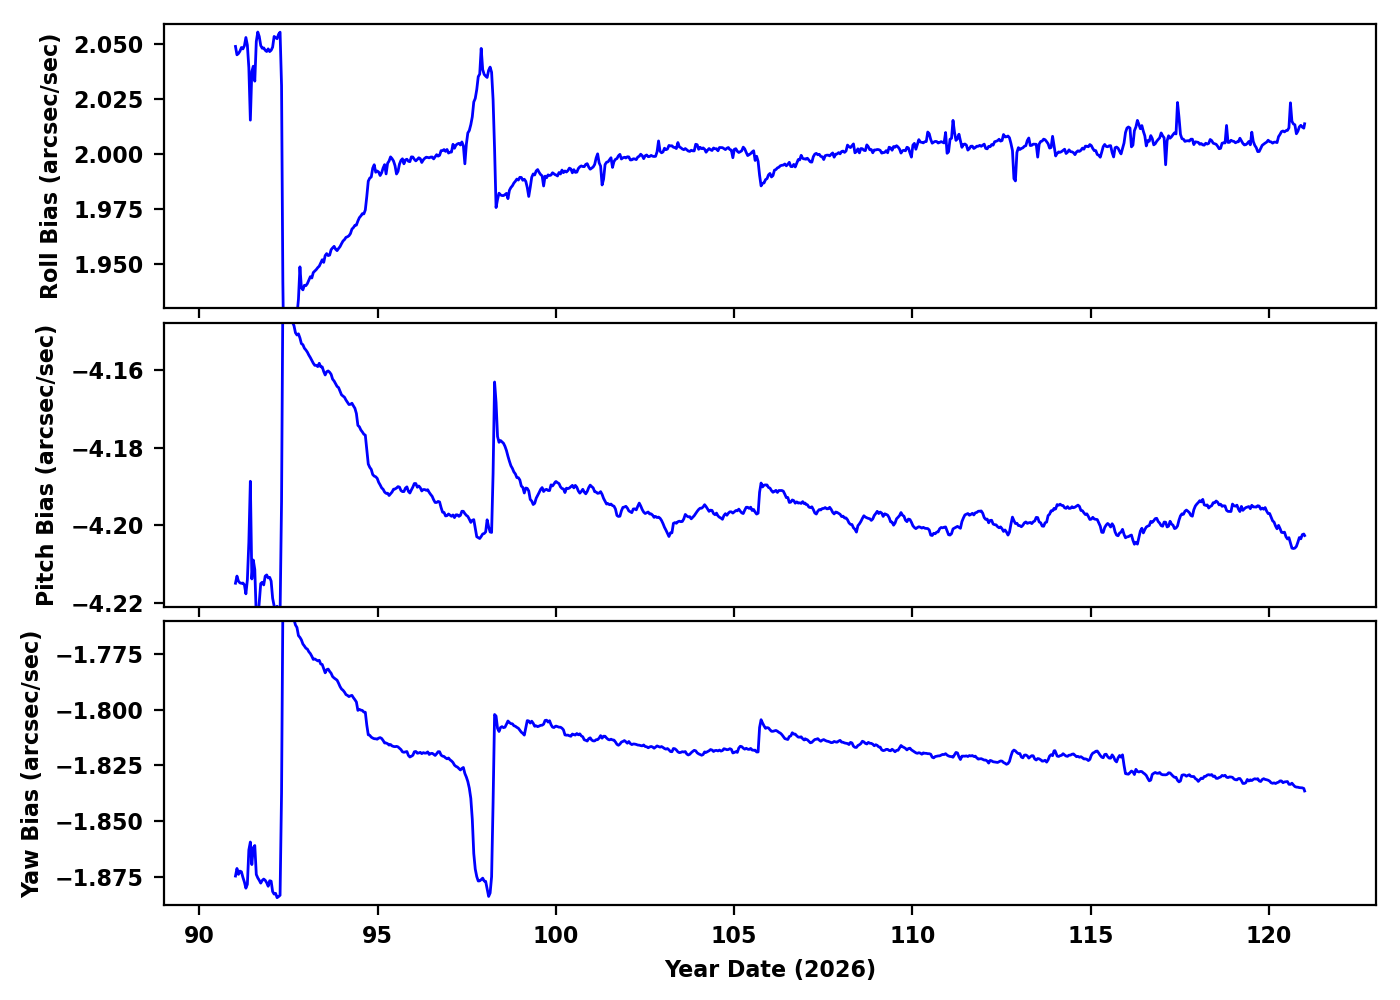
Gyro Bias Drift
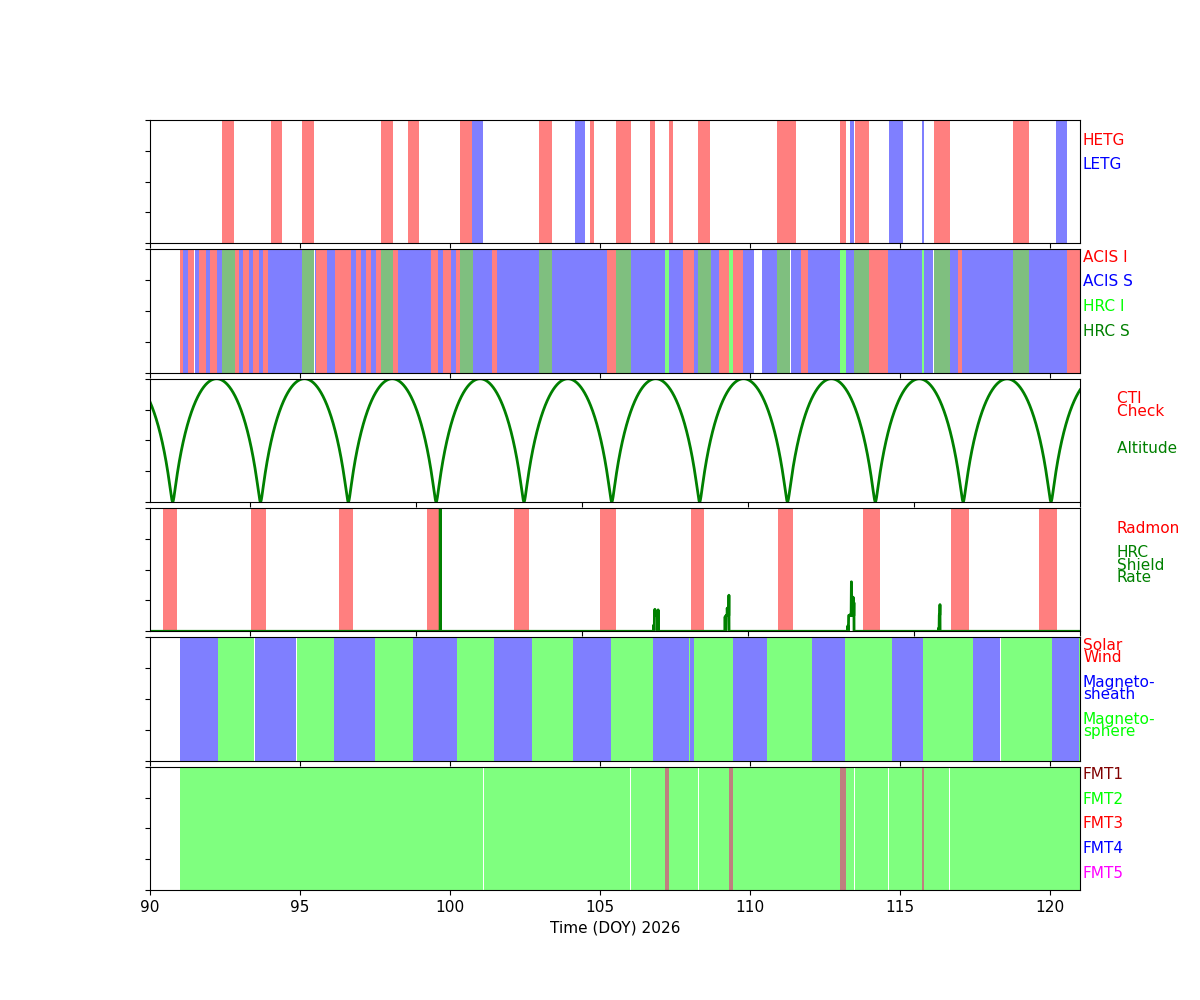
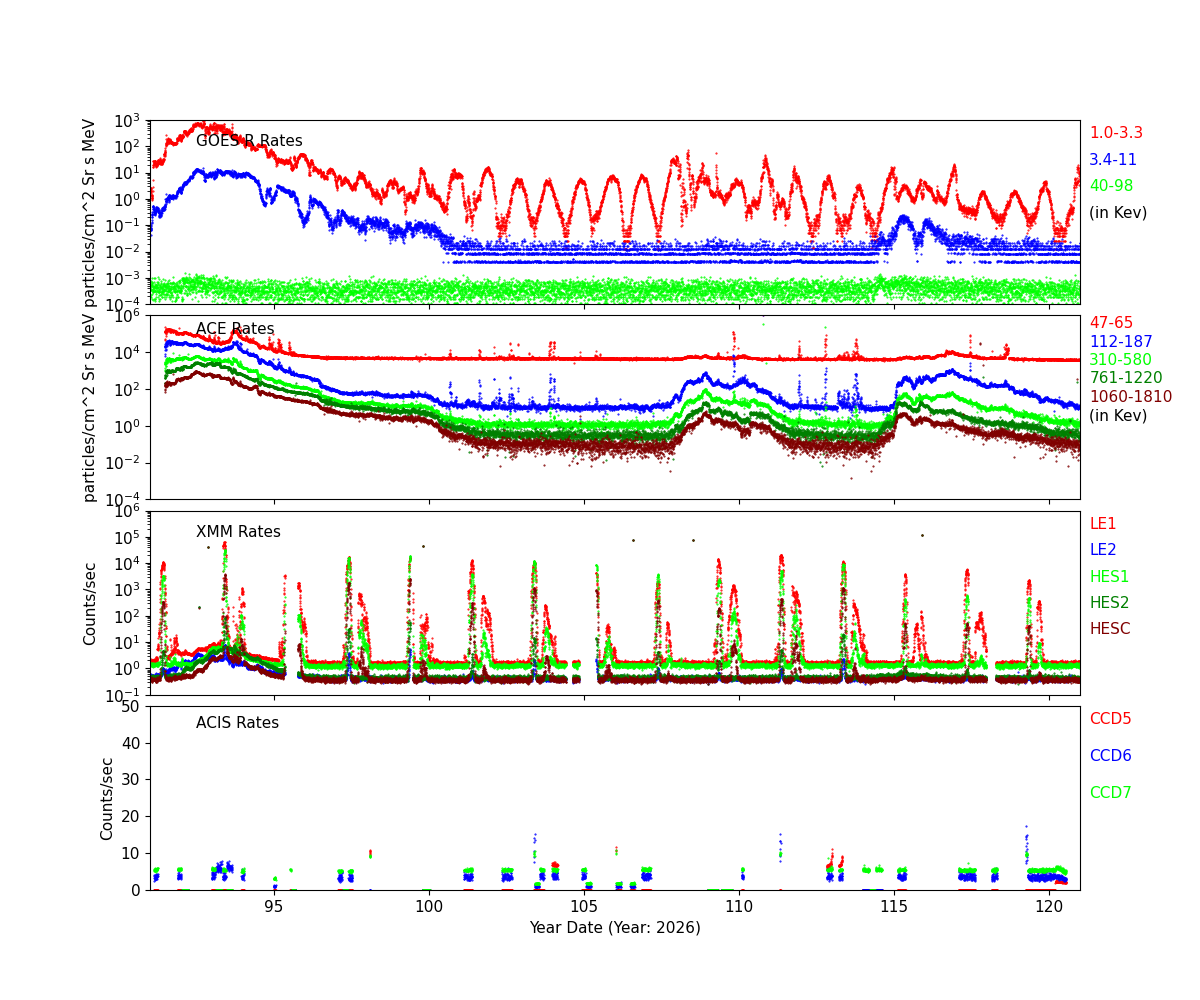
Radiation History
Radiation Count Rates of Apr 2026
Sun Spot History (See:NOAA Page)

SIM
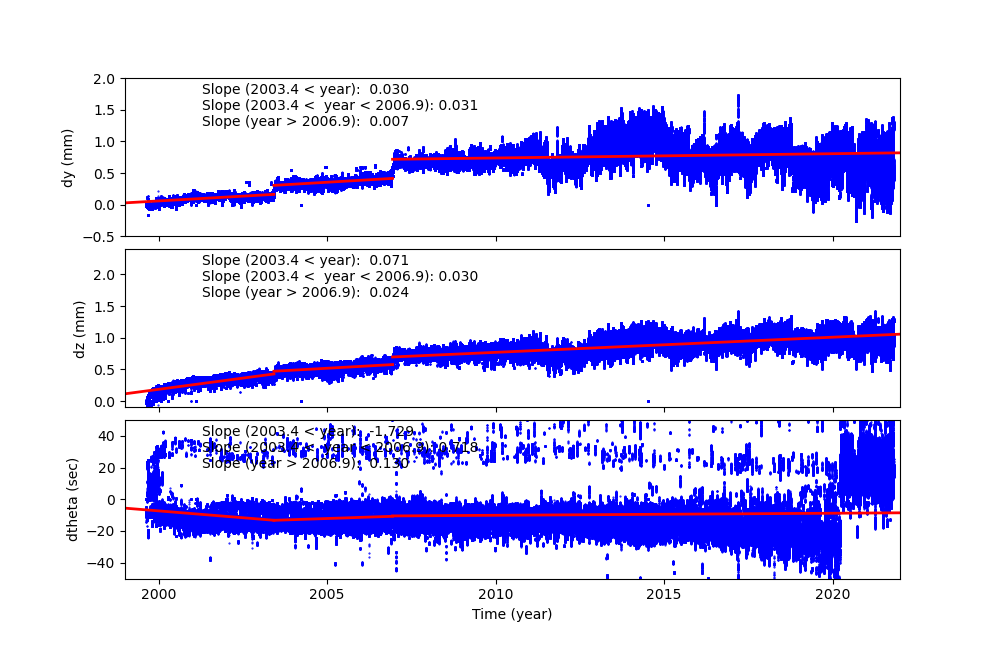
SIM Shift and Twist
SIM Shift and Twist Trend The following plots show trends of SIM shifts (dy and dz) and twist (dtheta). All quantities are directly taken from pcaf*_asol1.fits files. The units are mm for dy and dz, and degree for dtheta. We fit three lines separated before and after (Days of Mission)= 1400 (May 21, 2003), 2700 (Dec 11, 2006), and 4400 (Aug 07, 2011). The unit of slopes are mm per day or degree per day.
The sudden shift around DOM = 1400, 2700 and 4400 are due to fid light drift (see a memo by Aldcroft fiducial light drift). On the dtheta plot, two tracks are clearly observed. The track around 0.01 is due to HRC-I, and all others are clustered around -0.002. For more detail, please see SIM Shift and Twist Trend page
Trending
Quarterly Trends
- EPS Batteries
| Previous Quarter | |||||||
| MSID | MEAN | RMS | DELTA/YR | DELTA/YR/YR | UNITS | DESCRIPTION | |
| eb2ci | off | -1.762e-04 | 5.337e-05 | 0.27 +/- 0.12 | 0.01 +/- 0.01 | AMP | BATT 2 CHARGE CURRENT | on | 0.001 | 0.007 | 0.26 +/- 0.01 | (0.00+/-0.00)e0 |
|---|---|---|---|---|---|---|---|
| eb2di | off | -1.924e-04 | 1.073e-04 | 0.03 +/- 0.25 | 0.02 +/- 0.02 | AMP | BATT 2 DISCHARGE CURRENT | on | 1.371 | 0.771 | 0.26 +/- 1.19 | (0.00+/-0.00)e0 |
| eb2v | off | -3.396e-04 | 6.320e-05 | 32.24 +/- 0.15 | -0.01 +/- 0.02 | V | BATT 2 VOLTAGE | on | -0.486 | 0.268 | 32.11 +/- 0.41 | (0.00+/-0.00)e0 |
| ecnv1v | -1.079e-05 | 4.406e-06 | 14.89 +/- 0.01 | 0.00 +/- 0.00 | V | CONV 1 +15V OUTPUT | |
| ecnv2v | -2.270e-05 | 4.581e-06 | 14.84 +/- 0.01 | -0.01 +/- 0.00 | V | CONV 2 +15V OUTPUT | |
| ecnv3v | -4.669e-06 | 2.609e-06 | 15.26 +/- 0.01 | 0.00 +/- 0.00 | V | CONV 3 +15V OUTPUT | |
- Spacecraft Electronics
| Previous Quarter | |||||||
| MSID | MEAN | RMS | DELTA/YR | DELTA/YR/YR | UNITS | DESCRIPTION | |
| elbi | 0.004 | 5.412e-04 | 52.77 +/- 1.28 | 0.09 +/- 0.16 | AMP | LOAD BUS CURRENT | |
|---|---|---|---|---|---|---|---|
| elbv | off | -0.001 | 2.096e-04 | 26.90 +/- 0.12 | -15.32 +/- 2.58 | V | LOAD BUS VOLTAGE | on | 0.007 | 0.003 | 27.71 +/- 0.36 | (0.00+/-0.00)e0 | open | 0.004 | 6.854e-05 | 26.93 +/- 0.22 | 0.01 +/- 0.02 | clos | 0.603 | 0.427 | 26.91 +/- 0.64 | (0.00+/-0.00)e0 |
- OBA Heater
| Previous Quarter | |||||||
| MSID | MEAN | RMS | DELTA/YR | DELTA/YR/YR | UNITS | DESCRIPTION | |
| oobthr04 | -0.019 | 8.217e-04 | (3.05+/-0.02)e2 | 1.08 +/- 0.57 | K | RT 27: HRMA STRUT | |
|---|---|---|---|---|---|---|---|
| oobthr12 | -0.021 | 0.001 | (3.04+/-0.03)e2 | 1.07 +/- 0.87 | K | RT 35: OBA CONE | |
| oobthr26 | -0.024 | 0.002 | (3.09+/-0.04)e2 | 1.21 +/- 1.27 | K | RT 48: OBA CONE | |
| oobthr38 | 2.911e-05 | 5.927e-06 | (2.72+/-0.00)e2 | (6.51+/-23.20)e-4 | K | RT 60: TFTE CONE | |
| oobthr44 | -0.023 | 0.001 | (3.06+/-0.03)e2 | 0.88 +/- 0.95 | K | RT 66: TFTE COVER | |
| oobthr50 | -0.019 | 9.762e-04 | (3.02+/-0.02)e2 | 1.11 +/- 0.74 | K | RT 76: S/C STRUT | |
Spacecraft Motions
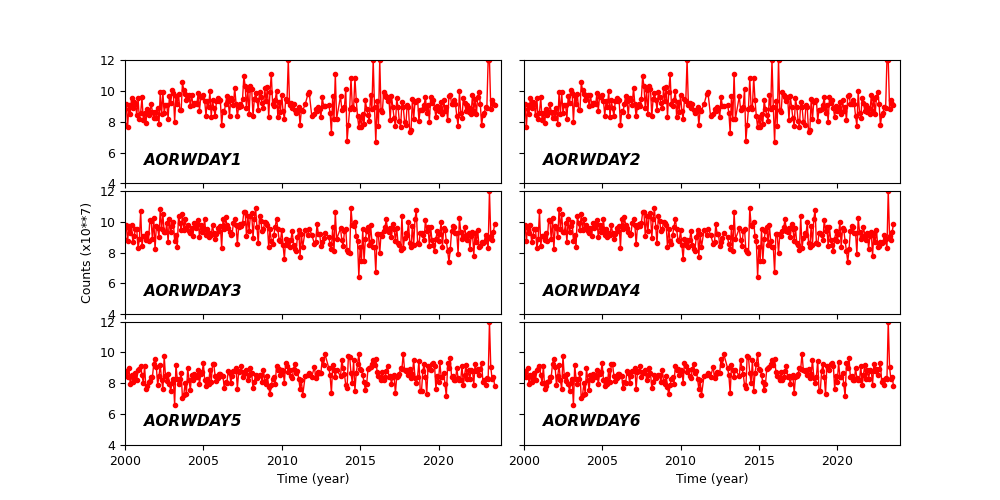
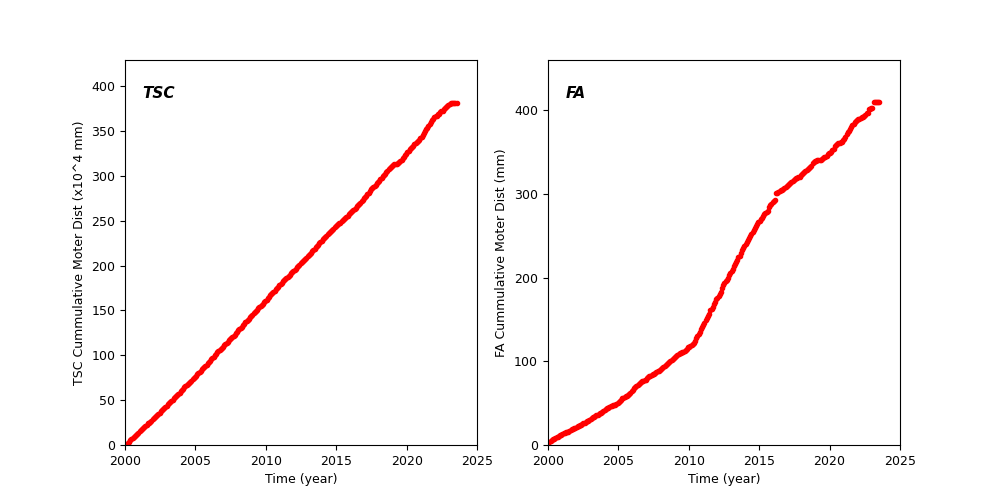
TSC and FA Cummulative Moter Distance
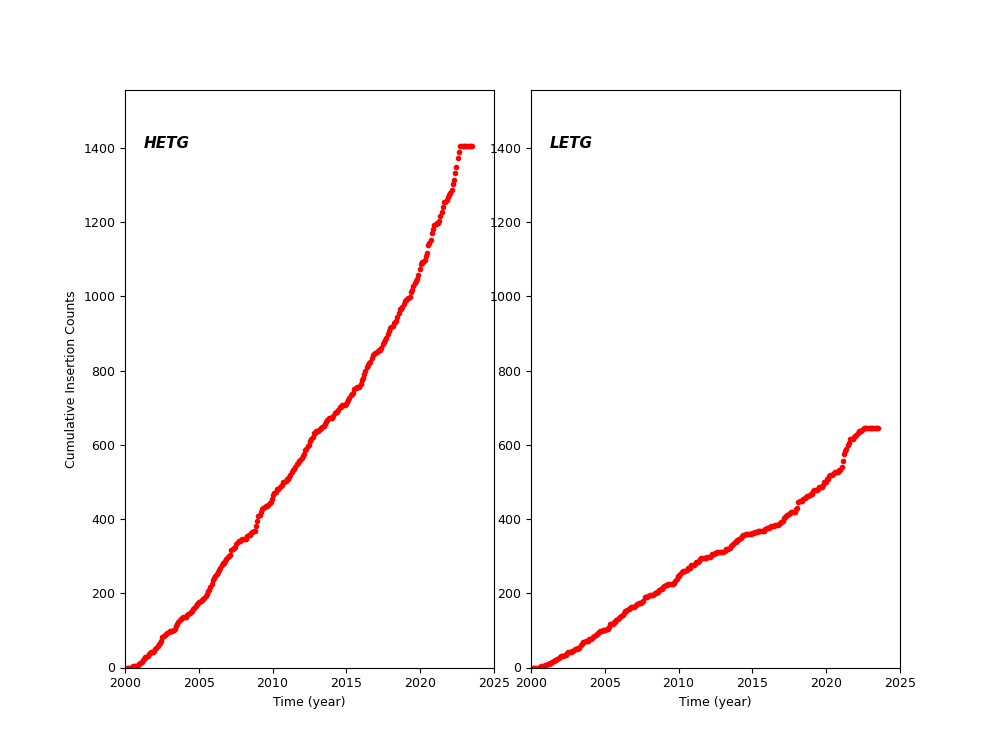
HETG and LETG Cummulative Insertion Counts
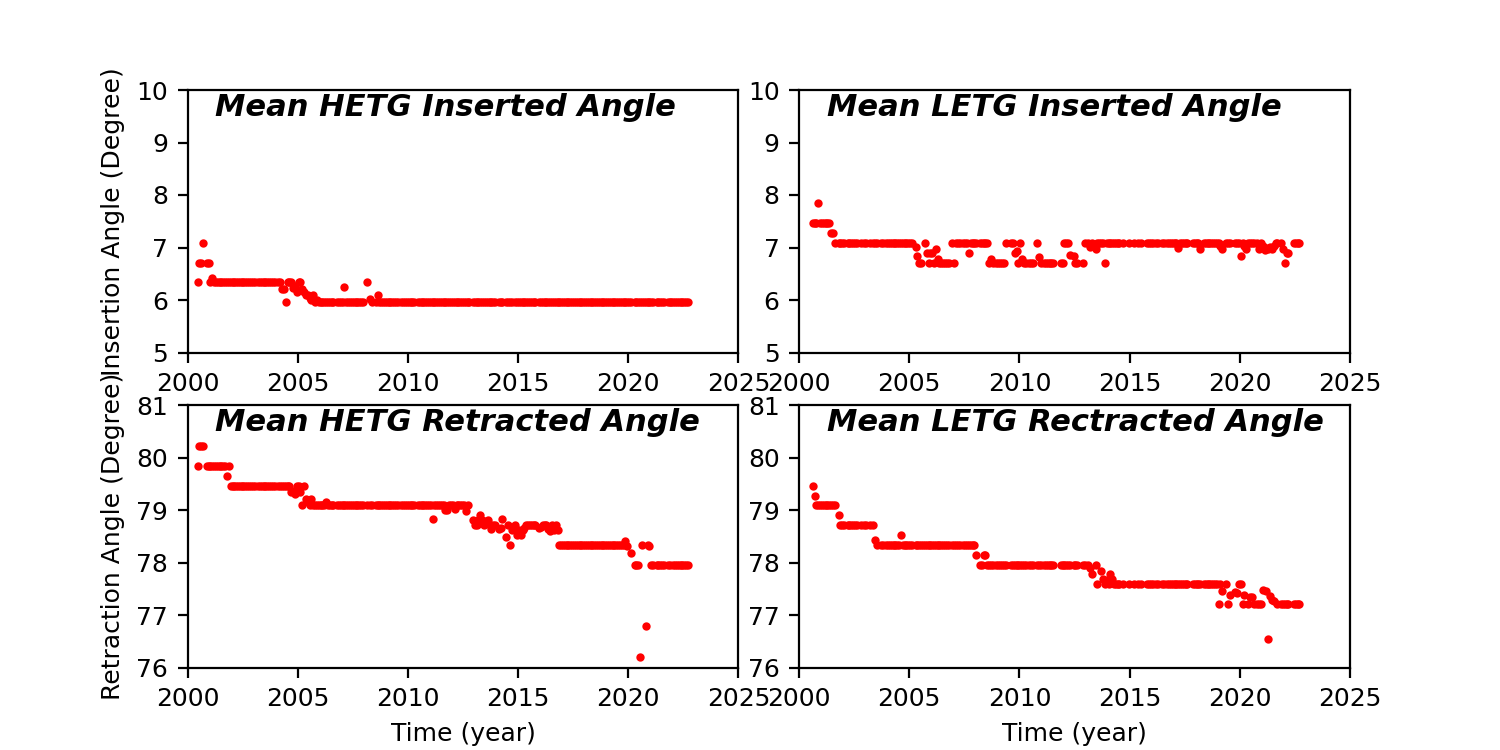
HETG/LETG Insertion/Retraction Angle
Reaction Wheel Rotations