| CCD0 | CCD1 | CCD2 | CCD3 | CCD4 | CCD5 | CCD6 | CCD7 | CCD8 | CCD9 | |
|---|---|---|---|---|---|---|---|---|---|---|
| Previously Unknown Bad Pixels | ||||||||||
| Current Warm Pixels | (910,239) (802,665) (985,393) | (526,66) (803,225) (837,378) (178,149) (99,899) | (21,95) | |||||||
| Flickering Warm Pixels | (786,117) (171,937) | (427,125) | (665,25) (726,537) (104,31) | (931,553) (318,53) (811,637) (617,159) (680,391) (394,80) | (369,376) (367,511) (233,227) (263,317) (357,303) (161,206) | (884,31) (849,169) (1000,214) (670,387) | (368,231) (335,412) | (220,813) (136,65) (675,304) (838,239) (597,187) (295,978) (275,393) (182,474) | ||
| Current Hot Pixels | ||||||||||
| Flickering Hot Pixels | ||||||||||
| Warm column candidates | 1022 512 510 | 1022 512 | ||||||||
| Flickering Warm column candidates |
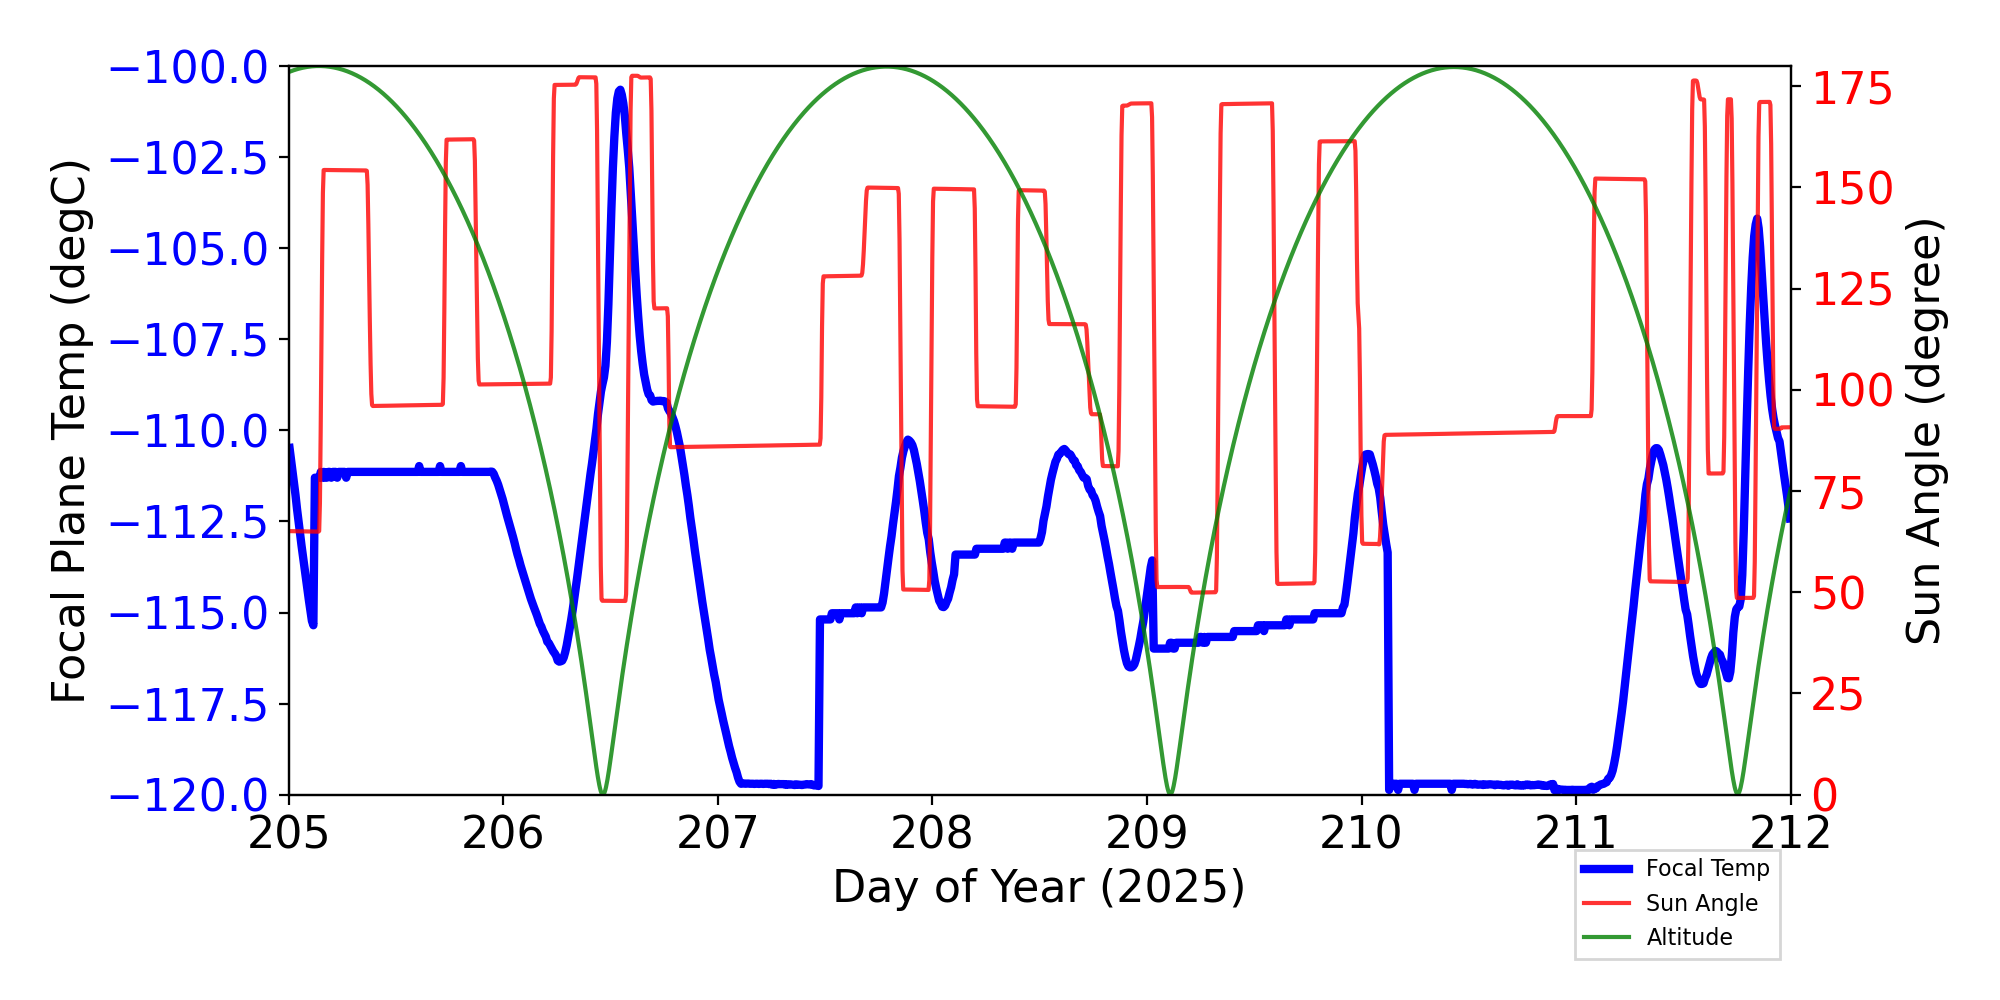
ACIS Focal Plane Temperature
For this period, 4 peaks are observed.
| Day (DOY) | Temp (C) | Width (Days) | |
|---|---|---|---|
| 204.93 | -108.22 | 1.83 | |
| 206.55 | -100.79 | 0.85 | |
| 207.89 | -110.28 | 1.35 | |
| 210.04 | -110.66 | 0.47 |
Weekly focal plane temperature with sun angle, earth angle, and altitude overplotted. Sun angle is the solar array angle, that is the angle between the sun and the optical axis (+X axis). The earth angle is the angle between earth and the ACIS radiator (+Z axis). Altitude varies from 34 kkm to 128 kkm.
SIM Movements
16 TSC moves this period
| weekly average time/step | 0.00132 s |
|---|---|
| mission average time/step | 0.00132 s |
Telemetry
New violations or new extrema are shown in blue cells.
| MSID | 07/25/25 | 07/26/25 | 07/27/25 | 07/28/25 | 07/29/25 | 07/30/25 | 07/31/25 | yellow limits (lower) upper | red limits (lower) upper | Units | Description |
| AFTBLKHDT | 308.13 | 309.12 | 309.26 | 308.26 | (260.2) 303.0 |
(250.2) 308.0 |
TEMP | AFT BULKHEAD TEMP | |||
| AWD1TQI | (-3.39) | (-3.39) | (-3.39) | (-1.22) 1.22 |
(-3.3) 3.3 |
AMP | WHEEL 1 TORQUE CURRENT | ||||
| AWD3TQI | (-3.35) | (-1.22) 1.22 |
(-3.3) 3.3 |
AMP | WHEEL 3 TORQUE CURRENT | ||||||
| AWD6TQI | (-3.43) | (-3.43) | (-3.43) | (-1.22) 1.22 |
(-3.3) 3.3 |
AMP | WHEEL 6 TORQUE CURRENT | ||||
| CALPALV | (120.00) | (126.0) 128.0 |
(125.0) 129.0 |
V | Cal Pulser Amplitude | ||||||
| CTXBPWR | (0.00) | (0.00) | (0.00) | (0.00) | (0.00) | (0.00) | (0.00) | (36.12) 37.0 |
(36.0) 38.0 |
DBM | TRANSMITTER B OUTPUT POWER |
| ESAMYI | (0.06) | (5.63) 30.15 |
(5.3) 33.0 |
AMP | S/A -Y CURRENT | ||||||
| ESAPYI | (0.14) | (5.54) 30.15 |
(5.2) 33.0 |
AMP | S/A +Y CURRENT | ||||||
| IMHBLV | (79.00) | (126.0) 128.0 |
(125.0) 129.0 |
(2IMHBLV) | Imaging Bot & Top MCP HV Monitor | ||||||
| IMHVLV | (79.00) | (126.0) 128.0 |
(125.0) 129.0 |
(2IMHVLV) | Imaging Bot MCP HV Monitor | ||||||
| MZOBACONE | 312.65 | 313.64 | 309.53 | 315.16 | 315.35 | (260.2) 303.0 |
(250.2) 308.0 |
CONE | -Z SIDE OBA CONE | ||
| OBAAVG | 304.20 | 302.42 | 306.00 | 306.23 | (282.5) 300.0 |
(281.4) 301.0 |
K | OBA/TFTE TEMP | |||
| OBACONEAVG | 306.99 | 311.99 | (282.5) 300.0 |
(281.8) 301.0 |
K | OBA CONE AVG TEMP | |||||
| OBADIAGRAD | 4.84 | 4.76 | 4.51 | 4.12 | 4.84 | 4.39 | 4.64 | (-1.11) 3.5 |
(-2.78) 3.9 |
K | OBA DIAM GRAD |
| PZOBACONE | 308.59 | 309.88 | 309.41 | 310.86 | 311.15 | 310.30 | (260.2) 303.0 |
(250.2) 308.0 |
CONE | +Z SIDE OBA CONE | |
| TFTERANGE | 47.58 | 45.46 | 48.35 | 48.44 | (16.7) 37.5 |
(11.1) 45.0 |
K | TFTE VENT/RAD TEMP | |||
| TSCTSF3 | (268.79) | (268.79) | (278.15) 359.15 |
(269.15) 483.15 |
K | SC-TS FITTING -3 TEMP |
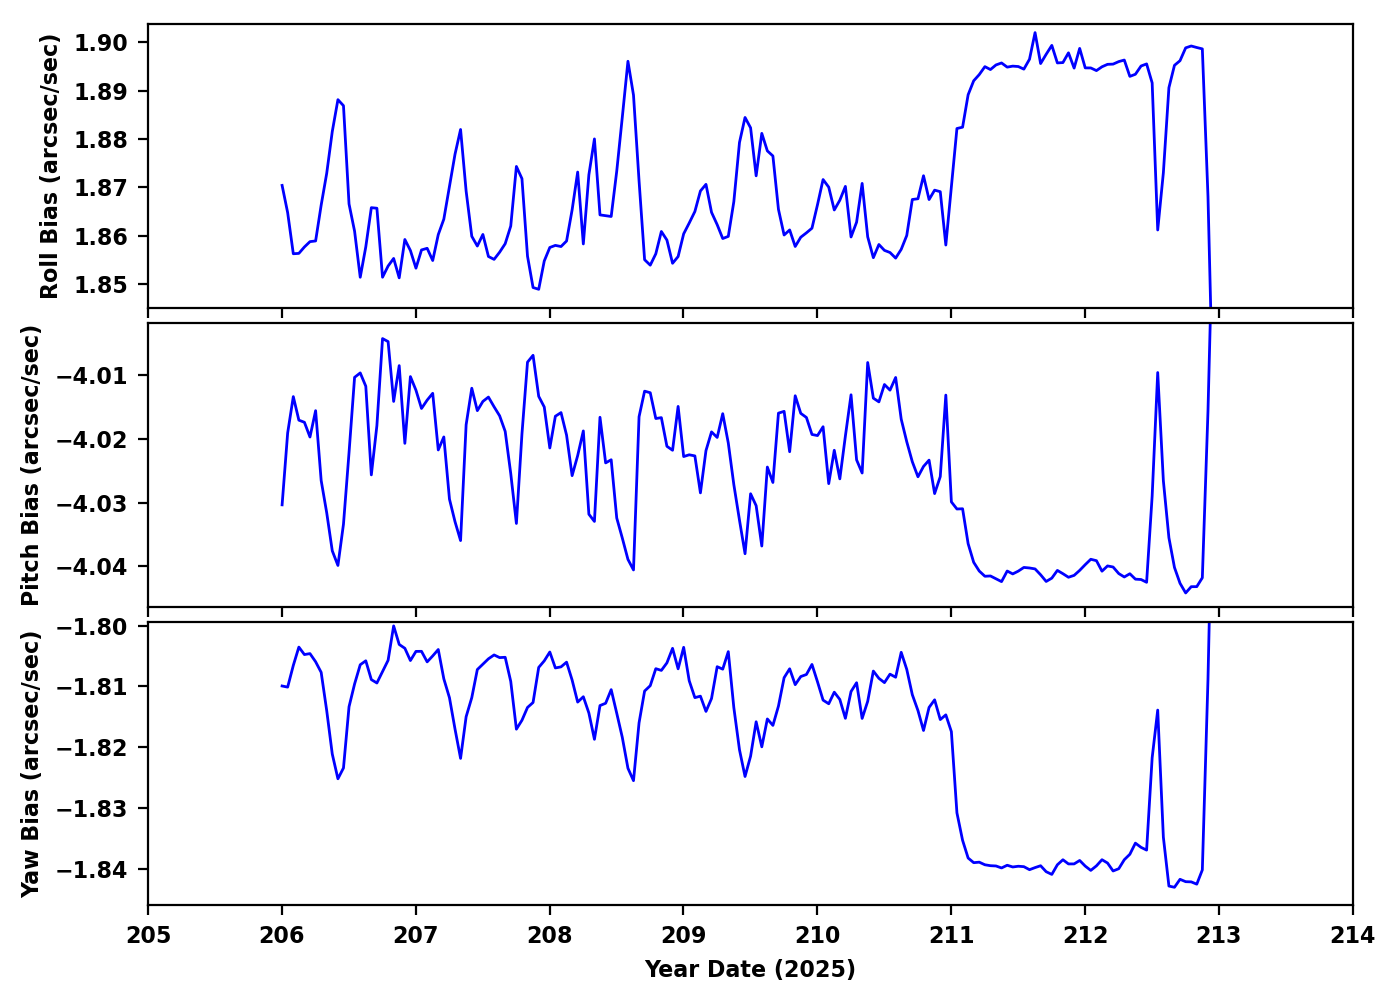
IRUs
| Gyro Bias Drift | Gyro Bias Drift Histogram |
|---|---|
|

|
Recent Observations
| OBSID | DETECTOR | GRATING | TARGET | ANALYSIS | ACA |
|---|---|---|---|---|---|
| 28683 | ACIS-23567 | NONE | Abell 3017 | OK | OK |
| 28326 | ACIS-01236 | NONE | PSZ2G358.21-87.49 | OK | OK |
| 28747 | HRC-I | NONE | G29-38 | OK | OK |
| 28606 | ACIS-0123 | NONE | Abell 370 | OK | OK |
| 31004 | ACIS-67 | NONE | SDSSJ115640.43+152040.3 | OK | OK |
| 31005 | ACIS-67 | NONE | SNR G15.9+0.2 | OK | OK |
| 28514 | ACIS-2367 | NONE | SNR G15.9+0.2 | OK | OK |
| 29931 | ACIS-67 | NONE | SDSS J152043.83+191851.3 | OK | OK |
| 28233 | ACIS-5678 | NONE | SDSS J162753.48+482529.4 | OK | OK |
| 29767 | ACIS-678 | NONE | 1eRASS J140339.9+093952 | OK | OK |
| 28741 | HRC-I | NONE | LHS 475 | OK | OK |
| 31006 | ACIS-2367 | NONE | SNR G15.9+0.2 | OK | OK |
| 28215 | ACIS-35678 | NONE | WISEA J210752.45-161131.6 | OK | OK |
| 27981 | HRC-I | NONE | HD 284653 | OK | OK |
| 28262 | ACIS-5678 | NONE | SDSS J130235.17+272621.9 | OK | OK |
| 29978 | ACIS-67 | NONE | LEDA 1147287 | OK | OK |
| 28599 | ACIS-0123 | NONE | Abell 370 | OK | OK |
| 28783 | HRC-I | NONE | SNR 1987A | OK | OK |
| 28764 | ACIS-0123 | NONE | R Cr A | OK | OK |
| 30009 | ACIS-67 | NONE | GAMA718498 | OK | OK |
| 28586 | ACIS-67 | NONE | WISE J025942.86-163542.9 | OK | OK |
| 31018 | HRC-I | NONE | SNR 1987A | OK | OK |
| 31016 | ACIS-0123 | NONE | R Cr A | OK | OK |
| 28255 | ACIS-5678 | NONE | SDSS J125606.10+274041.1 | OK | OK |
| 28216 | ACIS-235678 | NONE | WISEA J201749.05+620443.3 | OK | OK |
Trending
This week's focus is Spacecraft Bus and Subsystem Trends
Last reported on
May 15.
Only the most interesting or representative msids are shown below.
For a full listing choose the bulletted link.
| MSID | Mean | RMS | Delta/Yr | Delta/Yr/Yr | Unit | Description | |
|---|---|---|---|---|---|---|---|
| eb1v | off | -0.022 | 1.531e-04 | 32.47 +/- 0.19 | -0.00 +/- 0.00 | V | BATT 1 VOLTAGE | on | -0.057 | 0.009 | 32.25 +/- 0.70 | -(9.69+/-15.86)e-4 |
| eb2ci | off | -0.004 | 8.901e-05 | 0.34 +/- 0.07 | -(2.83+/-14.54)e-4 | AMP | BATT 2 CHARGE CURRENT | on | 0.008 | 0.005 | 0.42 +/- 0.26 | -0.00 +/- 0.00 |
| eb2v | off | -0.020 | 1.642e-04 | 32.46 +/- 0.18 | -0.01 +/- 0.00 | V | BATT 2 VOLTAGE | on | -0.061 | 0.011 | 32.21 +/- 0.71 | (5.92+/-20.24)e-4 |
| ecnv3v | -0.001 | 1.993e-05 | 15.30 +/- 0.02 | -(9.89+/-6.56)e-5 | V | CONV 3 +15V OUTPUT | |
| eepa5v | -3.517e-04 | 2.421e-04 | 5.23 +/- 0.17 | (2.61+/-0.25)e-10 | V | +5V RCTU_EP A |
| MSID | Mean | RMS | Delta/Yr | Delta/Yr/Yr | Unit | Description | |
|---|---|---|---|---|---|---|---|
| tape2pst | 0.586 | 0.002 | (2.90+/-0.05)e2 | 0.07 +/- 0.04 | K | PEA-2 POWER SUPPLY TEMP | |
| tapea1t | 0.511 | 0.002 | (3.01+/-0.04)e2 | 0.09 +/- 0.03 | K | PEA-1 CASE TEMP | |
| tcylaft1 | 1.827 | 0.007 | (3.03+/-0.14)e2 | 0.21 +/- 0.14 | K | CNT CYL TEMP:16-IN FWD OF SC-TS FIT-1 | |
| tpc_ese | 1.178 | 0.008 | (2.87+/-0.09)e2 | 0.04 +/- 0.21 | K | ESE TEMP | |
| tsamyt | on | -0.133 | 0.048 | (3.19+/-0.03)e2 | -0.06 +/- 0.07 | K | -Y WING SOLAR ARRAY TEMP | off | 0.023 | 0.003 | (3.19+/-0.02)e2 | -0.03 +/- 0.03 |
| tsapyt | on | -0.101 | 0.047 | (3.18+/-0.03)e2 | -0.06 +/- 0.07 | K | +Y WING SOLAR ARRAY TEMP | off | 0.052 | 0.003 | (3.19+/-0.02)e2 | -0.02 +/- 0.02 |
| MSID | Mean | RMS | Delta/Yr | Delta/Yr/Yr | Unit | Description | |
|---|---|---|---|---|---|---|---|
| tatecdrt | 0.595 | 0.002 | (2.89+/-0.05)e2 | 0.09 +/- 0.04 | K | TEC DRIVER RDNT TEMP | |
| trspmtpc | 1.479 | 0.007 | (2.95+/-0.12)e2 | 0.06 +/- 0.17 | K | RAD SHR PNL TEMP:TTWN MUPS AND PCAD | |
| tsctsf1 | 1.787 | 0.006 | (3.00+/-0.13)e2 | 0.15 +/- 0.11 | K | SC-TS FITTING -1 TEMP | |
| tsctsf2 | 0.775 | 0.003 | (2.78+/-0.06)e2 | 0.04 +/- 0.06 | K | SC-TS FITTING -2 TEMP |
If you have any questions, please contact: swolk@head.cfa.harvard.edu