| Science Run Stop: | 2024:03:24:11:34 |
| Science Run Start: | 2024:03:26:04:56 |
| Interruption: | 103.0ks |
| Triggered by: | auto |
Go to:
ACE Plot (E38/E175, P47/P112/P310/P761/P1060)
HRC Plot (HRC Shield Rate)
ACIS Plot (ACIS Count Rate)
GOES-R Plot (P1/P2/P5/HRC Prox)
XMM Plot (LE and HES)
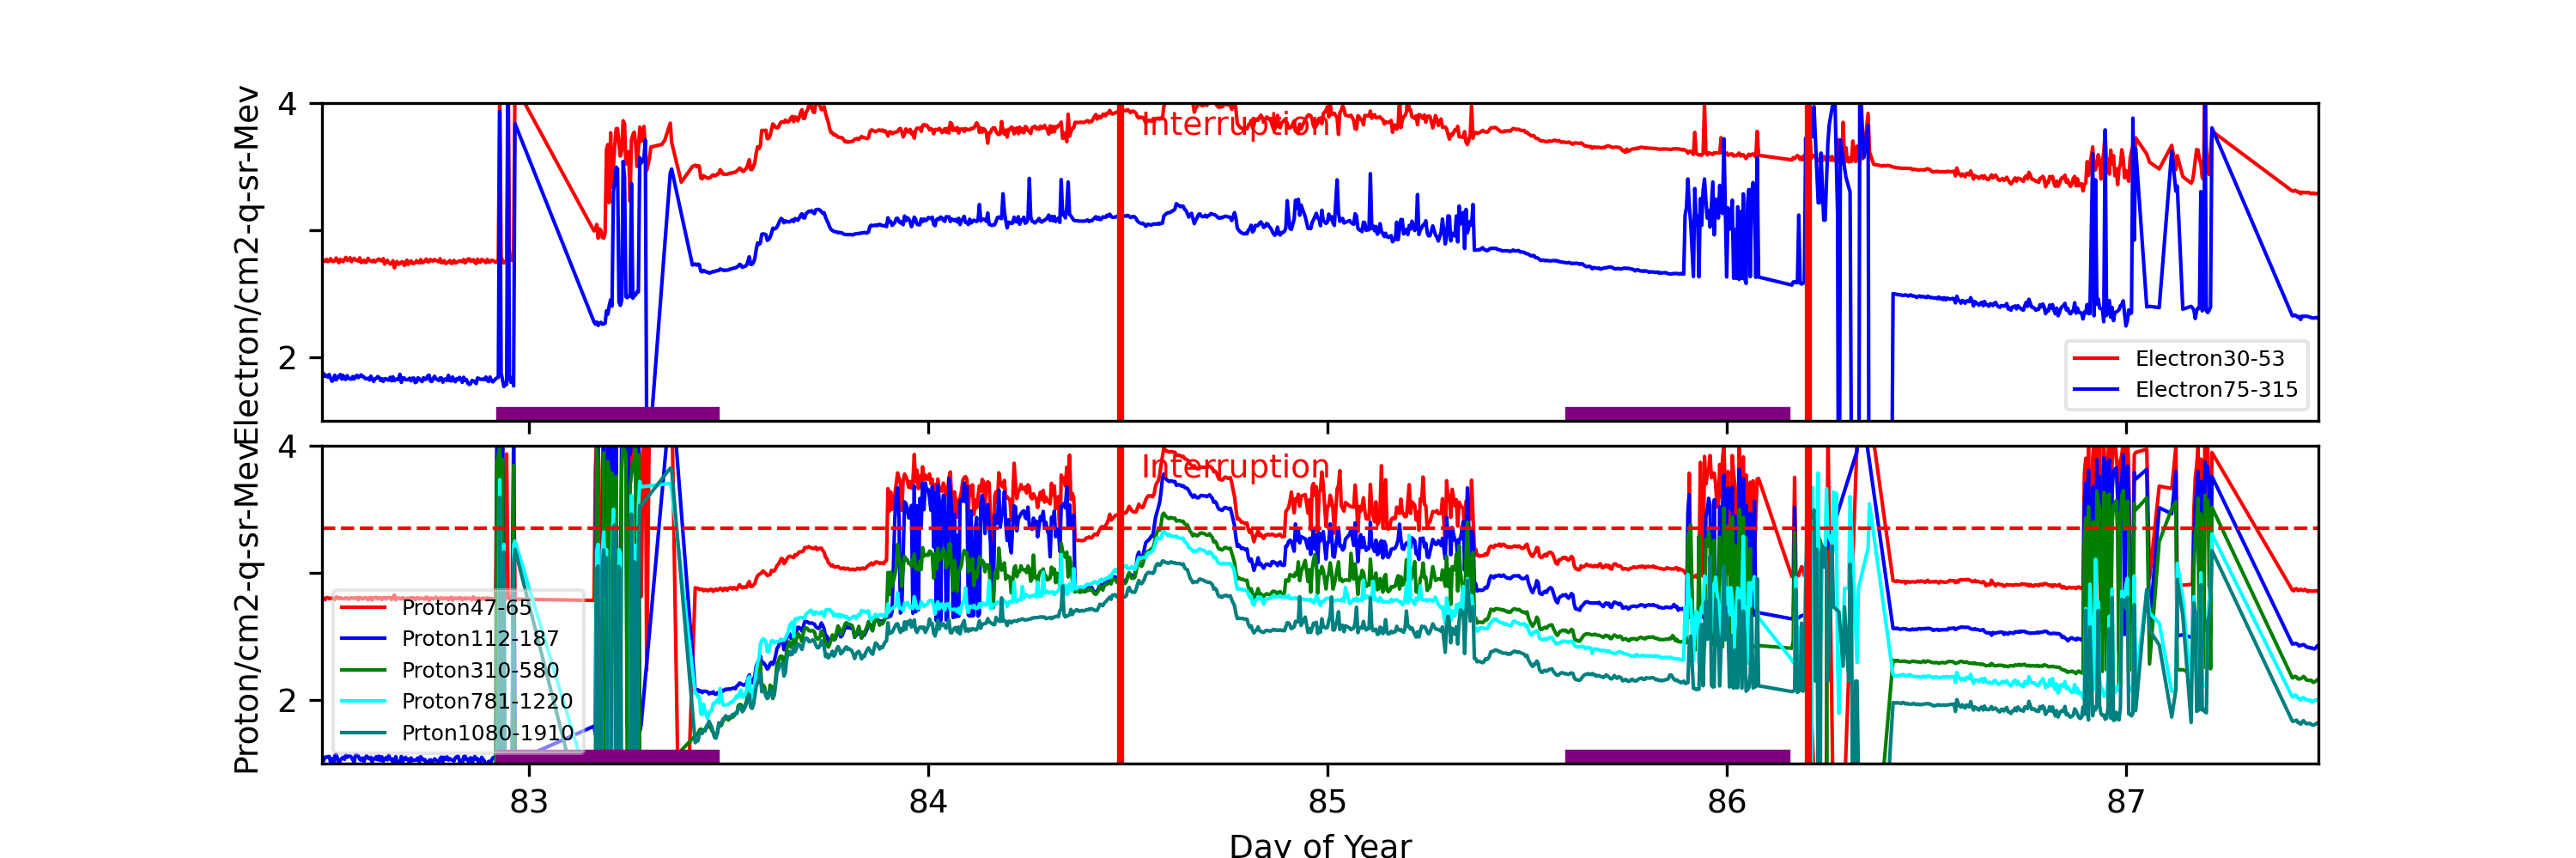
ACE radiation data are plotted around periods when science runs were interrupted. Plots start exactly 2 days before the interruption started. The top panel shows differential fluxes of electrons 38-53 and 175-315 (particles/cm2-s-ster-MeV), the middle panel shows differential fluxes of protons 47-65, 112-187, and 310-580 (particles/cm2-s-ster-MeV).
Data Period  (doy): 82.4819 - 87.4819
Interruption (doy): 84.4819 - 86.2056

			Avg			 Max		Time		Min		Time		Value at Interruption Started
-----------------------------------------------------------------------------------------------
e38	 		2.463e+05+/-2.499e+07	9.180e+06	82.948 	2.540e+03	82.663 	7.330e+05
e175	 		1.880e+04+/-5.977e+06	2.280e+06	82.948 	5.780e-05	86.330 	1.620e+04
p47	 		1.740e+05+/-2.891e+07	7.010e+06	83.358 	3.150e-04	86.246 	8.550e+04
p112	 		9.566e+04+/-2.625e+07	9.570e+06	86.330 	6.490e+00	82.663 	7.430e+03
p310	 		2.483e+04+/-5.400e+06	1.370e+06	83.236 	1.230e-05	86.312 	6.880e+03
p761	 		5.607e+03+/-1.408e+06	3.770e+05	86.229 	5.550e-01	86.212 	1.200e+04
p1060	 		2.733e+03+/-1.036e+06	4.480e+05	83.354 	1.260e-05	86.344 	4.170e+03
e38/e175 		6.410e+18+/-1.754e+22	1.240e+22	86.226 	5.693e-02	86.333 	4.525e+01
p47/p1060 		2.146e+29+/-5.796e+32	4.098e+32	86.285 	3.696e-02	83.281 	2.050e+01
p112/p1060 		2.146e+29+/-5.796e+32	4.098e+32	86.285 	2.776e-04	83.278 	1.782e+00
p310/p1060 		2.145e+29+/-5.796e+32	4.098e+32	86.285 	2.871e-05	83.278 	1.650e+00
p761/p1060 		8.318e+36+/-2.272e+40	1.607e+40	86.285 	3.345e-05	83.215 	2.878e+00

Steepest Rise
------------
	Time		Slope(in log per hr)
----------------------------------------
e38 	82.9375		21133599.7732
e175 	82.9375		5250900.9034
p47 	86.3437		11630571.0689
p112 	86.3194		22040507.9465
p310 	83.2257		2385994.3817
p761 	86.2222		868261.1560
p1060 	83.3437		1031781.3542
Two vertical red lines indicate the start and the end of the interruption. Purple hatched areas indicate that the satellite is in the radiation belt. The horizontal dashed line indicates P3 trigger level. If P3 level is higher than this level more than 2 hours, SCS 107 may be manually triggered.
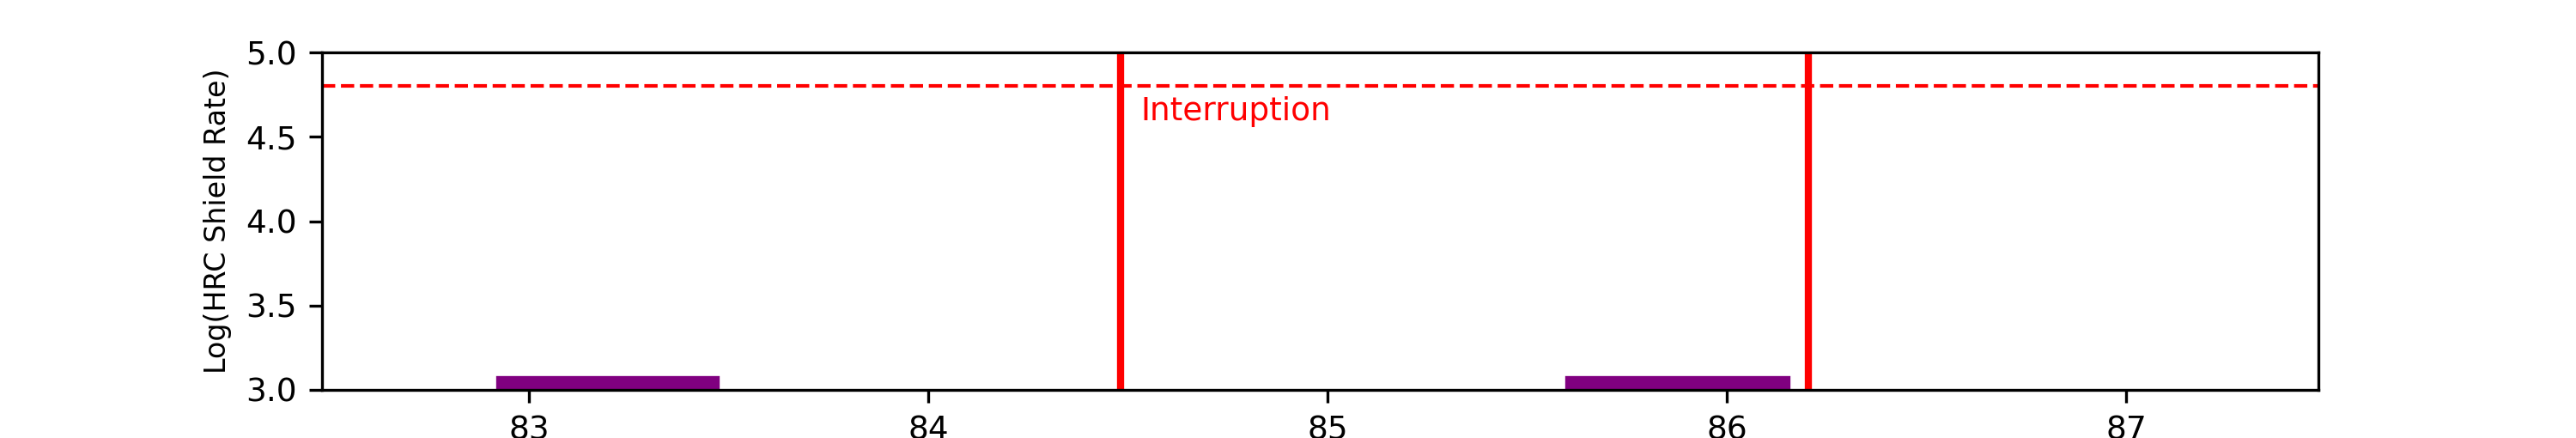
		Avg			Max		Time		Min		Time		Value at Interruption Started
-----------------------------------------------------------------------------------------------
hrc 		0.000e+00+/-0.000e+00	0.000e+00	0.000 	1.000e+10	0.000 	0.000e+00
Two vertical red lines indicate the start and the end of the interruption. Purple hatched areas indicate that the satellite is in the radiation belt. The red horizontal dashedline indicates SCS 107 limits. If the HRC shield rate/256 goes above 248, automatic SCS 107 is triggered.
The follwoing plots are copied from ACIS Threshold Corssings Page. For more details, please refer to Using ACIS to detect and report high radiation conditions


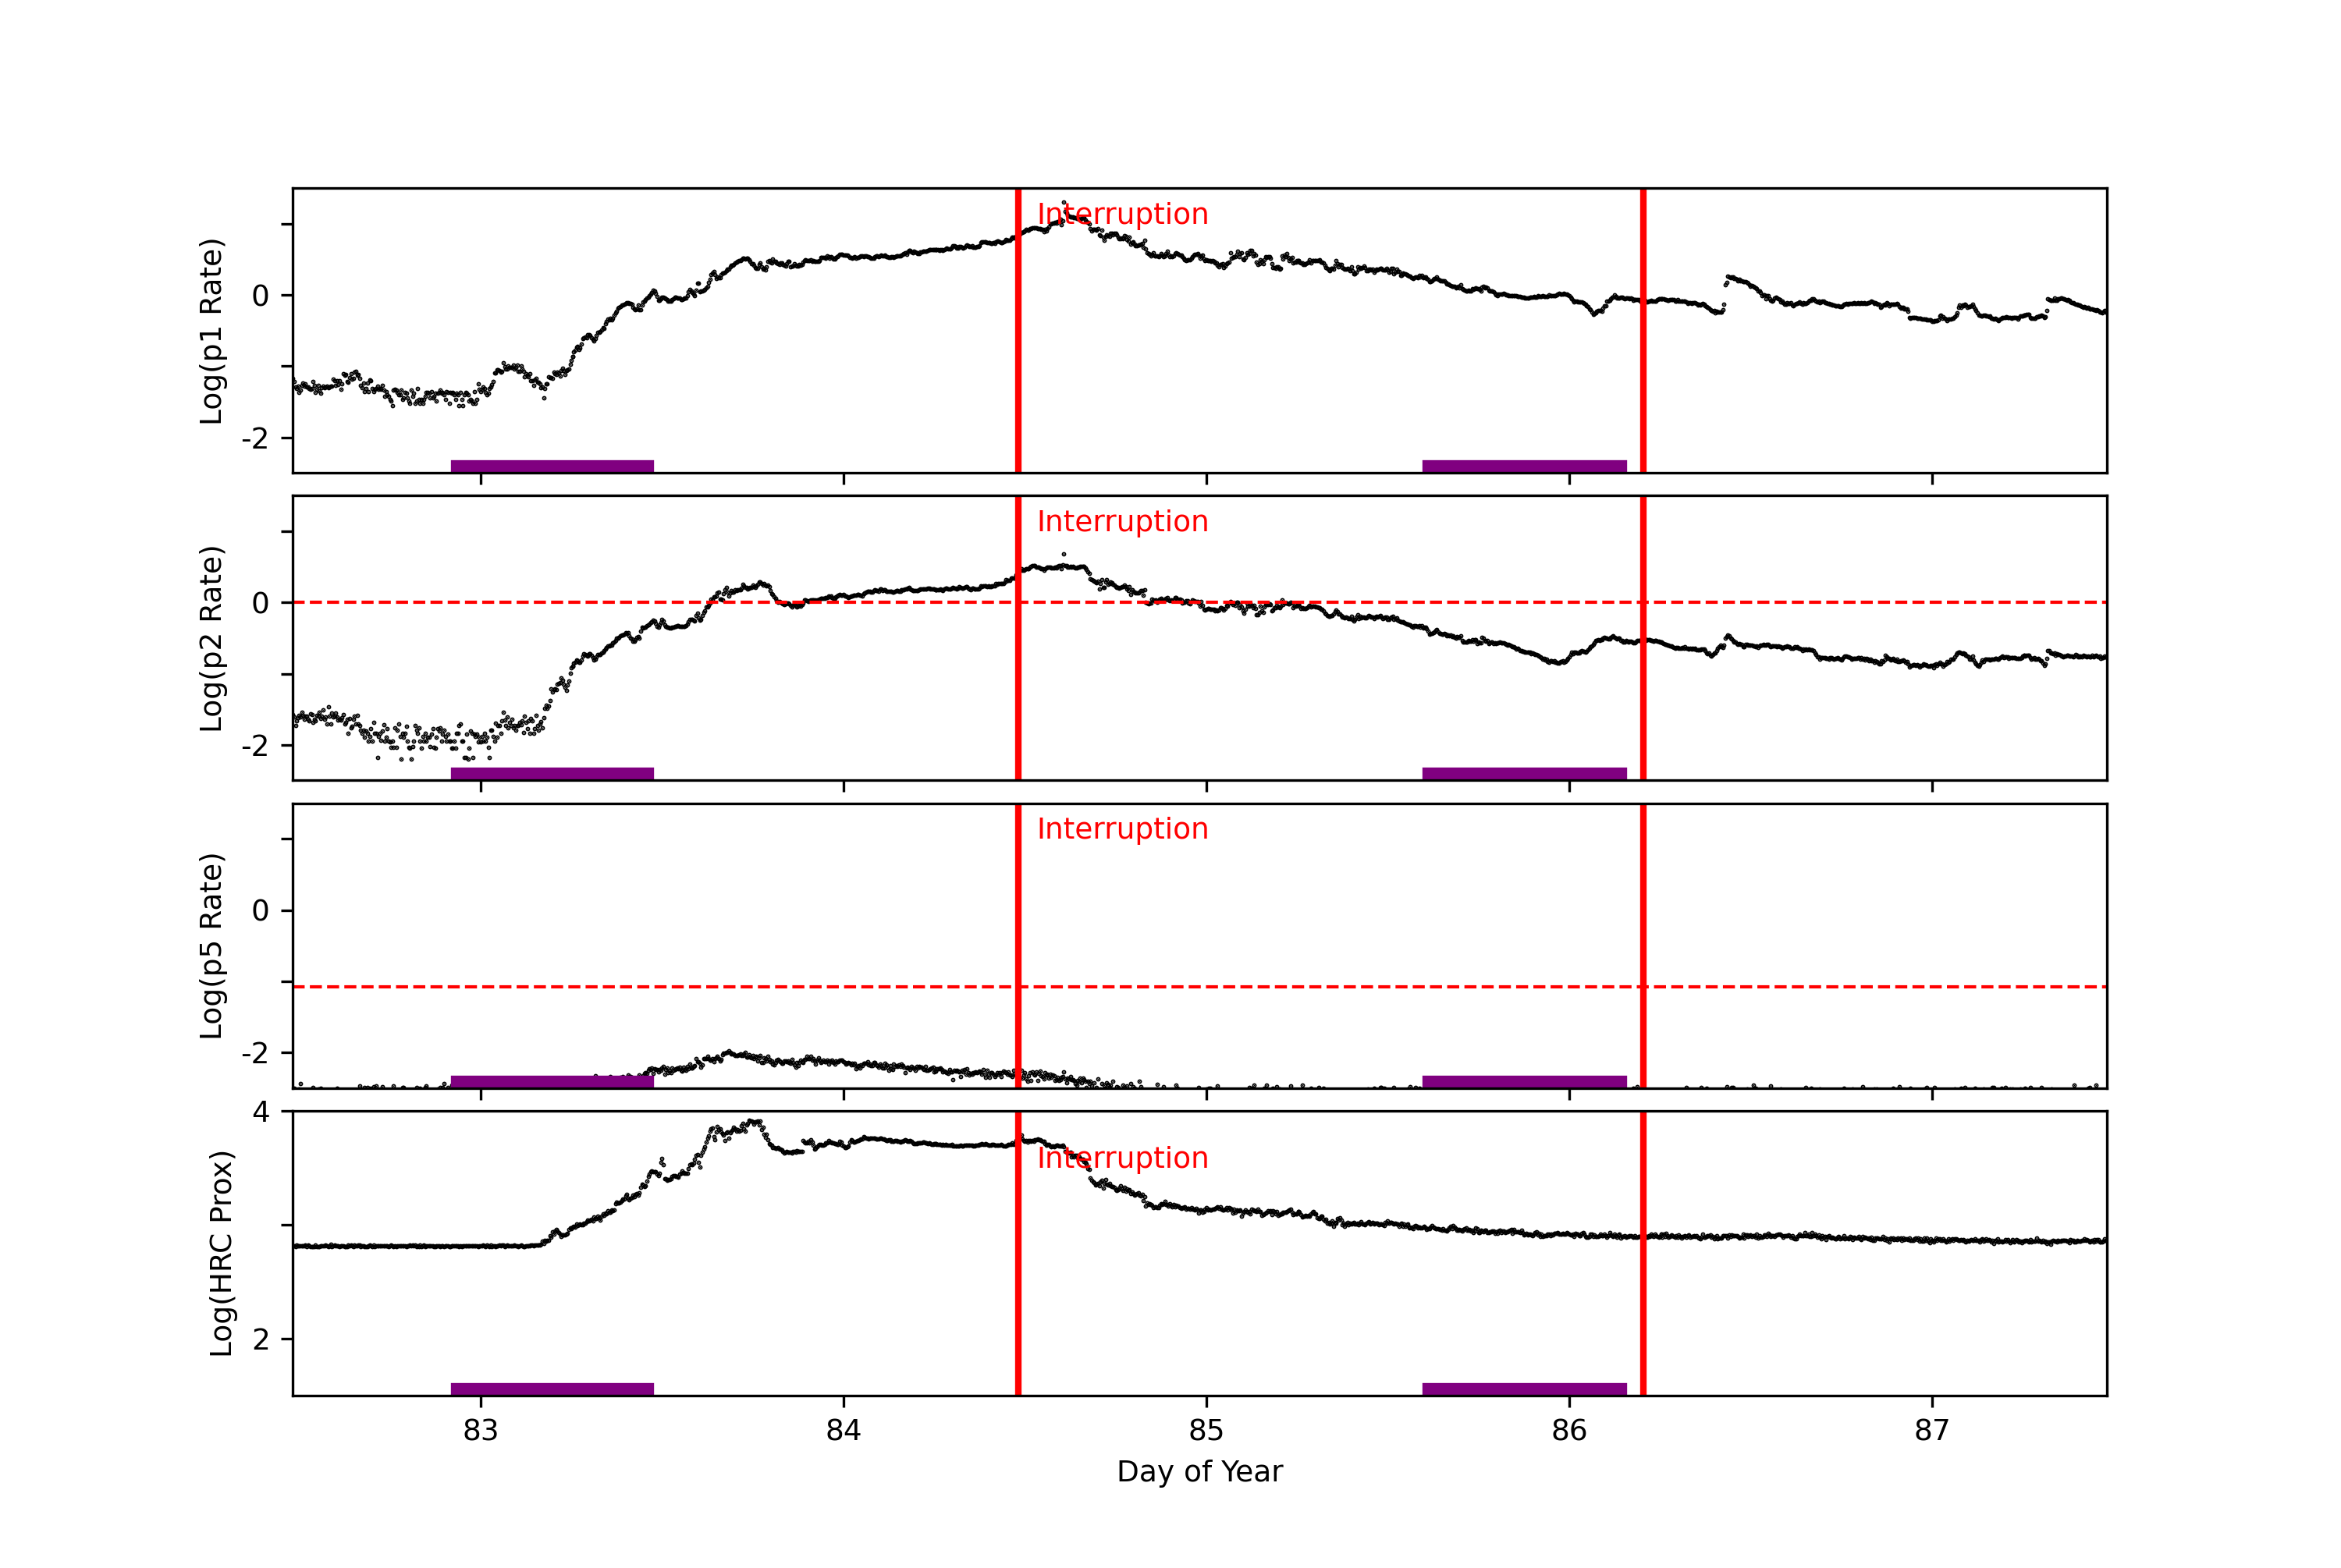
GOES-R data are taken from NOAA site (https://services.swpc.noaa.gov/json/goes/primary/integral-protons-1-day.json).
| P1 | 1.0 - 3.0 MeV protons (Counts/cm2 sec sr MeV) Uncorrected |
| P2 | 3.4 - 11.0 MeV protons (Counts/cm2 sec sr MeV) Uncorrected |
| P5 | 40.0 - 98.0 MeV protons (Counts/cm2 sec sr MeV) Uncorrected |
| HRC Prox | 6000 * (11.64-38.1MeV) + 270000 * (40.3-73.4MeV) 100000 * (83.7-242.0MeV) |
			avg			max		Time		min		Time		Value at Interruption Started
-----------------------------------------------------------------------------------------------
p1		7.163e+02 +/- 2.182e+03		4.148e+04	84.608		7.874e-02	82.757		4.472e+03
p2		7.041e+01 +/- 1.790e+02		2.264e+03	84.608		4.021e-03	82.965		5.854e+02
p5		1.354e-03 +/- 1.595e-03		1.115e-02	83.684		1.259e-04	82.684		2.565e-03
hrc prox	7.163e+02 +/- 2.182e+03		4.148e+04	84.608		7.874e-02	82.757		3.437e+05
Two vertical red lines indicate the start and the end of the interruption. Purple hatched areas indicate that the satellite is in the radiation belt. The red horizontal dashed lines indicate SCS 107 limits. If GOES P2 or P5 levels go above these levels, SCS 107 may be manually triggered.
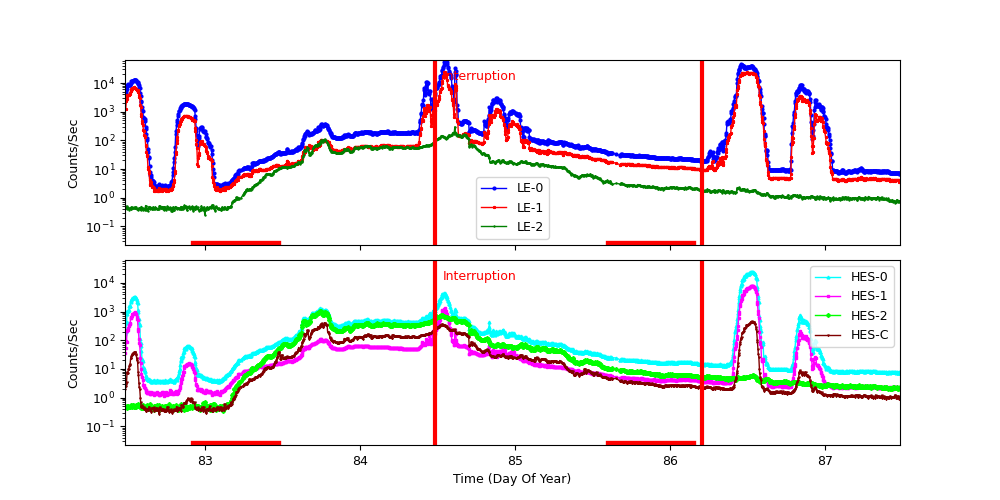
	Avg			 Max			Time		Min			Time		Value at Interruption Started
-----------------------------------------------------------------------------------------------
LE-0:  2.205e+03 +/- 7.289e+03	5.773e+04	     84.544		2.226e+00	     83.097	      4.400e+03
LE-1:  1.013e+03 +/- 3.664e+03	2.437e+04	     84.544		1.671e+00	     82.671	      1.103e+03
LE-2:  2.063e+01 +/- 3.477e+01	2.962e+02	     84.610		2.500e-01	     82.997	      9.147e+01
HES-0: 6.821e+02 +/- 2.861e+03	2.492e+04	     86.524		3.475e+00	     82.735	      1.059e+03
HES-1: 1.795e+02 +/- 8.904e+02	7.941e+03	     86.524		1.108e+00	     82.735	      1.781e+02
HES-2: 1.118e+02 +/- 1.953e+02	1.080e+03	     83.742		3.480e-01	     83.116	      5.563e+02
HES-C: 5.169e+01 +/- 8.687e+01	4.556e+02	     86.524		2.700e-01	     82.701	      2.243e+02
Two vertical red lines indicate the start and the end of the interruption. Red hatched areas indicate that the satellite is in the radiation belt.