| Science Run Stop: | 2022:03:28:12:40 |
| Science Run Start: | 2022:04:04:05:59 |
| Interruption: | 448.0ks |
| Triggered by: | auto |
Go to:
ACE Plot (E38/E175, P47/P112/P310/P761/P1060)
HRC Plot (HRC Shield Rate)
ACIS Plot (ACIS Count Rate)
GOES-R Plot (P1/P2/P5/HRC Prox)
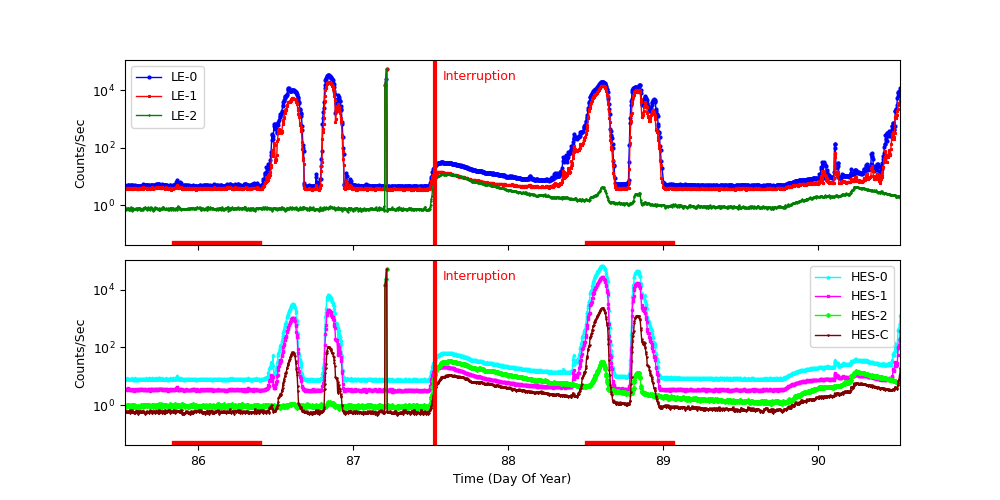
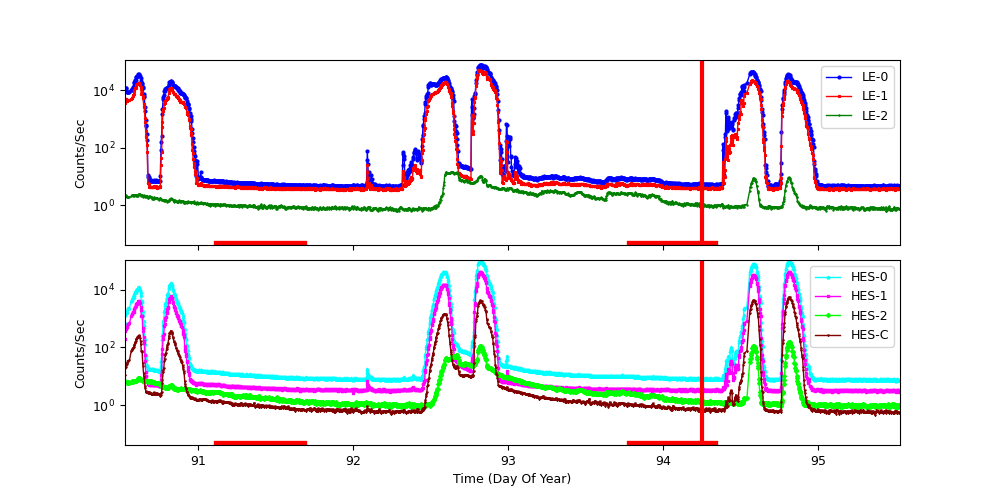
XMM Plot (LE and HES)
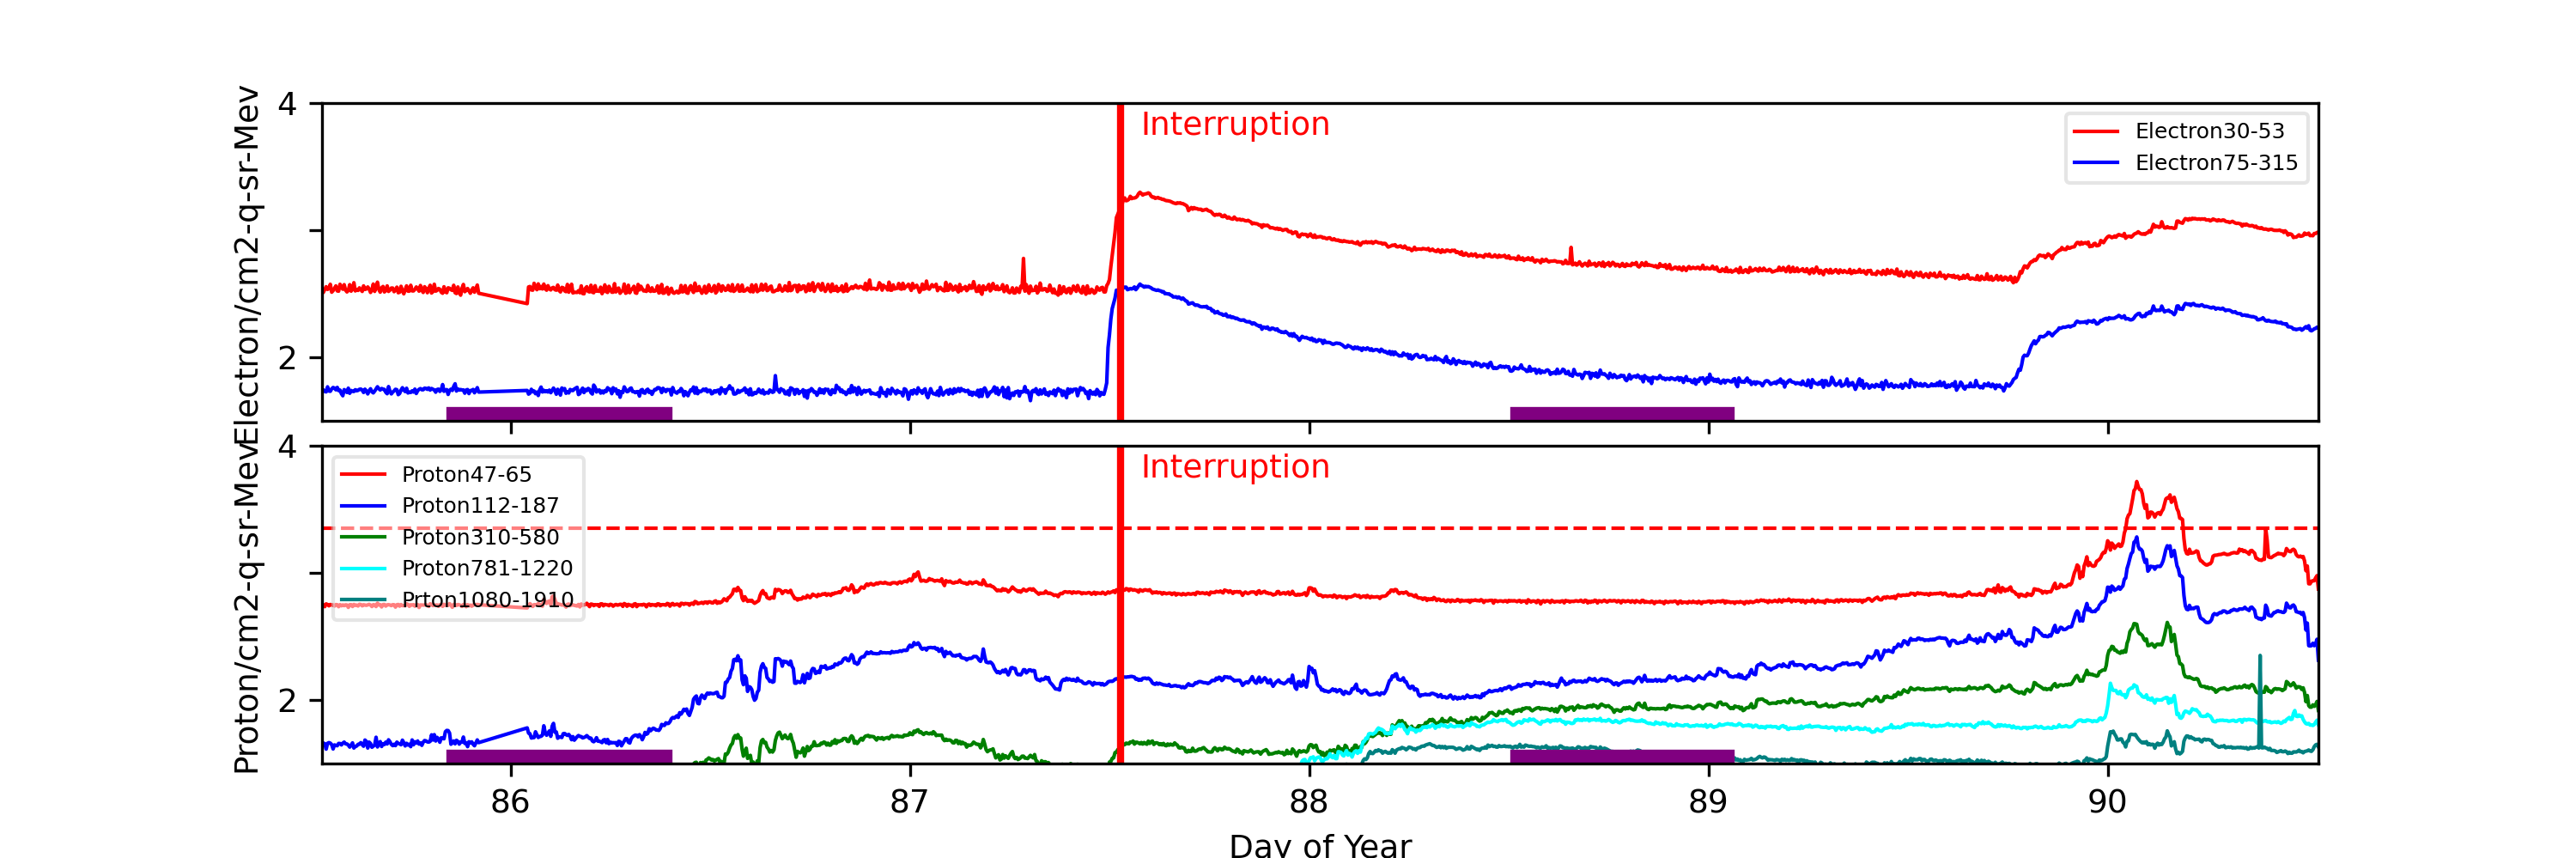
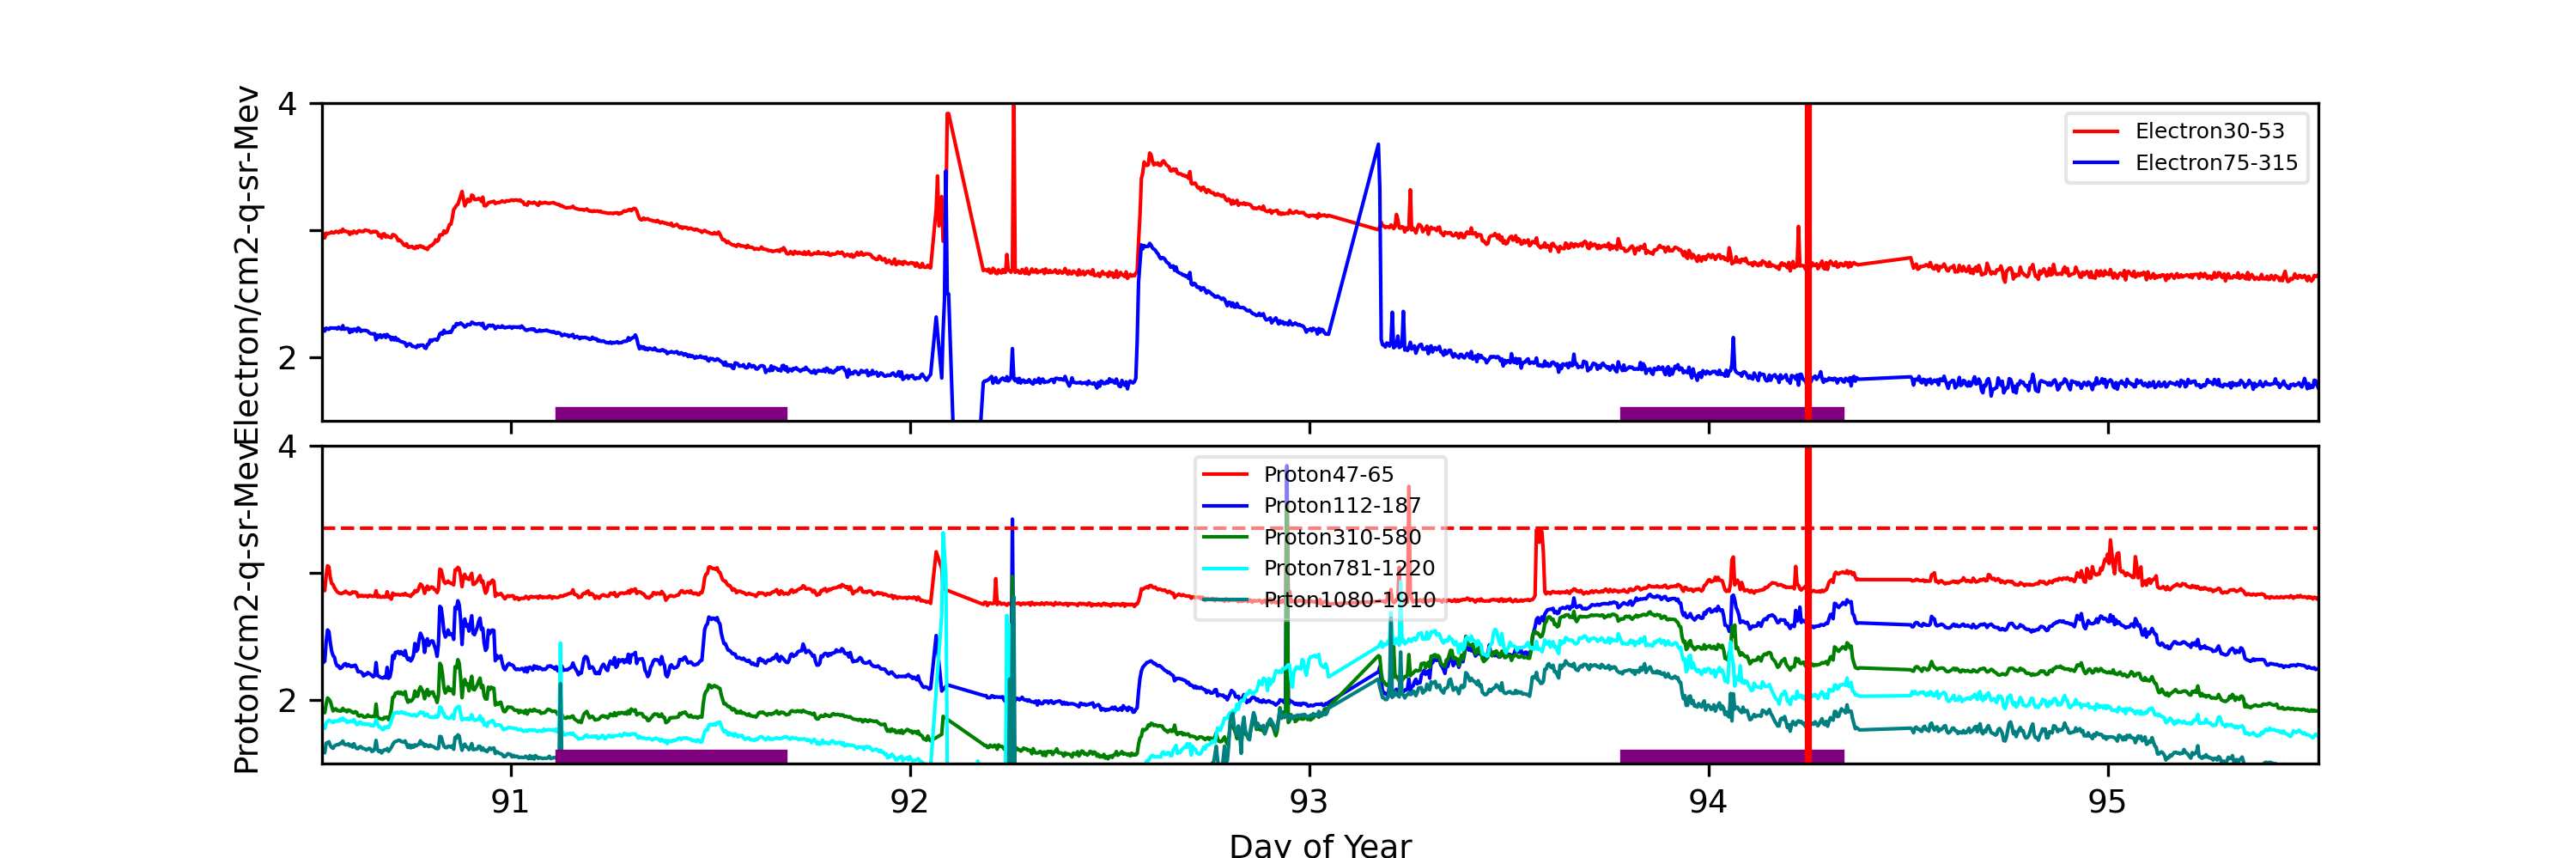
ACE radiation data are plotted around periods when science runs were interrupted. Plots start exactly 2 days before the interruption started. The top panel shows differential fluxes of electrons 38-53 and 175-315 (particles/cm2-s-ster-MeV), the middle panel shows differential fluxes of protons 47-65, 112-187, and 310-580 (particles/cm2-s-ster-MeV).
Data Period  (doy): 85.5278 - 95.5278
Interruption (doy): 87.5278 - 94.2493

			Avg			 Max		Time		Min		Time		Value at Interruption Started
-----------------------------------------------------------------------------------------------
e38	 		7.772e+03+/-3.052e+06	1.820e+06	92.260 	6.940e+02	86.042 	2.510e+04
e175	 		2.402e+02+/-2.612e+05	2.240e+05	93.174 	3.310e-04	92.132 	1.130e+03
p47	 		6.952e+03+/-1.545e+06	4.360e+05	92.944 	2.820e+03	86.042 	5.560e+03
p112	 		1.135e+03+/-9.515e+05	4.900e+05	92.944 	1.690e+01	85.538 	2.240e+02
p310	 		2.570e+02+/-2.580e+05	1.410e+05	96.017 	1.870e+00	85.618 	1.700e+01
p761	 		1.125e+02+/-6.561e+04	4.310e+04	92.083 	1.420e-04	92.129 	3.860e+00
p1060	 		2.891e+01+/-8.907e+03	4.240e+03	92.260 	8.860e-02	85.597 	1.260e+00
e38/e175 		7.312e+27+/-3.424e+31	2.421e+31	92.104 	3.021e-02	92.132 	2.221e+01
p47/p1060 		9.123e+05+/-3.181e+09	2.160e+09	92.066 	7.759e-01	92.260 	4.413e+03
p112/p1060 		4.590e+04+/-1.602e+08	1.040e+08	92.066 	2.146e-02	92.260 	1.778e+02
p310/p1060 		7.793e+02+/-3.279e+06	2.310e+06	86.663 	3.821e-03	92.260 	1.349e+01
p761/p1060 		2.831e+05+/-1.325e+09	9.370e+08	92.090 	1.986e-03	92.260 	3.063e+00

Steepest Rise
------------
	Time		Slope(in log per hr)
----------------------------------------
e38 	92.2500		4177886.3185
e175 	93.1562		515368.0504
p47 	92.9340		994821.3898
p112 	92.9340		1127135.2345
p310 	96.0069		324328.0164
p761 	92.0729		99162.3347
p1060 	92.2500		9750.3954
Two vertical red lines indicate the start and the end of the interruption. Purple hatched areas indicate that the satellite is in the radiation belt. The horizontal dashed line indicates P3 trigger level. If P3 level is higher than this level more than 2 hours, SCS 107 may be manually triggered.
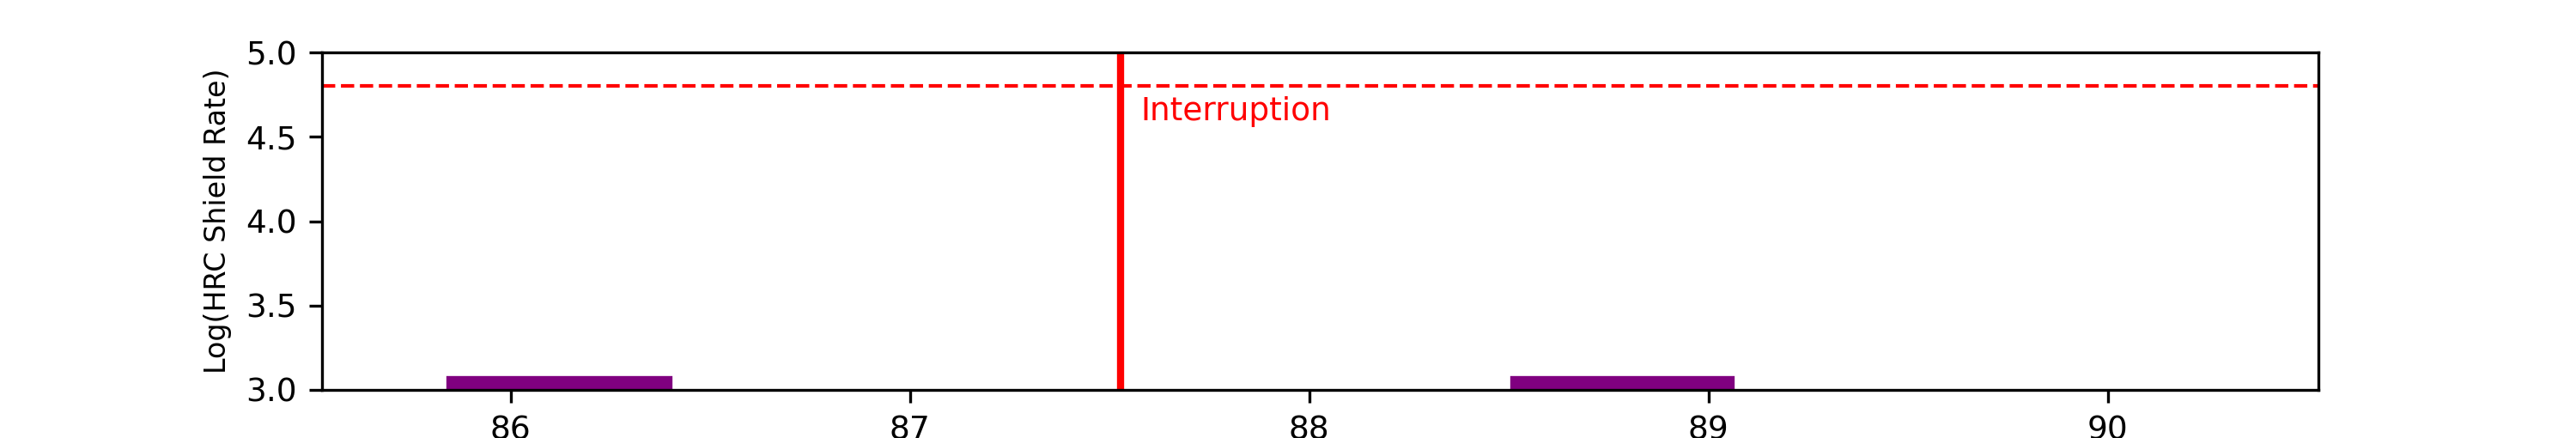
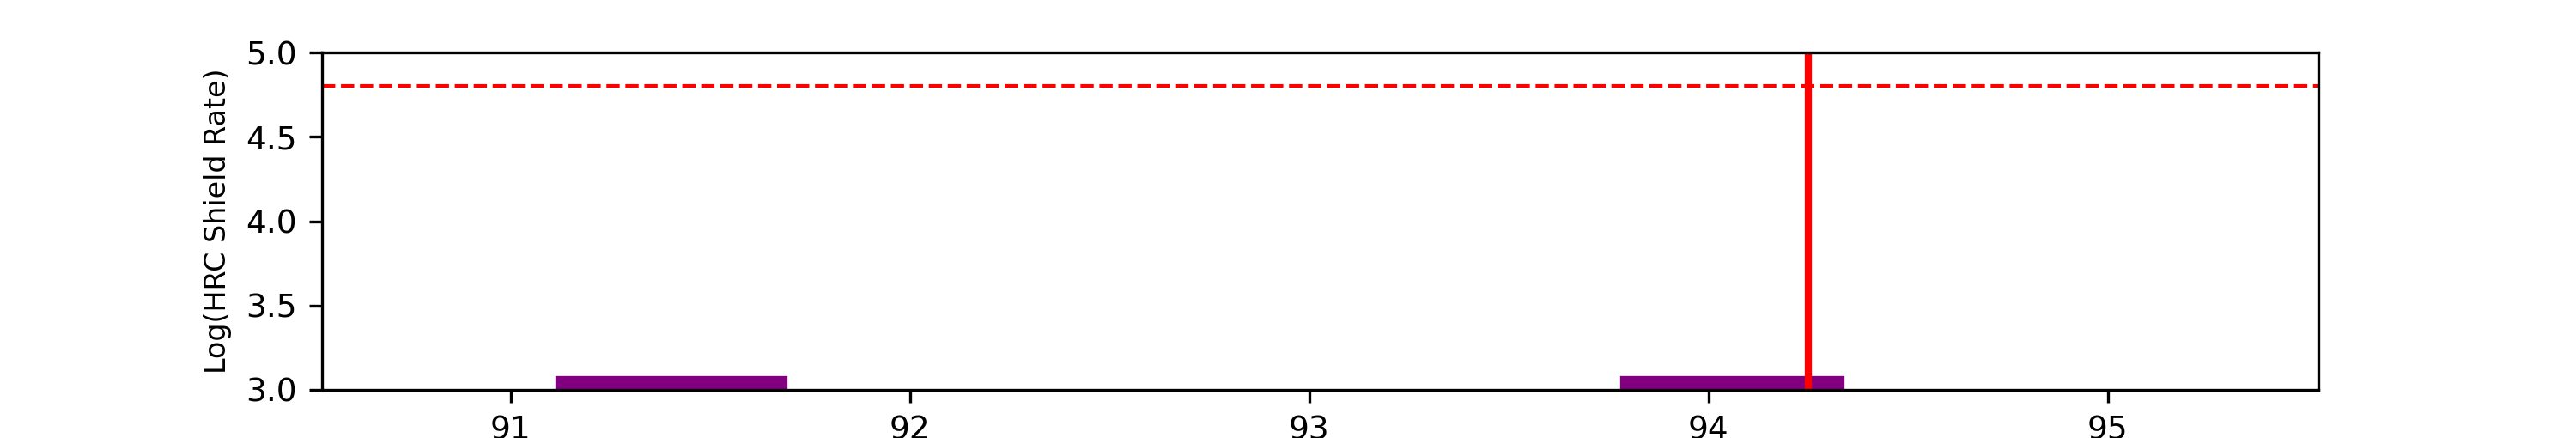
		Avg			Max		Time		Min		Time		Value at Interruption Started
-----------------------------------------------------------------------------------------------
hrc 		0.000e+00+/-0.000e+00	0.000e+00	0.000 	1.000e+10	0.000 	0.000e+00
Two vertical red lines indicate the start and the end of the interruption. Purple hatched areas indicate that the satellite is in the radiation belt. The red horizontal dashedline indicates SCS 107 limits. If the HRC shield rate/256 goes above 248, automatic SCS 107 is triggered.
The follwoing plots are copied from ACIS Threshold Corssings Page. For more details, please refer to Using ACIS to detect and report high radiation conditions
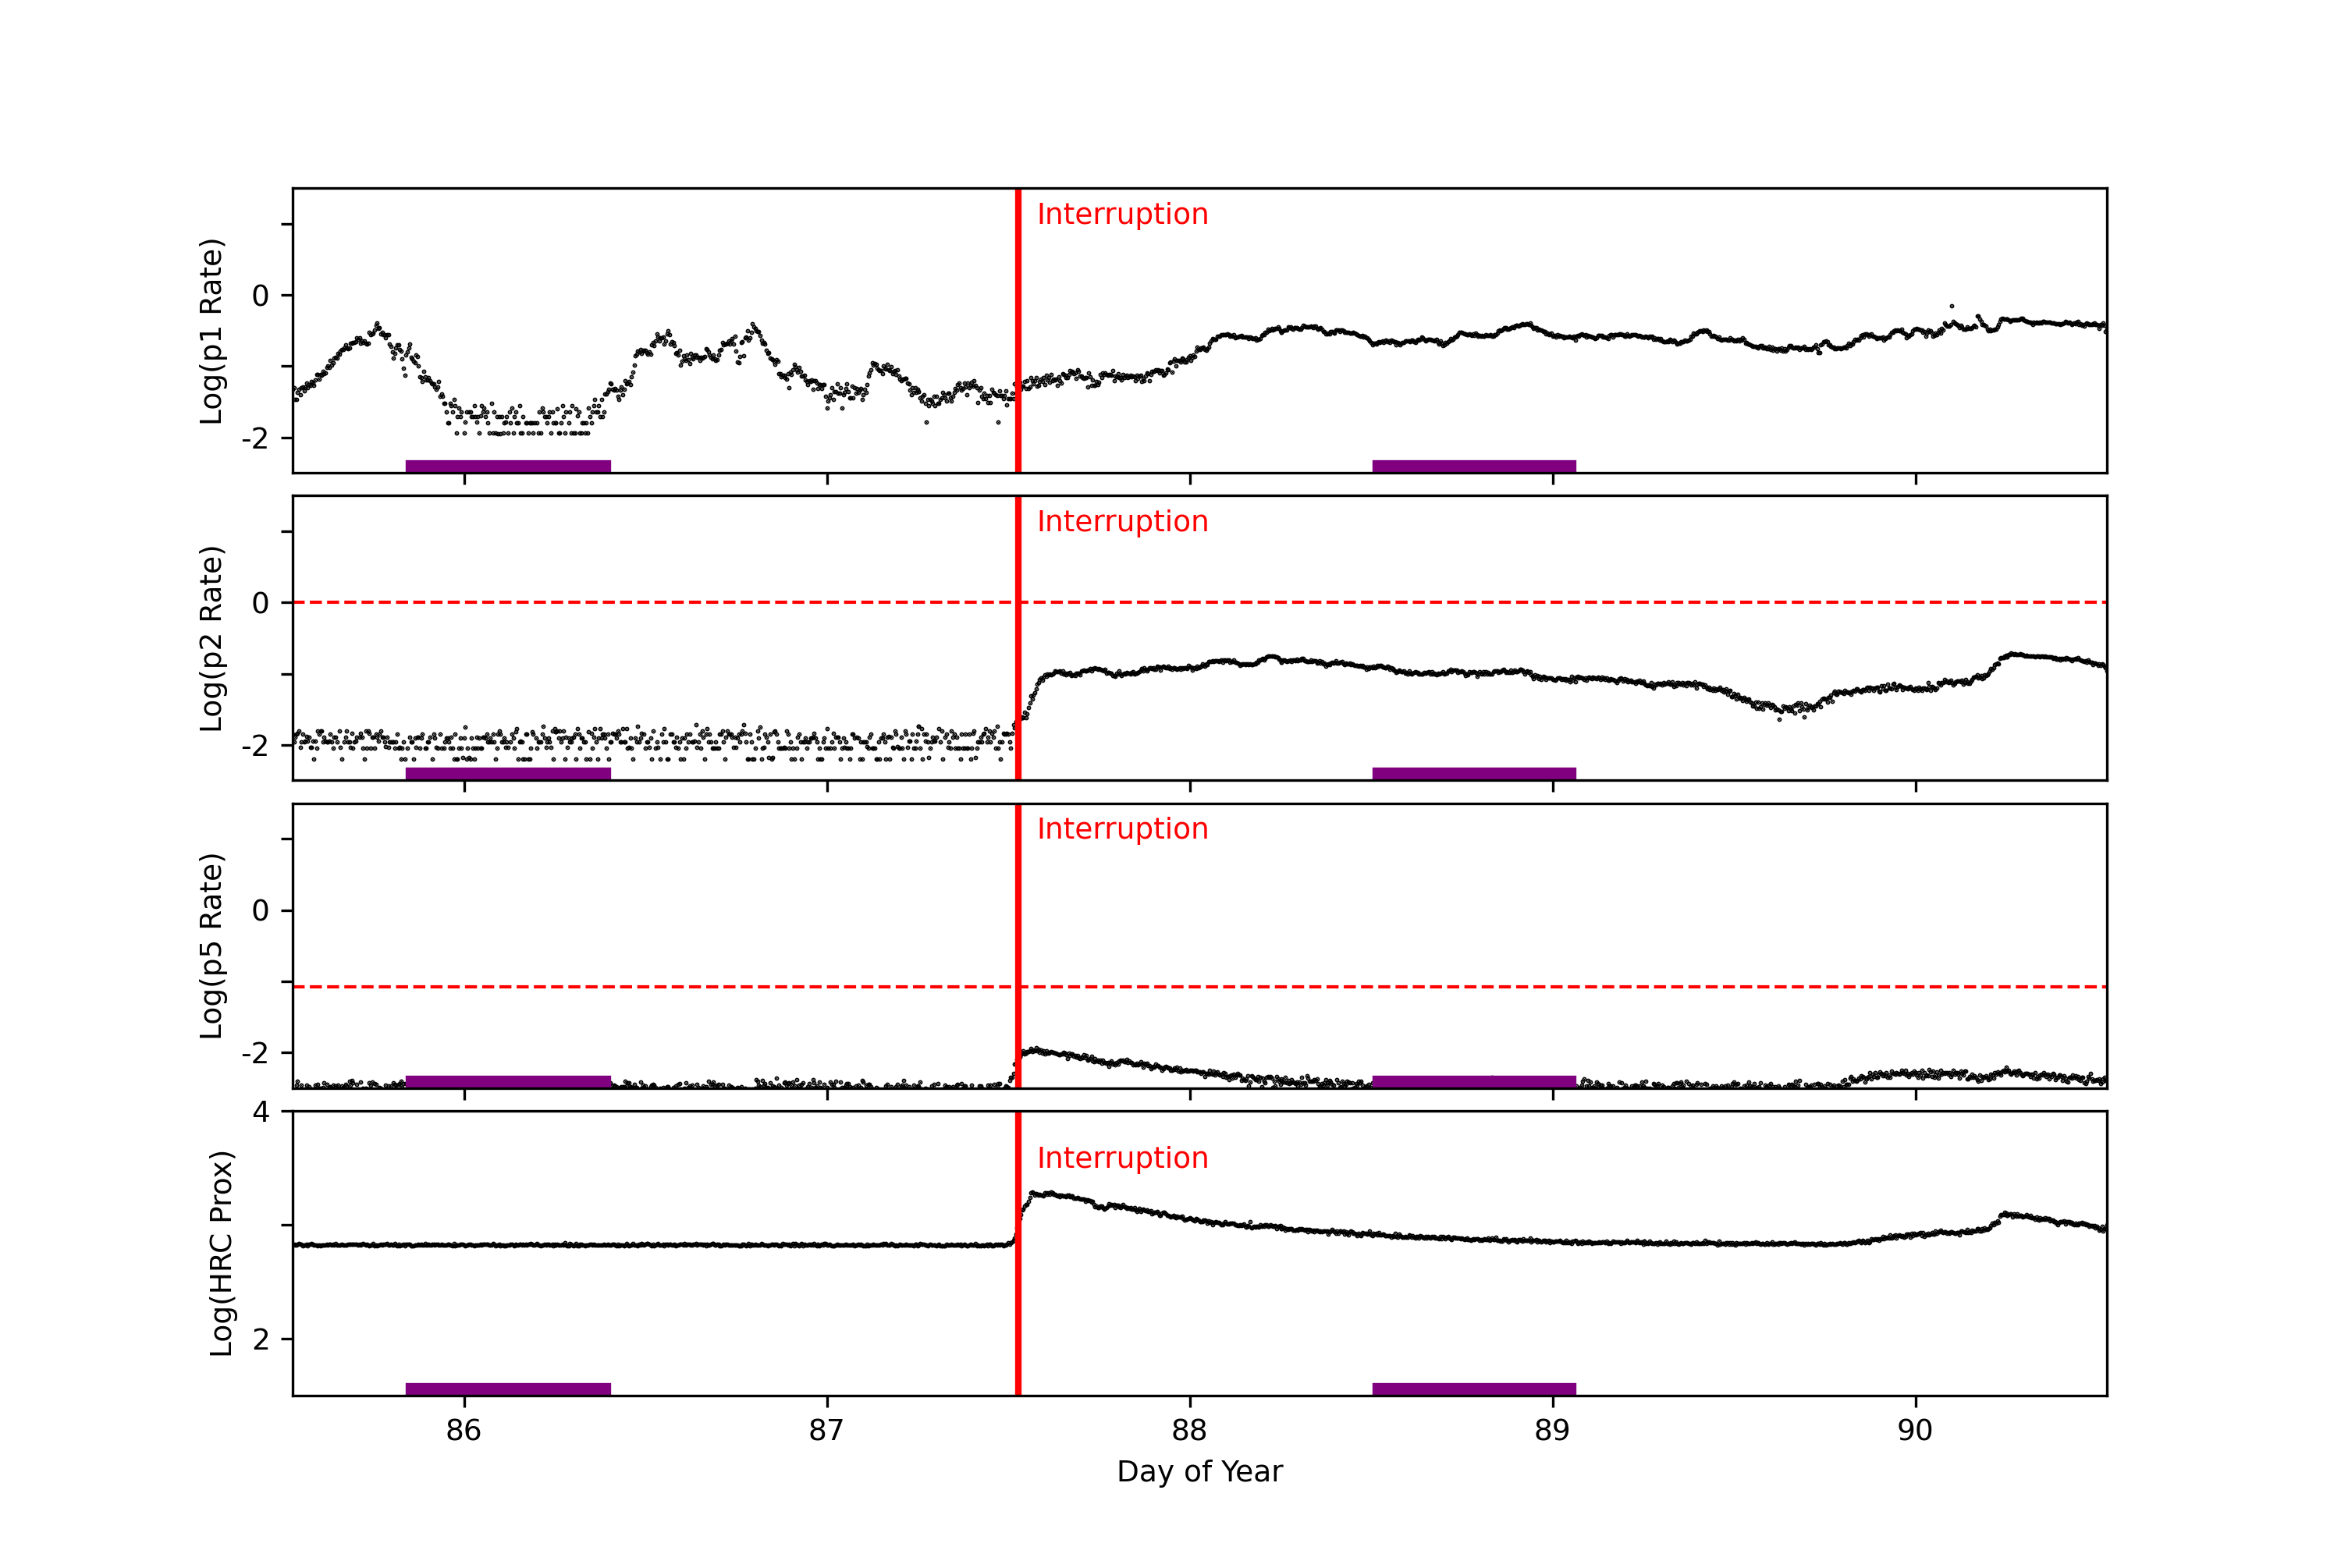
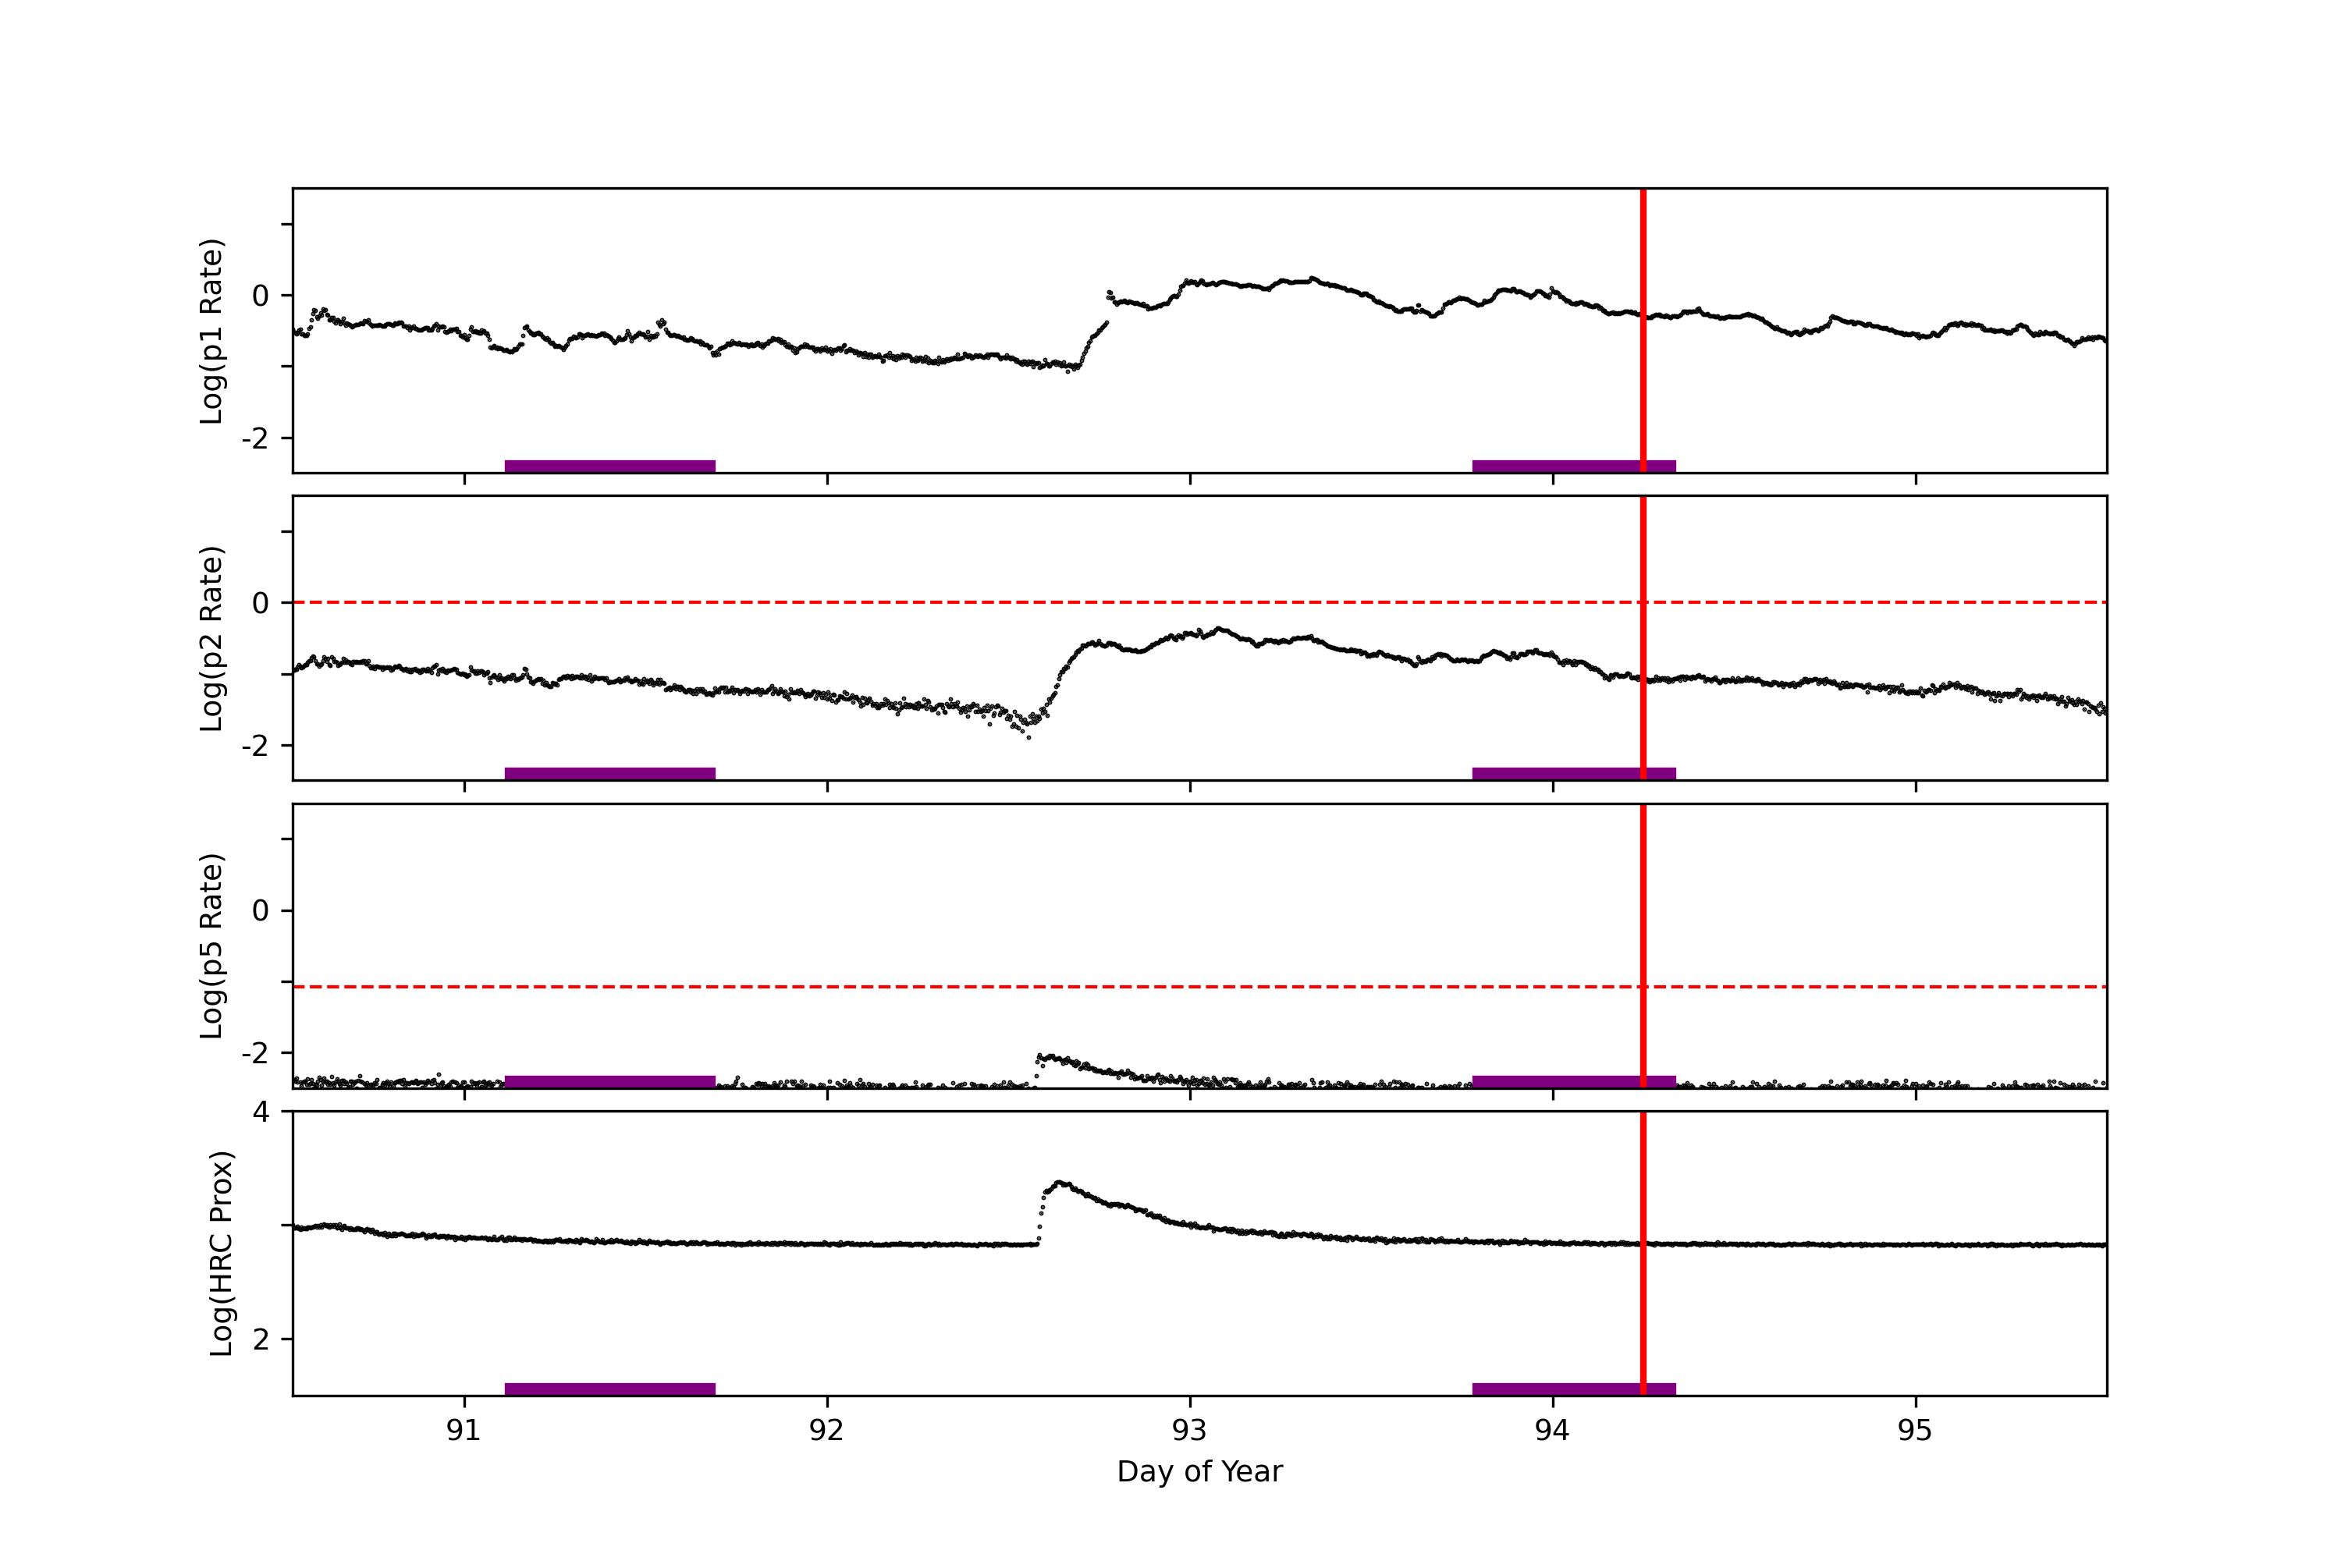
GOES-R data are taken from NOAA site (https://services.swpc.noaa.gov/json/goes/primary/integral-protons-1-day.json).
| P1 | 1.0 - 3.0 MeV protons (Counts/cm2 sec sr MeV) Uncorrected |
| P2 | 3.4 - 11.0 MeV protons (Counts/cm2 sec sr MeV) Uncorrected |
| P5 | 40.0 - 98.0 MeV protons (Counts/cm2 sec sr MeV) Uncorrected |
| HRC Prox | 6000 * (11.64-38.1MeV) + 270000 * (40.3-73.4MeV) 100000 * (83.7-242.0MeV) |
			avg			max		Time		min		Time		Value at Interruption Started
-----------------------------------------------------------------------------------------------
p1		1.923e+01 +/- 4.427e+01		3.092e+02	93.333		1.279e-02	86.094		2.269e-01
p2		1.218e+00 +/- 2.324e+00		1.926e+01	93.080		3.987e-03	85.826		4.575e-02
p5		1.470e-03 +/- 1.362e-03		1.332e-02	87.576		3.414e-04	94.729		7.395e-03
hrc prox	1.923e+01 +/- 4.427e+01		3.092e+02	93.333		1.279e-02	86.094		9.935e+03
Two vertical red lines indicate the start and the end of the interruption. Purple hatched areas indicate that the satellite is in the radiation belt. The red horizontal dashed lines indicate SCS 107 limits. If GOES P2 or P5 levels go above these levels, SCS 107 may be manually triggered.
	Avg			 Max			Time		Min			Time		Value at Interruption Started
-----------------------------------------------------------------------------------------------
LE-0:  2.494e+03 +/- 7.941e+03	7.323e+04	     92.821		4.080e+00	     87.478	      2.366e+01
LE-1:  1.419e+03 +/- 4.902e+03	5.405e+04	     87.216		3.270e+00	     92.195	      1.267e+01
LE-2:  2.809e+01 +/- 1.022e+03	5.405e+04	     87.216		5.970e-01	     86.965	      7.616e+00
HES-0: 2.771e+03 +/- 1.194e+04	1.007e+05	     92.821		7.061e+00	     95.502	      4.014e+01
HES-1: 1.057e+03 +/- 4.748e+03	5.405e+04	     87.216		2.708e+00	     91.997	      1.727e+01
HES-2: 3.212e+01 +/- 1.022e+03	5.405e+04	     87.216		7.170e-01	     87.451	      1.226e+01
HES-C: 1.285e+02 +/- 1.138e+03	5.405e+04	     87.216		4.570e-01	     87.281	      3.396e+00
Two vertical red lines indicate the start and the end of the interruption. Red hatched areas indicate that the satellite is in the radiation belt.