| Science Run Stop: | 2012:05:17:02:18 |
| Science Run Start: | 2012:05:18:04:52 |
| Interruption: | 95.0ks |
| Triggered by: | auto |
Go to:
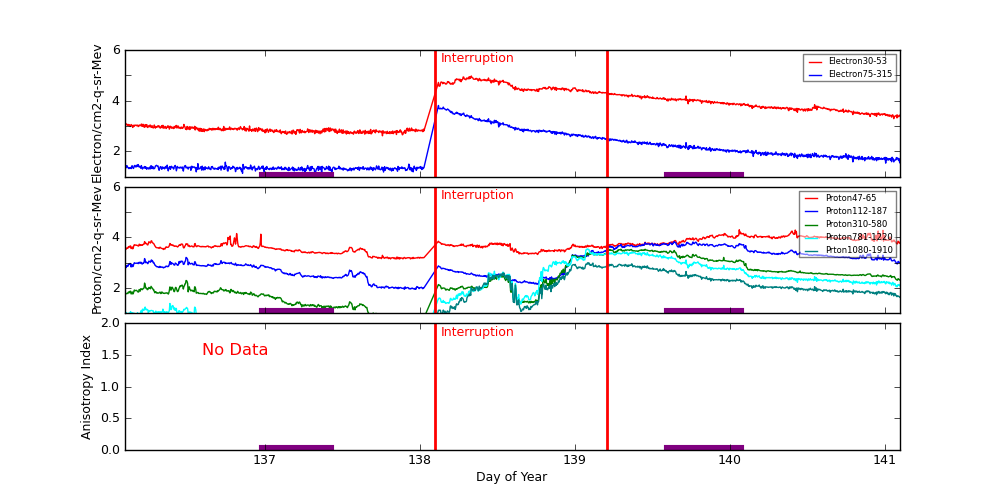
ACE Plot (E38/E175, P47/P112/P310/P761/P1060, Anisotopy)
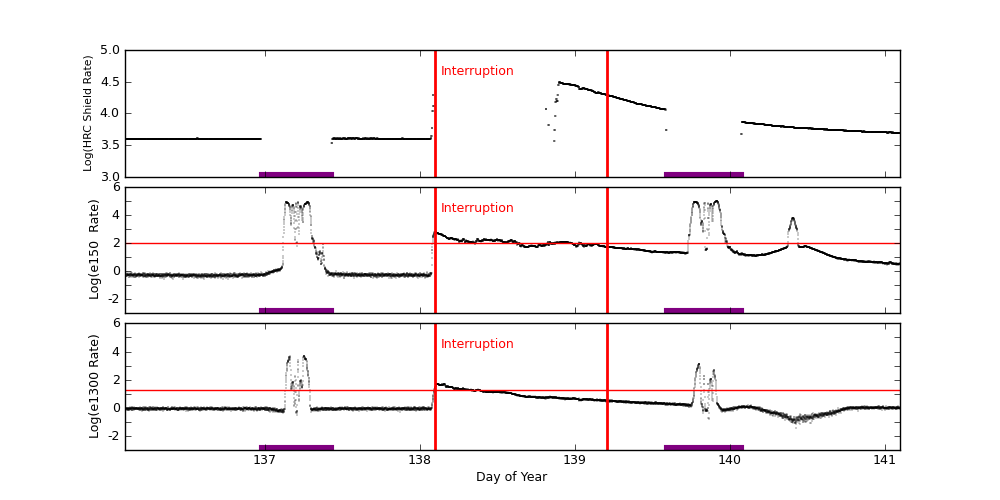
EPHIN Plot (HRC Shield Rate/E150/E1300)
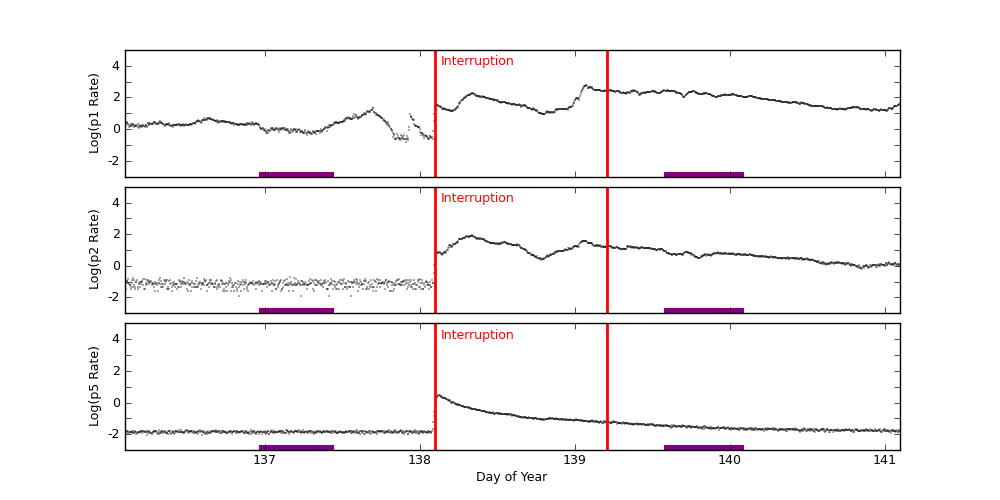
GOES-15 Plot (P1/P2/P5)
ACE radiation data are plotted around periods when science runs were interrupted. Plots start exactly 2 days before the interruption started. The top panel shows differential fluxes of electrons 38-53 and 175-315 (particles/cm2-s-ster-MeV), the middle panel shows differential fluxes of protons 47-65, 112-187, and 310-580 (particles/cm2-s-ster-MeV), and the bottom panel shows anisotropy ratio. The original data are prepared by the U.S. Dept. of Commerce, NOAA, Space Environment Center.
Data Period  (dom): 136.0958 - 141.0958
Interruption (dom): 138.0958 - 139.2028
			Avg		 Max		Time	Min		Time		Value at Interruption Started
--------------------------------------------------------------------------------------------------------------------------
e38 		1.248e+04+/-1.833e+04	9.390e+04	138.330 	4.090e+02	137.757		2.640e+03
e175		3.522e+02+/-7.976e+02	6.430e+03	138.118 	1.190e+01	137.365		3.540e+01
p47 		5.774e+03+/-3.289e+03	1.990e+04	140.059 	1.390e+03	137.844		5.880e+03
p112		1.683e+03+/-1.724e+03	6.780e+03	139.639 	8.840e+01	137.972		1.000e+03
p310		6.111e+02+/-9.072e+02	3.410e+03	139.295 	5.220e+00	137.972		2.070e+02
p761		4.411e+02+/-7.086e+02	3.510e+03	139.080 	6.100e-01	137.913		1.220e+02
p1060		1.547e+02+/-2.320e+02	9.820e+02	139.080 	7.130e-02	137.903		4.320e+01
anisotropy	0.000e+00+/-0.000e+00	0.000e+00	0.000 	1.000e+10	0.000		-1.000e+00

Hardness:
e38/e175	4.872e+01+/-1.796e+01	9.586e+01	140.576 	7.705e+00	138.121		7.458e+01
p47/p1060	1.928e+03+/-2.873e+03	2.132e+04	137.903 	4.440e+00	139.087		1.361e+02
p112/p1060	2.290e+02+/-2.904e+02	1.557e+03	137.903 	8.082e-01	138.535		2.315e+01
p310/p1060	1.873e+01+/-1.943e+01	9.621e+01	137.903 	5.314e-01	138.441		4.792e+00
p761/p1060	3.763e+00+/-1.824e+00	1.250e+01	137.903 	7.658e-01	138.413		2.824e+00

Steepest Rise
------------
	Time		Slope(in log per hr)
----------------------------------------
e1  	138.1181		65639.4083
e175	138.1007		7715.9304
p47 	140.4236		12959.8832
p112	139.2014		5399.9513
p310	139.2014		3959.9643
p761	139.2014		2951.9734
p1060	139.2014		1019.9908
Two vertical red lines indicate the start and the end of the interruption. Purple hatched areas indicate that the satellite is in the radiation belt.
EPHIN Data are used to trigger science run interruptions. The trigger levels are:
| HRC Shield Rate | NA | |
| E150 | 100 | Counts/cm2 sec sr eV |
| E1300 | 20 | Counts/cm2 sec sr eV |
		Avg			Max		Time		Min		Time		Value at Interruption Started
--------------------------------------------------------------------------------------------------------------------------
hrc	hrc	7.816e+03 +/- 6.629e+03		3.133e+04	138.896		8.477e+01	138.817		NA
e150	2.868e+03 +/- 1.284e+04		9.350e+04	139.913		2.606e-01	136.407		5.670e+02
e1300	3.958e+01 +/- 3.118e+02		4.976e+03	137.250		3.909e-02	140.424		2.668e+01
Two vertical red lines indicate the start and the end of the interruption. Red horizontal lines indicate SCS 107 limits. Purple hatched areas indicate that the satellite is in the radiation belt.
GOES-15 data are taken from NOAA site (http://goes.ngdc.noaa.gov).
| P1 | .8 - 4.0 | MeV protons (Counts/cm2 sec sr MeV) Uncorrected |
| P2 | 4.0 - 9.0 | MeV protons (Counts/cm2 sec sr MeV) Uncorrected |
| P5 | 40.0 - 80.0 | MeV protons (Counts/cm2 sec sr MeV) Uncorrected |
		Avg			Max		Time		Min		Time		Value at Interruption Started
--------------------------------------------------------------------------------------------------------------------------
p1	6.516e+01 +/- 9.353e+01		6.210e+02	139.069		1.640e-01	137.906		2.330e+01
p2	7.236e+00 +/- 1.285e+01		8.400e+01	138.337		1.210e-02	136.830		3.130e+00
p5	9.874e-02 +/- 3.100e-01		3.210e+00	138.118		8.850e-03	136.594		8.510e-01
Two vertical red lines indicate the start and the end of the interruption. Red horizontal lines indicate SCS 107 limits. Purple hatched areas indicate that the satellite is in the radiation belt.