| Science Run Stop: | 2011:08:04:07:03 |
| Science Run Start: | 2011:08:07:10:25 |
| Interruption: | 186.5ks |
| Triggered by: | auto |
Go to:
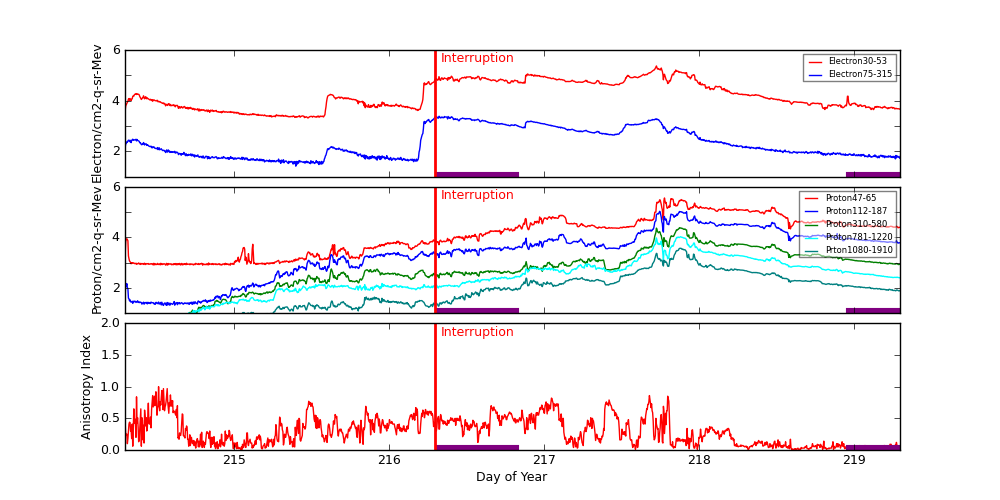
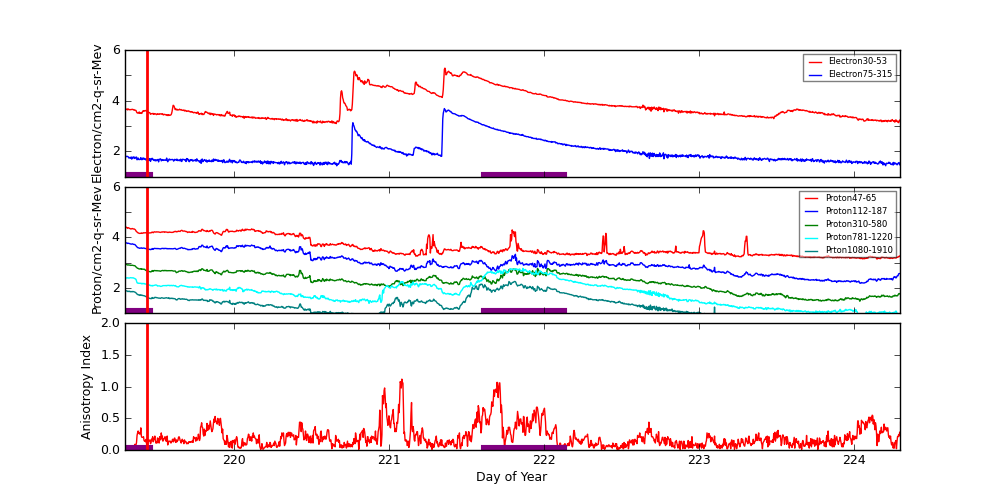
ACE Plot (E38/E175, P47/P112/P310/P761/P1060, Anisotopy)
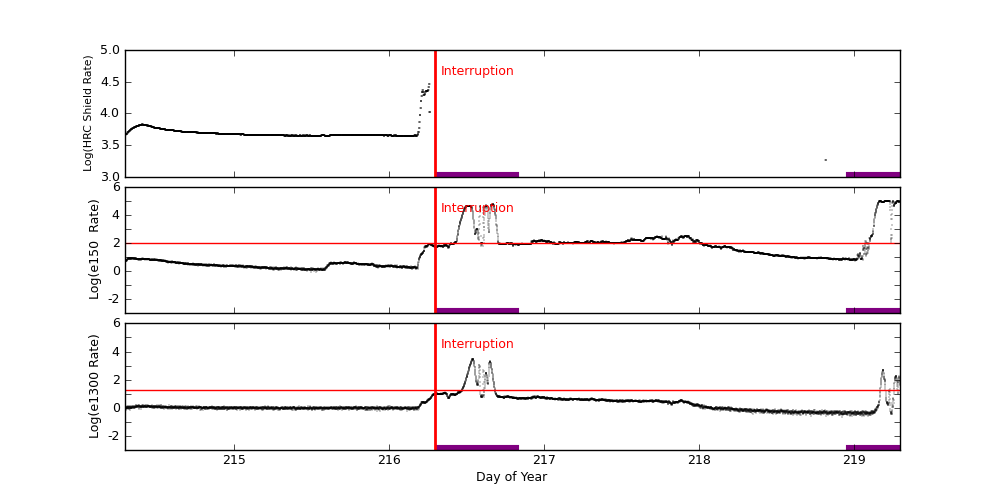
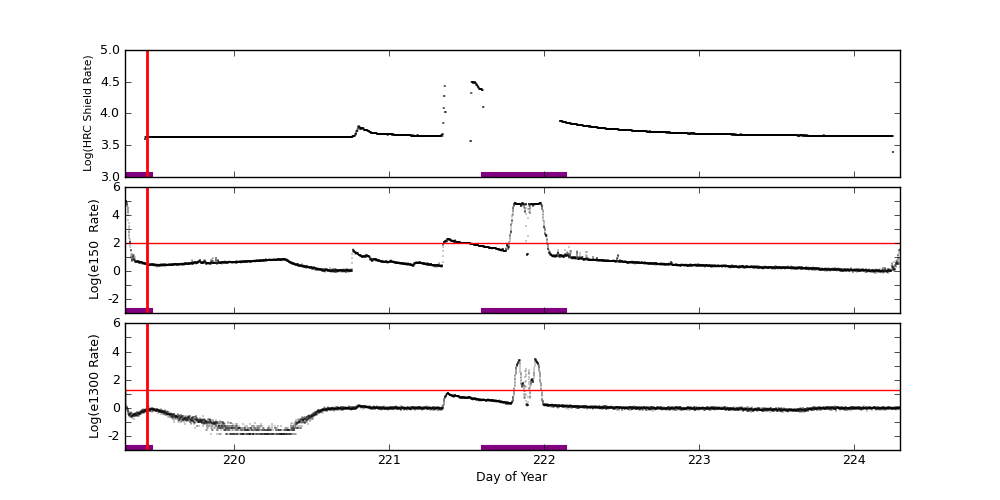
EPHIN Plot (HRC Shield Rate/E150/E1300)
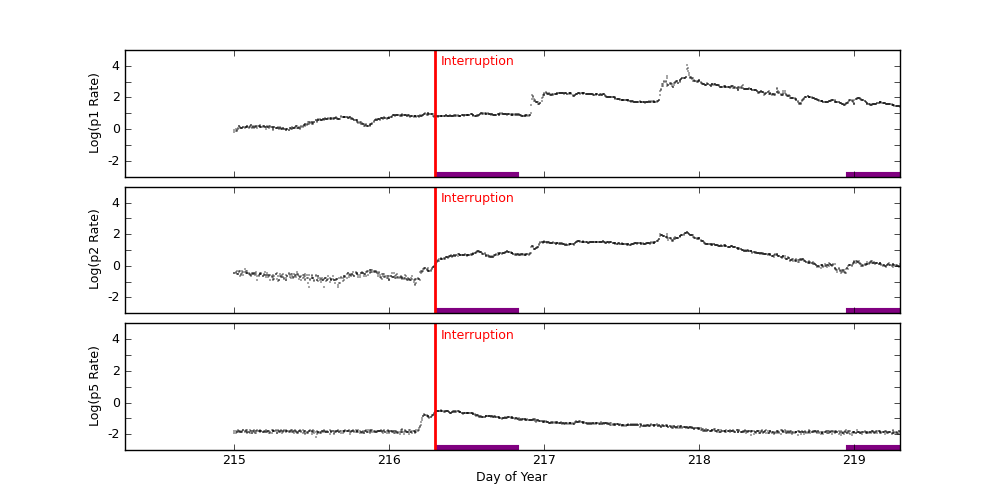
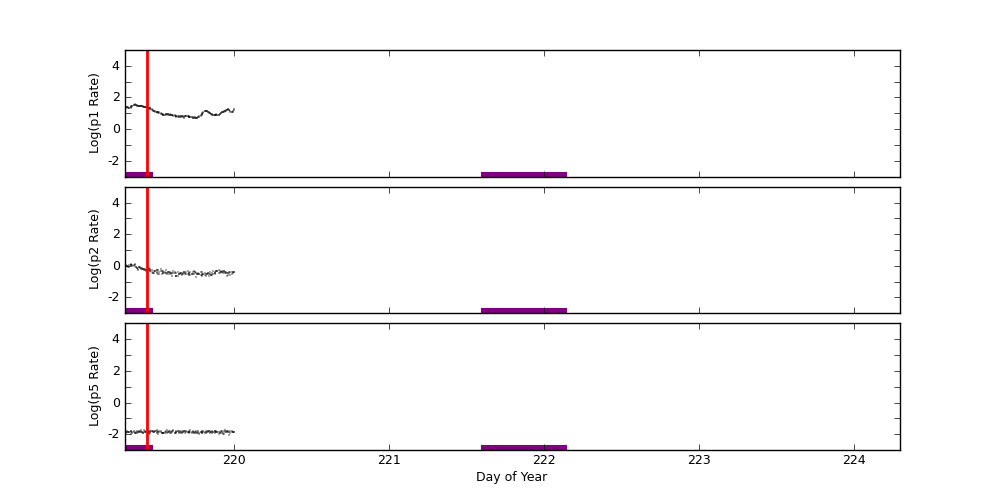
GOES-15 Plot (P1/P2/P5)
ACE radiation data are plotted around periods when science runs were interrupted. Plots start exactly 2 days before the interruption started. The top panel shows differential fluxes of electrons 38-53 and 175-315 (particles/cm2-s-ster-MeV), the middle panel shows differential fluxes of protons 47-65, 112-187, and 310-580 (particles/cm2-s-ster-MeV), and the bottom panel shows anisotropy ratio. The original data are prepared by the U.S. Dept. of Commerce, NOAA, Space Environment Center.
Data Period  (dom): 214.2937 - 224.2937
Interruption (dom): 216.2937 - 219.4340
			Avg		 Max		Time	Min		Time		Value at Interruption Started
--------------------------------------------------------------------------------------------------------------------------
e38 		2.428e+04+/-3.396e+04	2.340e+05	217.722 	1.240e+03	220.656		1.690e+03
e175		3.574e+02+/-6.058e+02	4.860e+03	221.354 	2.580e+01	215.396		2.940e+01
p47 		2.256e+04+/-4.409e+04	3.590e+05	217.774 	7.930e+02	214.972		1.820e+03
p112		5.953e+03+/-1.317e+04	1.070e+05	217.743 	2.040e+01	214.542		3.720e+02
p310		1.050e+03+/-2.614e+03	2.410e+04	217.871 	2.760e+00	214.347		5.880e+01
p761		4.485e+02+/-1.139e+03	1.060e+04	217.879 	6.650e-01	214.295		9.230e+00
p1060		1.340e+02+/-3.598e+02	3.690e+03	217.875 	1.580e-01	214.351		2.900e+00
anisotropy	2.493e-01+/-2.036e-01	1.120e+00	221.080 	1.000e-02	215.038		2.800e-01

Hardness:
e38/e175	8.456e+01+/-5.355e+01	6.533e+02	220.691 	7.912e+00	220.760		5.748e+01
p47/p1060	3.771e+02+/-1.419e+03	5.195e+04	214.302 	2.111e+01	221.771		6.276e+02
p112/p1060	6.093e+01+/-4.641e+01	7.256e+02	214.302 	4.322e+00	214.826		1.283e+02
p310/p1060	9.838e+00+/-4.429e+00	2.768e+01	214.302 	1.572e+00	214.674		2.028e+01
p761/p1060	3.600e+00+/-9.454e-01	1.000e+01	221.087 	1.142e+00	221.535		3.183e+00

Steepest Rise
------------
	Time		Slope(in log per hr)
----------------------------------------
e1  	221.3403		213121.1923
e175	221.3368		5748.2722
p47 	217.7257		282721.5817
p112	217.7257		92880.5196
p310	217.7049		22536.1261
p761	217.7049		8052.0450
p1060	217.8507		2256.0126
Two vertical red lines indicate the start and the end of the interruption. Purple hatched areas indicate that the satellite is in the radiation belt.
EPHIN Data are used to trigger science run interruptions. The trigger levels are:
| HRC Shield Rate | NA | |
| E150 | 100 | Counts/cm2 sec sr eV |
| E1300 | 20 | Counts/cm2 sec sr eV |
		Avg			Max		Time		Min		Time		Value at Interruption Started
--------------------------------------------------------------------------------------------------------------------------
hrc	hrc	5.185e+03 +/- 3.126e+03		3.146e+04	221.528		1.653e+01	218.809		NA
e150	2.896e+03 +/- 1.339e+04		1.018e+05	219.202		4.821e-01	214.254		5.420e+01
e1300	2.428e+01 +/- 1.875e+02		2.969e+03	216.537		1.000e-04	219.910		9.798e+00
Two vertical red lines indicate the start and the end of the interruption. Red horizontal lines indicate SCS 107 limits. Purple hatched areas indicate that the satellite is in the radiation belt.
GOES-15 data are taken from NOAA site (http://goes.ngdc.noaa.gov).
| P1 | .8 - 4.0 | MeV protons (Counts/cm2 sec sr MeV) Uncorrected |
| P2 | 4.0 - 9.0 | MeV protons (Counts/cm2 sec sr MeV) Uncorrected |
| P5 | 40.0 - 80.0 | MeV protons (Counts/cm2 sec sr MeV) Uncorrected |
		Avg			Max		Time		Min		Time		Value at Interruption Started
--------------------------------------------------------------------------------------------------------------------------
p1	1.550e+02 +/- 5.103e+02		1.190e+04	217.917		6.990e-01	215.000		6.650e+00
p2	1.100e+01 +/- 1.937e+01		1.380e+02	217.917		4.840e-02	215.481		1.260e+00
p5	4.279e-02 +/- 5.939e-02		3.200e-01	216.333		6.880e-03	215.523		2.920e-01
Two vertical red lines indicate the start and the end of the interruption. Red horizontal lines indicate SCS 107 limits. Purple hatched areas indicate that the satellite is in the radiation belt.