| Science Run Stop: | 2004:11:10:16:41 |
| Science Run Start: | 2004:11:12:15:15 |
| Interruption: | 103.1ks |
| Triggered by: | auto |
Go to:
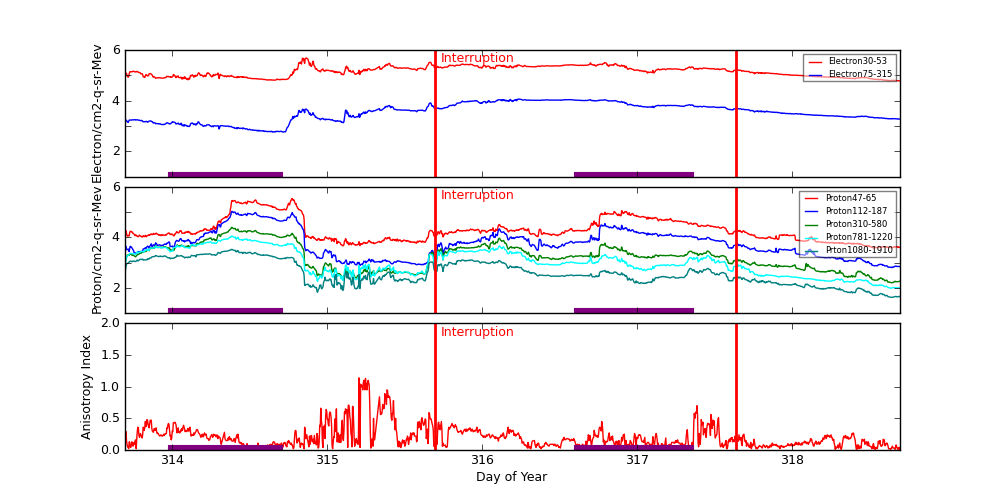
ACE Plot (E38/E175, P47/P112/P310/P761/P1060, Anisotopy)
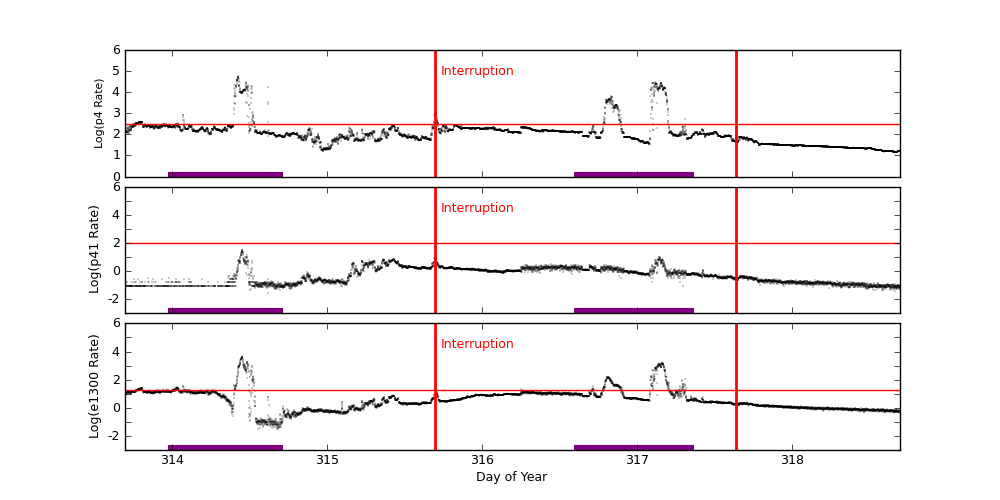
EPHIN Plot (P4/P41/E1300)
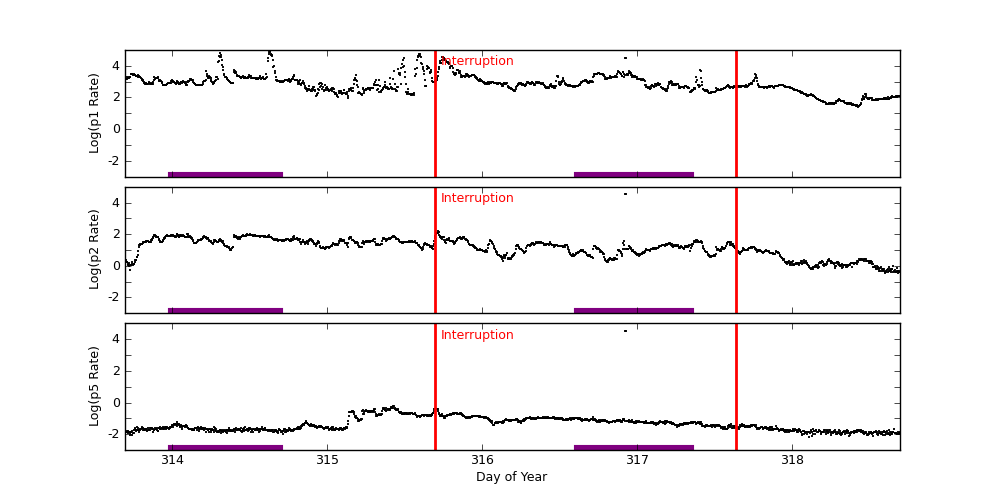
GOES-11 Plot (P1/P2/P5)
ACE radiation data are plotted around periods when science runs were interrupted. Plots start exactly 2 days before the interruption started. The top panel shows differential fluxes of electrons 38-53 and 175-315 (particles/cm2-s-ster-MeV), the middle panel shows differential fluxes of protons 47-65, 112-187, and 310-580 (particles/cm2-s-ster-MeV), and the bottom panel shows anisotropy ratio. The original data are prepared by the U.S. Dept. of Commerce, NOAA, Space Environment Center.
Data Period  (dom): 313.6951 - 318.6951
Interruption (dom): 315.6951 - 317.6354
			Avg		 Max		Time	Min		Time		Value at Interruption Started
--------------------------------------------------------------------------------------------------------------------------
e38 		1.591e+05+/-7.182e+04	4.850e+05	314.865 	6.000e+04	318.688		6.030e+04
e175		4.675e+03+/-3.295e+03	1.160e+04	316.236 	5.690e+02	314.715		1.890e+03
p47 		3.789e+04+/-5.885e+04	3.420e+05	314.774 	3.810e+03	318.524		3.930e+03
p112		1.247e+04+/-1.973e+04	1.060e+05	314.385 	6.350e+02	318.642		7.000e+02
p310		3.344e+03+/-4.371e+03	2.470e+04	314.385 	1.610e+02	318.639		1.860e+02
p761		1.937e+03+/-2.200e+03	1.130e+04	314.382 	9.780e+01	318.635		1.000e+02
p1060		6.834e+02+/-7.318e+02	3.340e+03	314.382 	4.230e+01	318.639		4.600e+01
anisotropy	2.010e-01+/-1.771e-01	1.140e+00	315.205 	1.000e-02	314.517		4.000e-02

Hardness:
e38/e175	4.779e+01+/-2.759e+01	1.218e+02	314.715 	2.047e+01	316.201		3.190e+01
p47/p1060	7.578e+01+/-7.958e+01	4.551e+02	316.986 	6.538e+00	313.951		8.543e+01
p112/p1060	2.080e+01+/-1.952e+01	1.038e+02	316.986 	1.944e+00	313.774		1.522e+01
p310/p1060	4.879e+00+/-2.226e+00	1.196e+01	316.792 	1.270e+00	315.118		4.043e+00
p761/p1060	2.704e+00+/-5.993e-01	4.843e+00	316.698 	1.438e+00	317.757		2.174e+00

Steepest Rise
------------
	Time		Slope(in log per hr)
----------------------------------------
e1  	314.8229		364796.7117
e175	316.3438		12479.8875
p47 	314.3681		271197.5554
p112	314.3681		74039.3326
p310	314.3507		22559.7966
p761	314.3472		11315.8980
p1060	314.3472		3647.9671
Two vertical red lines indicate the start and the end of the interruption. Purple hatched areas indicate that the satellite is in the radiation belt.
EPHIN Data are used to trigger science run interruptions. The trigger levels are:
| P4 | 300 | Counts/cm2 sec sr MeV |
| P41 | 10 | Counts/cm2 sec sr MeV |
| E1300 | 20 | Counts/cm2 sec sr MeV |
		Avg			Max		Time		Min		Time		Value at Interruption Started
--------------------------------------------------------------------------------------------------------------------------
p4	8.077e+02 +/- 3.729e+03		5.637e+04	314.426		1.392e+01	318.747		8.699e+02
p41	9.558e-01 +/- 1.745e+00		3.176e+01	314.453		1.000e-04	313.492		7.029e+00
e1300	4.073e+01 +/- 2.420e+02		4.244e+03	314.450		1.000e-04	314.537		1.753e+01
Two vertical red lines indicate the start and the end of the interruption. Red horizontal lines indicate SCS 107 limits. Purple hatched areas indicate that the satellite is in the radiation belt.
GOES-11 data are taken from NOAA site (http://goes.ngdc.noaa.gov).
| P1 | .8 - 4.0 | MeV protons (Counts/cm2 sec sr MeV) Uncorrected |
| P2 | 4.0 - 9.0 | MeV protons (Counts/cm2 sec sr MeV) Uncorrected |
| P5 | 40.0 - 80.0 | MeV protons (Counts/cm2 sec sr MeV) Uncorrected |
		Avg			Max		Time		Min		Time		Value at Interruption Started
--------------------------------------------------------------------------------------------------------------------------
p1	2.257e+03 +/- 7.032e+03		8.830e+04	314.628		2.670e+01	318.424		1.140e+03
p2	7.044e+01 +/- 1.217e+03		3.270e+04	316.924		3.360e-01	318.601		8.200e+01
p5	4.549e+01 +/- 1.218e+03		3.270e+04	316.924		6.750e-03	318.108		3.550e-01
Two vertical red lines indicate the start and the end of the interruption. Red horizontal lines indicate SCS 107 limits. Purple hatched areas indicate that the satellite is in the radiation belt.