| Science Run Stop: | 2004:07:28:19:24 |
| Science Run Start: | 2004:07:29:01:30 |
| Interruption: | 3.9ks |
| Triggered by: | auto |
Go to:
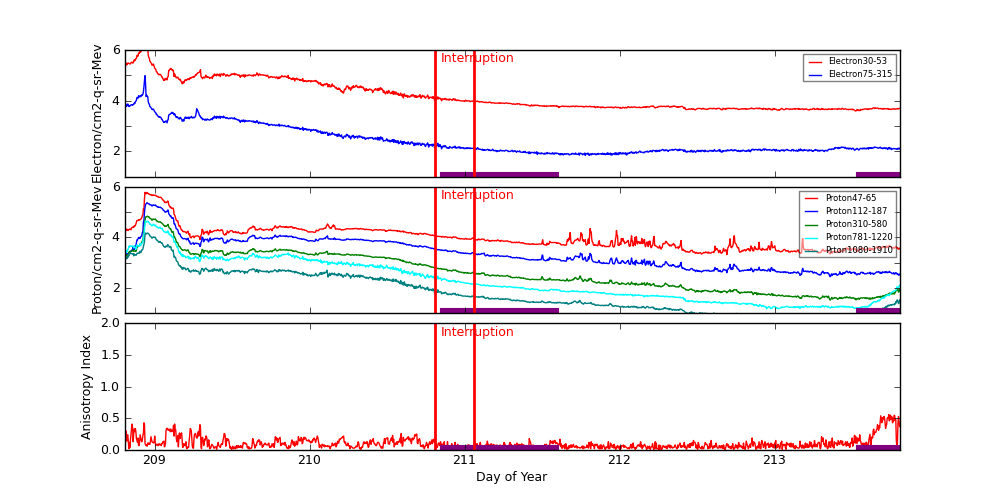
ACE Plot (E38/E175, P47/P112/P310/P761/P1060, Anisotopy)
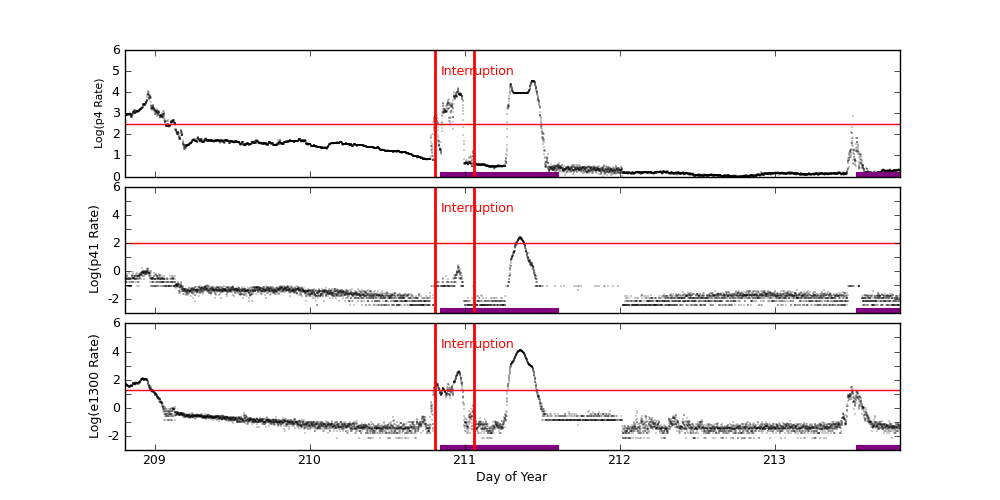
EPHIN Plot (P4/P41/E1300)
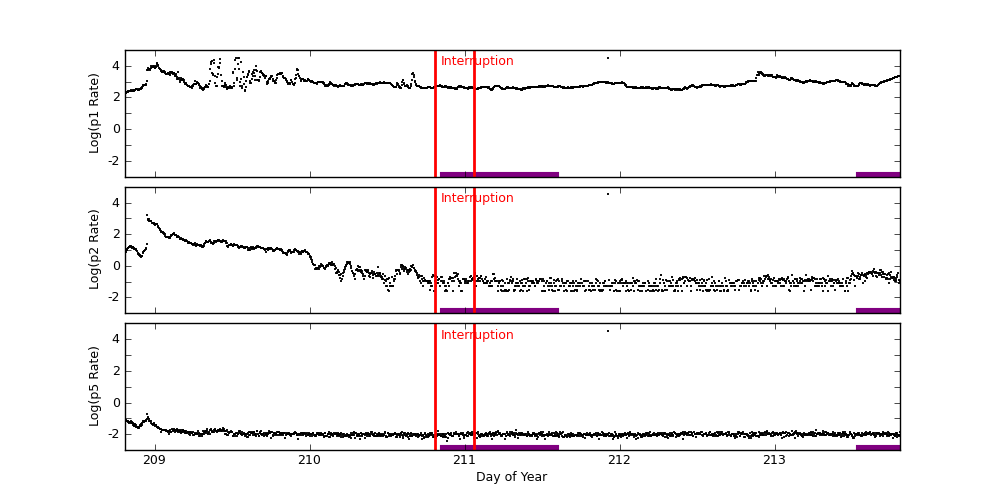
GOES-11 Plot (P1/P2/P5)
ACE radiation data are plotted around periods when science runs were interrupted. Plots start exactly 2 days before the interruption started. The top panel shows differential fluxes of electrons 38-53 and 175-315 (particles/cm2-s-ster-MeV), the middle panel shows differential fluxes of protons 47-65, 112-187, and 310-580 (particles/cm2-s-ster-MeV), and the bottom panel shows anisotropy ratio. The original data are prepared by the U.S. Dept. of Commerce, NOAA, Space Environment Center.
Data Period  (dom): 208.8083 - 213.8083
Interruption (dom): 210.8083 - 211.0625
			Avg		 Max		Time	Min		Time		Value at Interruption Started
--------------------------------------------------------------------------------------------------------------------------
e38 		6.066e+04+/-3.201e+05	7.490e+06	208.938 	3.900e+03	213.521		4.910e+03
e175		9.707e+02+/-3.912e+03	9.670e+04	208.938 	6.870e+01	211.778		1.240e+02
p47 		2.457e+04+/-7.311e+04	6.010e+05	208.938 	2.070e+03	212.691		3.690e+03
p112		9.083e+03+/-2.903e+04	2.310e+05	208.951 	2.800e+02	213.358		3.540e+02
p310		2.528e+03+/-8.251e+03	6.820e+04	208.955 	3.320e+01	213.358		8.750e+01
p761		1.519e+03+/-5.059e+03	4.450e+04	208.941 	1.490e+01	213.545		1.270e+02
p1060		4.909e+02+/-1.652e+03	1.490e+04	208.941 	5.640e+00	213.354		3.320e+01
anisotropy	1.031e-01+/-9.033e-02	5.600e-01	213.736 	1.000e-02	209.399		3.700e-01

Hardness:
e38/e175	6.103e+01+/-1.758e+01	1.124e+02	208.934 	2.385e+01	209.271		3.960e+01
p47/p1060	2.179e+02+/-1.711e+02	1.351e+03	213.181 	8.388e+00	208.844		1.111e+02
p112/p1060	4.126e+01+/-1.825e+01	9.796e+01	212.736 	1.043e+00	208.840		1.066e+01
p310/p1060	6.913e+00+/-1.600e+00	1.010e+01	211.746 	1.101e+00	208.840		2.636e+00
p761/p1060	3.041e+00+/-4.478e-01	4.724e+00	209.844 	1.716e+00	208.879		3.825e+00

Steepest Rise
------------
	Time		Slope(in log per hr)
----------------------------------------
e1  	208.9201		8037690.5655
e175	208.9201		99121.1169
p47 	208.9201		663727.4786
p112	208.9340		262922.9625
p310	208.9340		73716.8306
p761	208.9236		46572.5248
p1060	208.9236		14472.1631
Two vertical red lines indicate the start and the end of the interruption. Purple hatched areas indicate that the satellite is in the radiation belt.
EPHIN Data are used to trigger science run interruptions. The trigger levels are:
| P4 | 300 | Counts/cm2 sec sr MeV |
| P41 | 10 | Counts/cm2 sec sr MeV |
| E1300 | 20 | Counts/cm2 sec sr MeV |
		Avg			Max		Time		Min		Time		Value at Interruption Started
--------------------------------------------------------------------------------------------------------------------------
p4	1.026e+03 +/- 4.268e+03		4.327e+04	208.758		8.690e-01	212.777		6.477e+02
p41	2.150e+00 +/- 1.807e+01		2.791e+02	211.360		1.000e-04	208.809		1.000e-04
e1300	1.531e+02 +/- 1.074e+03		1.229e+04	211.357		1.000e-04	209.080		5.056e+01
Two vertical red lines indicate the start and the end of the interruption. Red horizontal lines indicate SCS 107 limits. Purple hatched areas indicate that the satellite is in the radiation belt.
GOES-11 data are taken from NOAA site (http://goes.ngdc.noaa.gov).
| P1 | .8 - 4.0 | MeV protons (Counts/cm2 sec sr MeV) Uncorrected |
| P2 | 4.0 - 9.0 | MeV protons (Counts/cm2 sec sr MeV) Uncorrected |
| P5 | 40.0 - 80.0 | MeV protons (Counts/cm2 sec sr MeV) Uncorrected |
		Avg			Max		Time		Min		Time		Value at Interruption Started
--------------------------------------------------------------------------------------------------------------------------
p1	1.288e+03 +/- 2.583e+03		3.270e+04	211.924		1.950e+02	208.809		4.660e+02
p2	3.959e+01 +/- 8.800e+02		3.270e+04	211.924		2.580e-02	210.514		2.330e-01
p5	2.272e+01 +/- 8.614e+02		3.270e+04	211.924		3.780e-03	210.885		8.090e-03
Two vertical red lines indicate the start and the end of the interruption. Red horizontal lines indicate SCS 107 limits. Purple hatched areas indicate that the satellite is in the radiation belt.