| Science Run Stop: | 2002:07:17:12:32 |
| Science Run Start: | 2002:07:18:15:45 |
| Interruption: | 97.9ks |
| Triggered by: | auto |
Go to:
ACE Plot (E38/E175, P47/P112/P310/P761/P1060, Anisotopy)
EPHIN Plot (P4/P41/E1300)
GOES-11 Plot (P1/P2/P5)
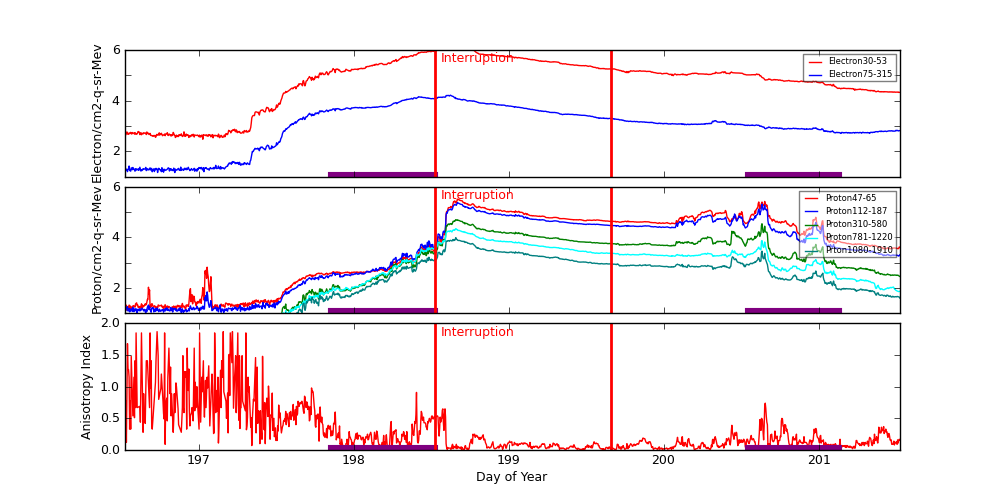
ACE radiation data are plotted around periods when science runs were interrupted. Plots start exactly 2 days before the interruption started. The top panel shows differential fluxes of electrons 38-53 and 175-315 (particles/cm2-s-ster-MeV), the middle panel shows differential fluxes of protons 47-65, 112-187, and 310-580 (particles/cm2-s-ster-MeV), and the bottom panel shows anisotropy ratio. The original data are prepared by the U.S. Dept. of Commerce, NOAA, Space Environment Center.
Data Period  (dom): 196.5222 - 201.5222
Interruption (dom): 198.5222 - 199.6562
			Avg		 Max		Time	Min		Time		Value at Interruption Started
--------------------------------------------------------------------------------------------------------------------------
e38 		2.206e+05+/-3.045e+05	1.620e+06	198.621 	2.980e+02	197.024		2.130e+04
e175		3.004e+03+/-3.724e+03	1.640e+04	198.621 	1.440e+01	196.844		6.520e+02
p47 		3.857e+04+/-5.486e+04	3.230e+05	198.667 	1.270e+01	196.819		4.100e+03
p112		2.668e+04+/-3.913e+04	2.360e+05	198.667 	9.690e+00	196.601		2.040e+03
p310		5.253e+03+/-8.202e+03	5.000e+04	198.656 	7.660e-01	196.826		2.860e+02
p761		2.215e+03+/-3.581e+03	2.210e+04	198.656 	2.370e-01	196.601		7.360e+01
p1060		8.973e+02+/-1.461e+03	9.740e+03	198.656 	4.170e-02	196.542		4.010e+01
anisotropy	3.032e-01+/-4.034e-01	2.000e+00	196.597 	1.000e-02	198.219		1.600e-01

Hardness:
e38/e175	6.306e+01+/-3.052e+01	1.100e+02	200.438 	1.536e+01	197.108		3.267e+01
p47/p1060	7.670e+01+/-1.711e+02	3.217e+03	197.056 	1.957e+00	198.371		1.022e+02
p112/p1060	4.258e+01+/-4.074e+01	4.330e+02	197.056 	2.609e+00	198.385		5.087e+01
p310/p1060	6.374e+00+/-3.973e+00	4.148e+01	196.934 	1.377e+00	198.205		7.132e+00
p761/p1060	2.488e+00+/-9.998e-01	1.811e+01	196.542 	6.690e-01	196.941		1.835e+00

Steepest Rise
------------
	Time		Slope(in log per hr)
----------------------------------------
e1  	198.6042		599994.5916
e175	198.6042		3359.9697
p47 	200.5938		209158.1146
p112	200.6146		158398.5722
p310	198.6042		32663.7056
p761	198.5868		13367.8795
p1060	198.5868		6287.9433
Two vertical red lines indicate the start and the end of the interruption. Purple hatched areas indicate that the satellite is in the radiation belt.
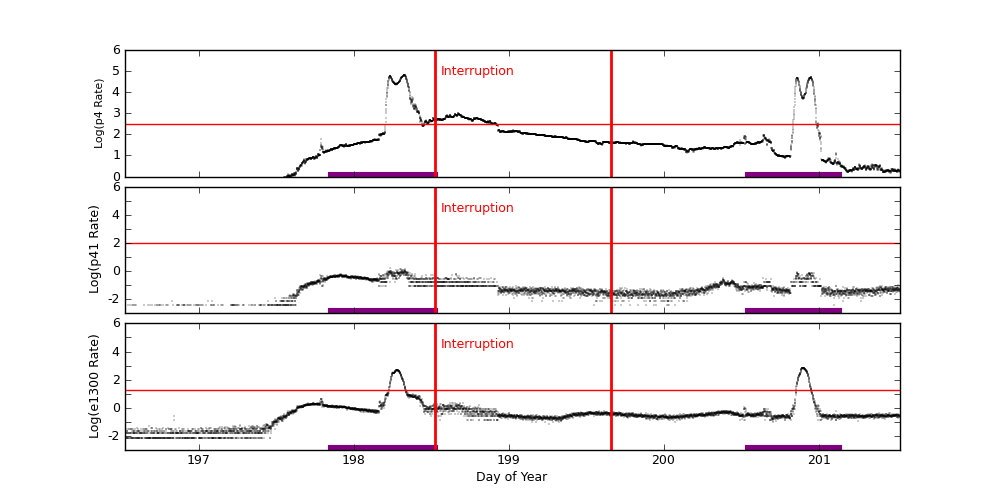
EPHIN Data are used to trigger science run interruptions. The trigger levels are:
| P4 | 300 | Counts/cm2 sec sr MeV |
| P41 | 10 | Counts/cm2 sec sr MeV |
| E1300 | 20 | Counts/cm2 sec sr MeV |
		Avg			Max		Time		Min		Time		Value at Interruption Started
--------------------------------------------------------------------------------------------------------------------------
p4	1.820e+03 +/- 8.105e+03		6.608e+04	198.323		2.966e-03	196.623		4.770e+02
p41	9.568e-02 +/- 1.589e-01		1.609e+00	198.230		1.000e-04	196.439		1.694e-01
e1300	1.173e+01 +/- 6.721e+01		6.870e+02	200.892		1.000e-04	196.449		5.081e-01
Two vertical red lines indicate the start and the end of the interruption. Red horizontal lines indicate SCS 107 limits. Purple hatched areas indicate that the satellite is in the radiation belt.
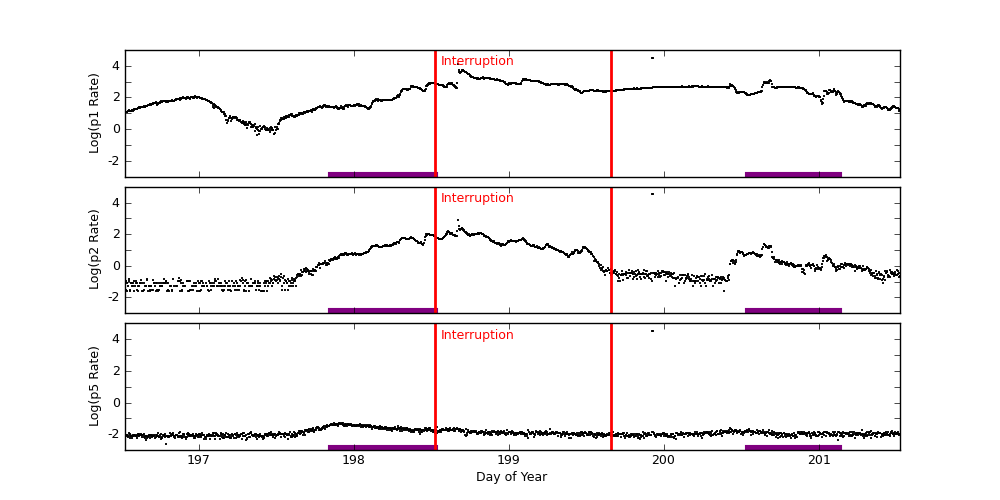
GOES-11 data are taken from NOAA site (http://goes.ngdc.noaa.gov).
| P1 | .8 - 4.0 | MeV protons (Counts/cm2 sec sr MeV) Uncorrected |
| P2 | 4.0 - 9.0 | MeV protons (Counts/cm2 sec sr MeV) Uncorrected |
| P5 | 40.0 - 80.0 | MeV protons (Counts/cm2 sec sr MeV) Uncorrected |
		Avg			Max		Time		Min		Time		Value at Interruption Started
--------------------------------------------------------------------------------------------------------------------------
p1	4.393e+02 +/- 1.390e+03		3.270e+04	199.924		4.000e-01	197.375		7.480e+02
p2	6.182e+01 +/- 1.232e+03		3.270e+04	199.924		2.580e-02	196.535		7.290e+01
p5	4.543e+01 +/- 1.218e+03		3.270e+04	199.924		2.520e-03	196.785		1.760e-02
Two vertical red lines indicate the start and the end of the interruption. Red horizontal lines indicate SCS 107 limits. Purple hatched areas indicate that the satellite is in the radiation belt.