| Science Run Stop: | 2001:10:25:23:17 |
| Science Run Start: | 2001:10:27:10:40 |
| Interruption: | 119.9ks |
| Triggered by: | manual |
Go to:
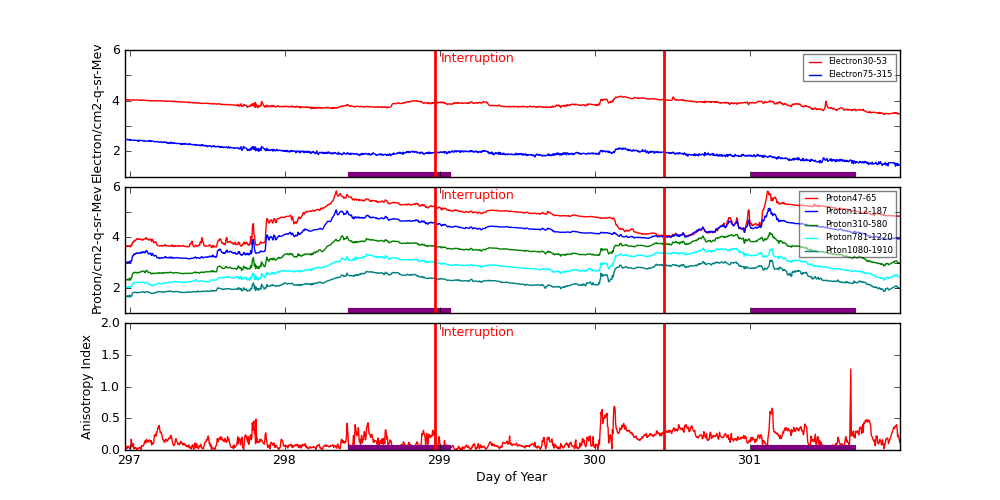
ACE Plot (E38/E175, P47/P112/P310/P761/P1060, Anisotopy)
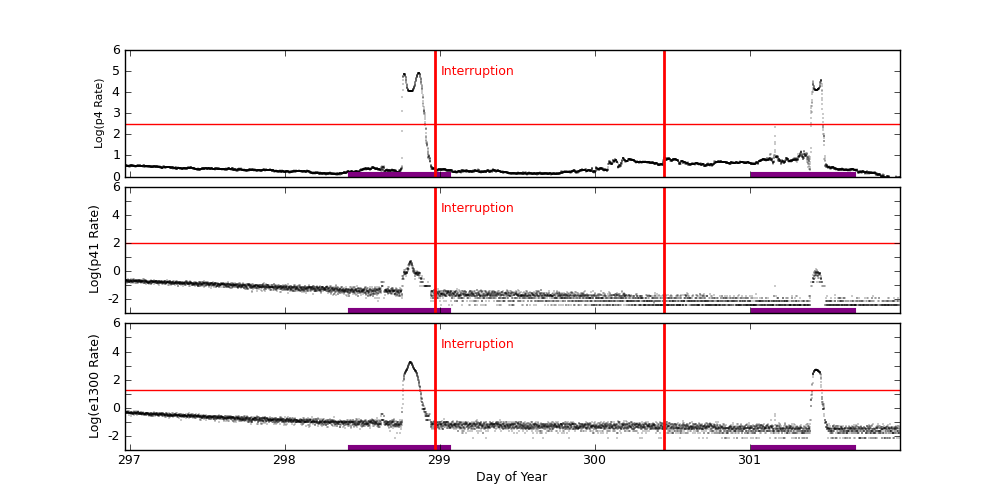
EPHIN Plot (P4/P41/E1300)
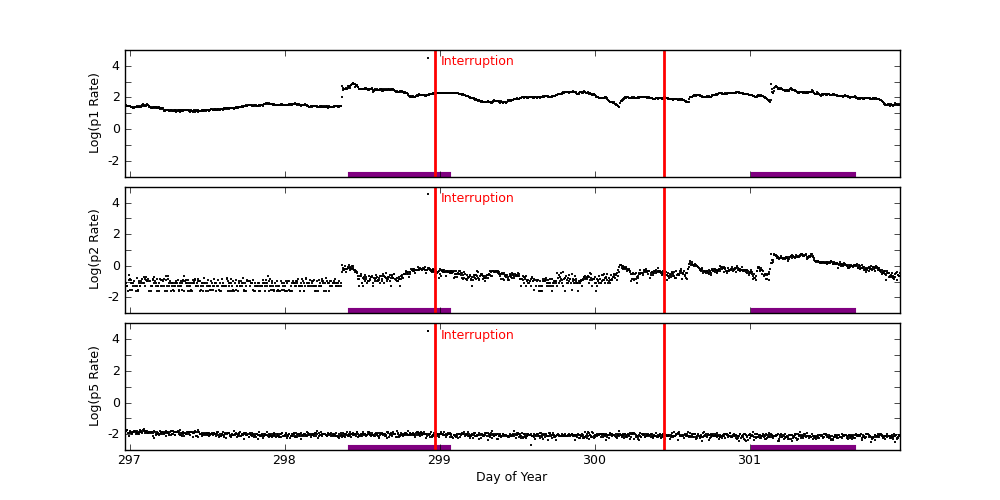
GOES-11 Plot (P1/P2/P5)
ACE radiation data are plotted around periods when science runs were interrupted. Plots start exactly 2 days before the interruption started. The top panel shows differential fluxes of electrons 38-53 and 175-315 (particles/cm2-s-ster-MeV), the middle panel shows differential fluxes of protons 47-65, 112-187, and 310-580 (particles/cm2-s-ster-MeV), and the bottom panel shows anisotropy ratio. The original data are prepared by the U.S. Dept. of Commerce, NOAA, Space Environment Center.
Data Period  (dom): 296.9701 - 301.9701
Interruption (dom): 298.9701 - 300.4444
			Avg		 Max		Time	Min		Time		Value at Interruption Started
--------------------------------------------------------------------------------------------------------------------------
e38 		7.466e+03+/-2.290e+03	1.510e+04	300.167 	2.870e+03	301.865		3.030e+03
e175		9.684e+01+/-5.226e+01	3.070e+02	296.972 	2.570e+01	301.941		2.880e+01
p47 		9.941e+04+/-1.031e+05	6.860e+05	298.333 	3.910e+03	297.531		6.840e+04
p112		2.323e+04+/-2.069e+04	1.410e+05	301.128 	9.940e+02	296.979		8.740e+03
p310		3.836e+03+/-2.904e+03	1.540e+04	301.132 	2.050e+02	296.983		9.430e+02
p761		1.042e+03+/-8.498e+02	3.720e+03	300.913 	1.010e+02	296.979		2.730e+02
p1060		3.095e+02+/-2.656e+02	1.240e+03	301.132 	4.440e+01	296.993		9.670e+01
anisotropy	1.566e-01+/-1.208e-01	1.280e+00	301.653 	1.000e-02	297.045		1.200e-01

Hardness:
e38/e175	8.850e+01+/-3.115e+01	2.015e+02	301.493 	3.492e+01	296.979		1.052e+02
p47/p1060	4.288e+02+/-3.535e+02	2.711e+03	298.333 	1.306e+01	300.451		7.073e+02
p112/p1060	9.202e+01+/-6.593e+01	4.704e+02	298.333 	1.229e+01	300.451		9.038e+01
p310/p1060	1.308e+01+/-5.809e+00	3.506e+01	298.372 	4.374e+00	297.007		9.752e+00
p761/p1060	3.374e+00+/-6.855e-01	5.510e+00	299.681 	2.010e+00	297.142		2.823e+00

Steepest Rise
------------
	Time		Slope(in log per hr)
----------------------------------------
e1  	297.8785		7163.9354
e175	297.8785		140.3987
p47 	301.0972		725393.4612
p112	301.1042		107279.0330
p310	301.1111		8843.9203
p761	301.1285		2039.9816
p1060	301.1285		805.1927
Two vertical red lines indicate the start and the end of the interruption. Purple hatched areas indicate that the satellite is in the radiation belt.
EPHIN Data are used to trigger science run interruptions. The trigger levels are:
| P4 | 300 | Counts/cm2 sec sr MeV |
| P41 | 10 | Counts/cm2 sec sr MeV |
| E1300 | 20 | Counts/cm2 sec sr MeV |
		Avg			Max		Time		Min		Time		Value at Interruption Started
--------------------------------------------------------------------------------------------------------------------------
p4	1.136e+03 +/- 7.232e+03		8.551e+04	298.865		5.160e-01	301.931		2.284e+00
p41	8.425e-02 +/- 2.884e-01		5.251e+00	298.813		1.000e-04	298.624		2.006e-02
e1300	1.783e+01 +/- 1.261e+02		1.768e+03	298.810		1.000e-04	298.628		9.859e-02
Two vertical red lines indicate the start and the end of the interruption. Red horizontal lines indicate SCS 107 limits. Purple hatched areas indicate that the satellite is in the radiation belt.
GOES-11 data are taken from NOAA site (http://goes.ngdc.noaa.gov).
| P1 | .8 - 4.0 | MeV protons (Counts/cm2 sec sr MeV) Uncorrected |
| P2 | 4.0 - 9.0 | MeV protons (Counts/cm2 sec sr MeV) Uncorrected |
| P5 | 40.0 - 80.0 | MeV protons (Counts/cm2 sec sr MeV) Uncorrected |
		Avg			Max		Time		Min		Time		Value at Interruption Started
--------------------------------------------------------------------------------------------------------------------------
p1	1.439e+02 +/- 8.652e+02		3.270e+04	298.924		1.230e+01	297.424		1.900e+02
p2	2.369e+01 +/- 8.696e+02		3.270e+04	298.924		2.580e-02	296.990		2.490e-01
p5	4.543e+01 +/- 1.218e+03		3.270e+04	298.924		2.100e-03	299.587		6.710e-03
Two vertical red lines indicate the start and the end of the interruption. Red horizontal lines indicate SCS 107 limits. Purple hatched areas indicate that the satellite is in the radiation belt.