| Science Run Stop: | 2001:10:21:15:38 |
| Science Run Start: | 2001:10:23:08:00 |
| Interruption: | 92.8ks |
| Triggered by: | manual |
Go to:
ACE Plot (E38/E175, P47/P112/P310/P761/P1060, Anisotopy)
EPHIN Plot (P4/P41/E1300)
GOES-11 Plot (P1/P2/P5)
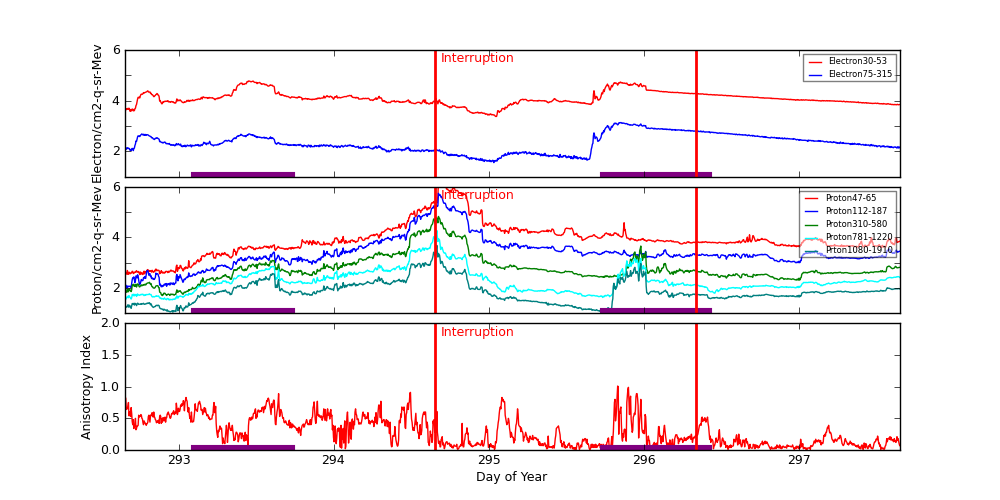
ACE radiation data are plotted around periods when science runs were interrupted. Plots start exactly 2 days before the interruption started. The top panel shows differential fluxes of electrons 38-53 and 175-315 (particles/cm2-s-ster-MeV), the middle panel shows differential fluxes of protons 47-65, 112-187, and 310-580 (particles/cm2-s-ster-MeV), and the bottom panel shows anisotropy ratio. The original data are prepared by the U.S. Dept. of Commerce, NOAA, Space Environment Center.
Data Period  (dom): 292.6514 - 297.6514
Interruption (dom): 294.6514 - 296.3333
			Avg		 Max		Time	Min		Time		Value at Interruption Started
--------------------------------------------------------------------------------------------------------------------------
e38 		1.506e+04+/-1.132e+04	5.960e+04	293.451 	2.380e+03	295.042		6.990e+03
e175		2.919e+02+/-2.666e+02	1.370e+03	295.851 	3.560e+01	295.031		1.460e+02
p47 		4.827e+04+/-1.866e+05	1.910e+06	294.688 	3.390e+02	292.747		7.020e+03
p112		1.254e+04+/-4.419e+04	5.480e+05	294.674 	9.940e+01	292.663		2.830e+03
p310		2.094e+03+/-6.384e+03	6.690e+04	294.674 	5.000e+01	292.892		6.520e+02
p761		4.582e+02+/-1.173e+03	1.850e+04	294.663 	3.370e+01	292.941		2.600e+02
p1060		1.428e+02+/-2.936e+02	4.820e+03	294.663 	1.120e+01	292.958		9.140e+01
anisotropy	2.904e-01+/-2.263e-01	1.010e+00	295.830 	1.000e-02	294.799		7.000e-02

Hardness:
e38/e175	6.739e+01+/-3.464e+01	1.799e+02	295.424 	2.506e+01	292.722		4.788e+01
p47/p1060	2.533e+02+/-3.691e+02	2.072e+03	294.688 	8.495e+00	295.979		7.681e+01
p112/p1060	6.052e+01+/-7.098e+01	4.772e+02	294.688 	2.944e+00	295.979		3.096e+01
p310/p1060	1.007e+01+/-7.077e+00	3.839e+01	294.688 	1.286e+00	295.851		7.133e+00
p761/p1060	2.721e+00+/-5.833e-01	5.017e+00	294.622 	8.571e-01	295.802		2.845e+00

Steepest Rise
------------
	Time		Slope(in log per hr)
----------------------------------------
e1  	295.7396		29399.7350
e175	295.7986		742.7933
p47 	294.6701		2032781.6763
p112	294.6562		487195.6084
p310	294.6285		43319.6095
p761	294.6458		15419.8610
p1060	294.6458		4391.9604
Two vertical red lines indicate the start and the end of the interruption. Purple hatched areas indicate that the satellite is in the radiation belt.
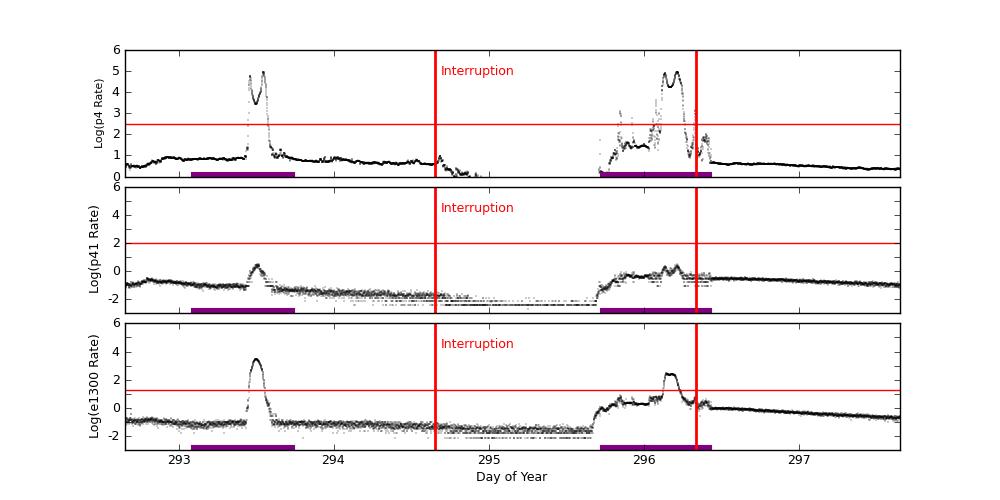
EPHIN Data are used to trigger science run interruptions. The trigger levels are:
| P4 | 300 | Counts/cm2 sec sr MeV |
| P41 | 10 | Counts/cm2 sec sr MeV |
| E1300 | 20 | Counts/cm2 sec sr MeV |
		Avg			Max		Time		Min		Time		Value at Interruption Started
--------------------------------------------------------------------------------------------------------------------------
p4	1.617e+03 +/- 9.192e+03		9.505e+04	296.213		1.038e-01	295.652		3.781e+00
p41	1.716e-01 +/- 3.029e-01		3.218e+00	293.501		1.000e-04	292.688		2.407e-02
e1300	2.952e+01 +/- 2.290e+02		2.919e+03	293.494		1.000e-04	292.691		6.826e-02
Two vertical red lines indicate the start and the end of the interruption. Red horizontal lines indicate SCS 107 limits. Purple hatched areas indicate that the satellite is in the radiation belt.
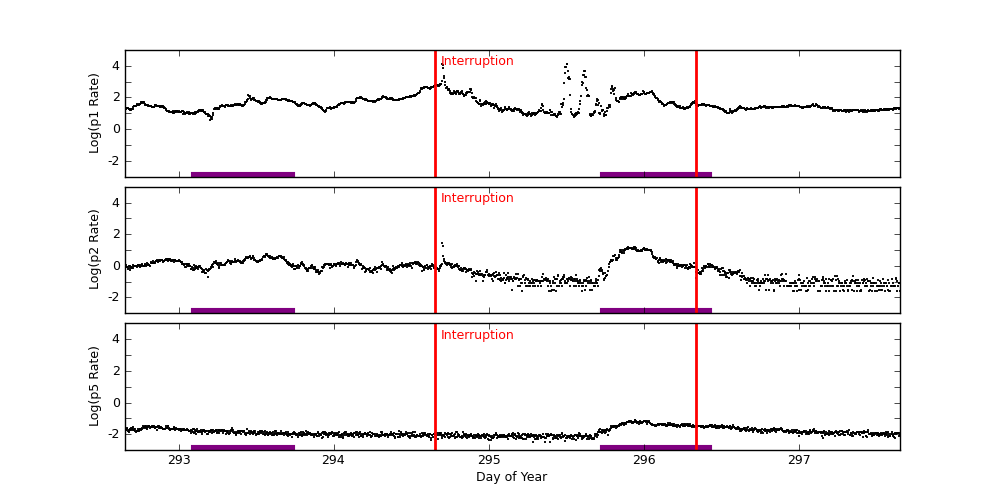
GOES-11 data are taken from NOAA site (http://goes.ngdc.noaa.gov).
| P1 | .8 - 4.0 | MeV protons (Counts/cm2 sec sr MeV) Uncorrected |
| P2 | 4.0 - 9.0 | MeV protons (Counts/cm2 sec sr MeV) Uncorrected |
| P5 | 40.0 - 80.0 | MeV protons (Counts/cm2 sec sr MeV) Uncorrected |
		Avg			Max		Time		Min		Time		Value at Interruption Started
--------------------------------------------------------------------------------------------------------------------------
p1	1.434e+02 +/- 8.051e+02		1.320e+04	295.500		3.670e+00	293.201		6.430e+02
p2	1.329e+00 +/- 2.360e+00		2.820e+01	294.698		2.580e-02	295.212		6.920e-01
p5	1.678e-02 +/- 1.221e-02		7.640e-02	295.944		3.150e-03	295.281		1.180e-02
Two vertical red lines indicate the start and the end of the interruption. Red horizontal lines indicate SCS 107 limits. Purple hatched areas indicate that the satellite is in the radiation belt.