| Science Run Stop: | 2001:09:24:14:29 |
| Science Run Start: | 2001:09:30:16:50 |
| Interruption: | 472.7ks |
| Triggered by: | auto |
Go to:
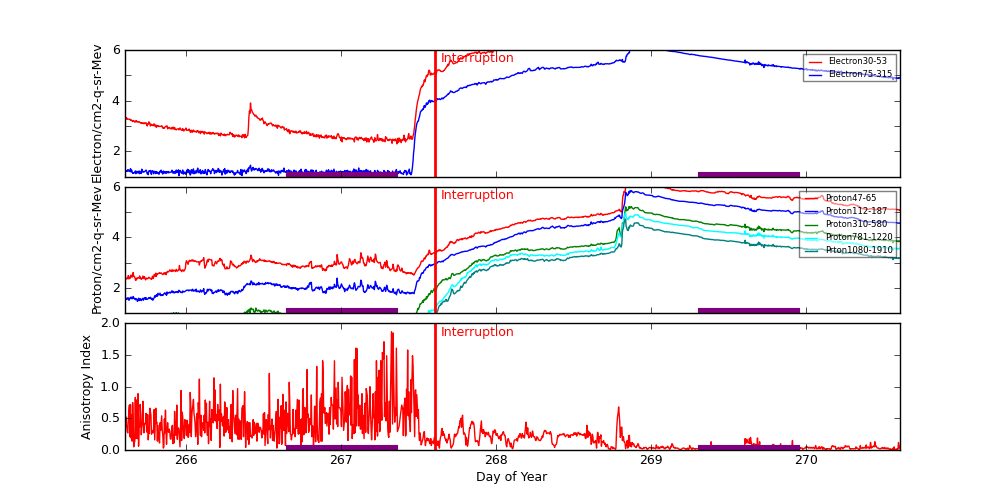
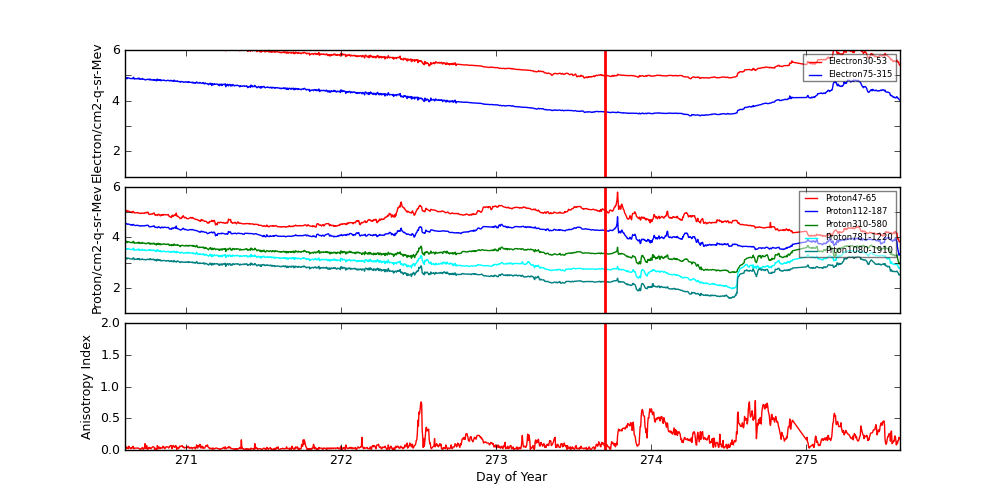
ACE Plot (E38/E175, P47/P112/P310/P761/P1060, Anisotopy)
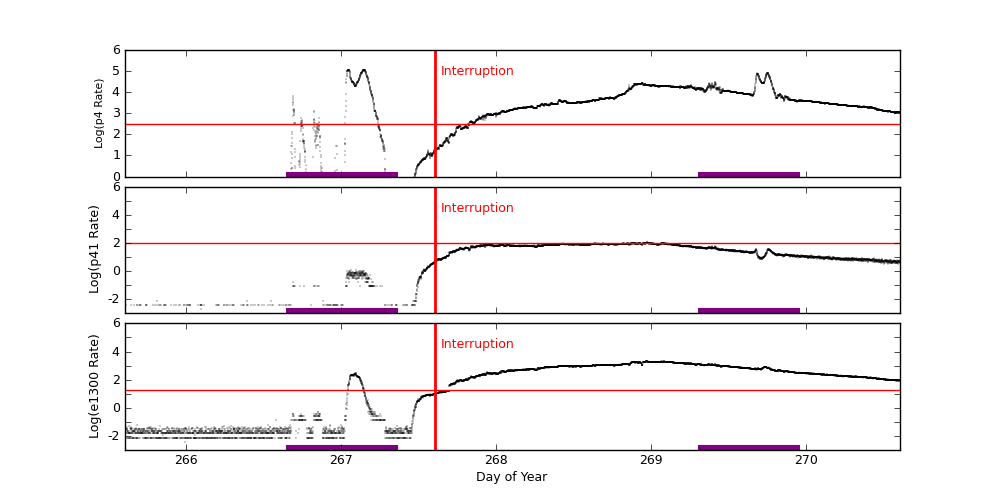
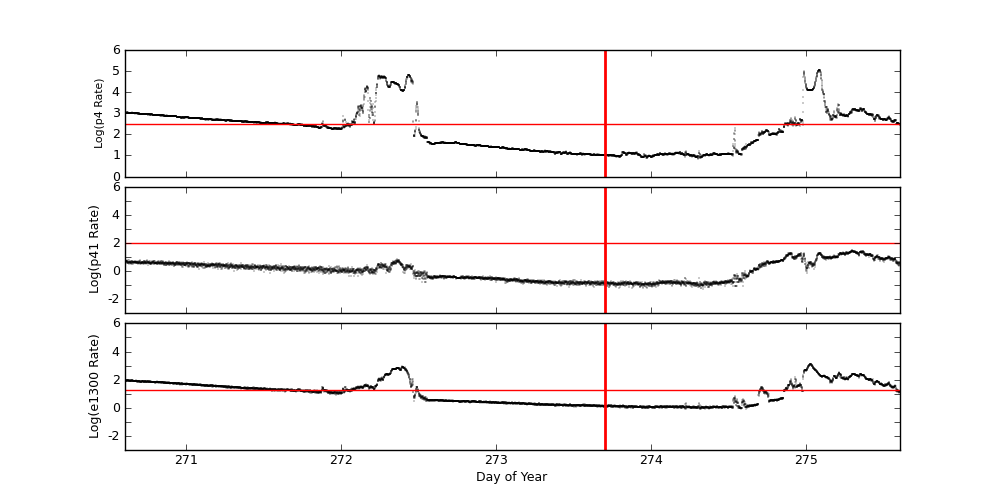
EPHIN Plot (P4/P41/E1300)
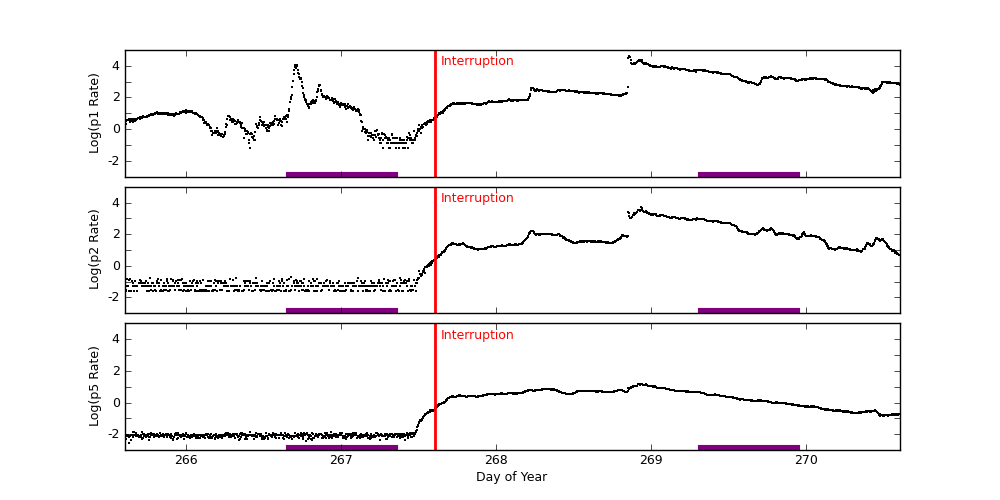
GOES-11 Plot (P1/P2/P5)
ACE radiation data are plotted around periods when science runs were interrupted. Plots start exactly 2 days before the interruption started. The top panel shows differential fluxes of electrons 38-53 and 175-315 (particles/cm2-s-ster-MeV), the middle panel shows differential fluxes of protons 47-65, 112-187, and 310-580 (particles/cm2-s-ster-MeV), and the bottom panel shows anisotropy ratio. The original data are prepared by the U.S. Dept. of Commerce, NOAA, Space Environment Center.
Data Period  (dom): 265.6035 - 275.6035
Interruption (dom): 267.6035 - 273.7014
			Avg		 Max		Time	Min		Time		Value at Interruption Started
--------------------------------------------------------------------------------------------------------------------------
e38 		1.601e+06+/-2.604e+06	1.140e+07	268.865 	1.950e+02	267.358		2.530e+05
e175		1.059e+05+/-2.284e+05	1.560e+06	268.906 	1.020e+01	267.264		1.060e+04
p47 		1.341e+05+/-2.500e+05	1.780e+06	268.917 	1.990e+02	265.674		6.670e+03
p112		4.239e+04+/-9.320e+04	6.990e+05	268.872 	2.950e+01	265.684		2.180e+03
p310		8.225e+03+/-1.963e+04	1.630e+05	268.872 	3.620e+00	267.392		9.550e+02
p761		4.286e+03+/-1.029e+04	9.240e+04	268.833 	4.040e-01	267.368		6.090e+02
p1060		2.005e+03+/-4.901e+03	5.270e+04	268.833 	9.430e-02	267.010		3.330e+02
anisotropy	2.029e-01+/-2.450e-01	2.000e+00	267.010 	1.000e-02	268.733		1.800e-01

Hardness:
e38/e175	2.729e+01+/-1.822e+01	2.858e+02	266.413 	3.672e+00	267.472		2.387e+01
p47/p1060	5.935e+02+/-1.092e+03	1.456e+04	267.219 	1.200e+01	275.417		2.003e+01
p112/p1060	8.139e+01+/-1.188e+02	1.292e+03	267.486 	4.715e+00	268.823		6.547e+00
p310/p1060	8.583e+00+/-7.401e+00	8.538e+01	267.486 	1.388e+00	268.823		2.868e+00
p761/p1060	2.474e+00+/-7.396e-01	8.653e+00	267.010 	1.031e+00	274.698		1.829e+00

Steepest Rise
------------
	Time		Slope(in log per hr)
----------------------------------------
e1  	268.8438		6720037.5946
e175	268.8472		1178406.5925
p47 	268.8194		1635609.1503
p112	268.8160		634203.5480
p310	268.8160		177600.9936
p761	268.8160		97320.5445
p1060	268.8160		57900.3239
Two vertical red lines indicate the start and the end of the interruption. Purple hatched areas indicate that the satellite is in the radiation belt.
EPHIN Data are used to trigger science run interruptions. The trigger levels are:
| P4 | 300 | Counts/cm2 sec sr MeV |
| P41 | 10 | Counts/cm2 sec sr MeV |
| E1300 | 20 | Counts/cm2 sec sr MeV |
		Avg			Max		Time		Min		Time		Value at Interruption Started
--------------------------------------------------------------------------------------------------------------------------
p4	4.748e+03 +/- 1.299e+04		1.169e+05	275.084		2.966e-03	265.479		2.166e+01
p41	1.463e+01 +/- 2.608e+01		1.101e+02	268.970		1.000e-04	265.340		4.930e+00
e1300	2.279e+02 +/- 4.217e+02		2.154e+03	268.972		1.000e-04	265.348		9.222e+00
Two vertical red lines indicate the start and the end of the interruption. Red horizontal lines indicate SCS 107 limits. Purple hatched areas indicate that the satellite is in the radiation belt.
GOES-11 data are taken from NOAA site (http://goes.ngdc.noaa.gov).
| P1 | .8 - 4.0 | MeV protons (Counts/cm2 sec sr MeV) Uncorrected |
| P2 | 4.0 - 9.0 | MeV protons (Counts/cm2 sec sr MeV) Uncorrected |
| P5 | 40.0 - 80.0 | MeV protons (Counts/cm2 sec sr MeV) Uncorrected |
		Avg			Max		Time		Min		Time		Value at Interruption Started
--------------------------------------------------------------------------------------------------------------------------
p1	9.766e+02 +/- 3.224e+03		9.310e+04	275.333		6.460e-02	266.413		5.680e+00
p2	1.383e+02 +/- 7.755e+02		3.270e+04	270.924		2.580e-02	265.611		2.350e+00
p5	1.420e+01 +/- 6.512e+02		3.270e+04	270.924		2.940e-03	265.628		4.270e-01
Two vertical red lines indicate the start and the end of the interruption. Red horizontal lines indicate SCS 107 limits. Purple hatched areas indicate that the satellite is in the radiation belt.