| Science Run Stop: | 2001:08:16:02:08 |
| Science Run Start: | 2001:08:17:00:30 |
| Interruption: | 80.0ks |
| Triggered by: | auto |
Go to:
ACE Plot (E38/E175, P47/P112/P310/P761/P1060, Anisotopy)
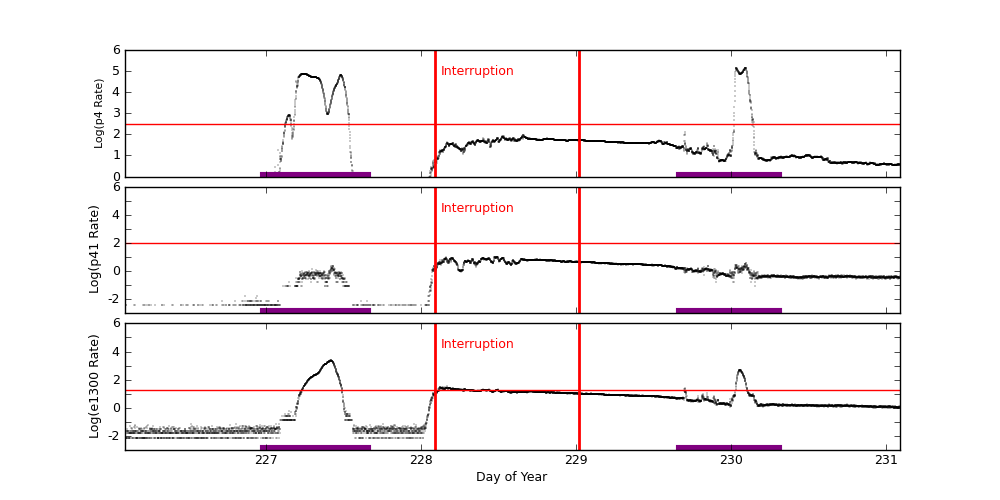
EPHIN Plot (P4/P41/E1300)
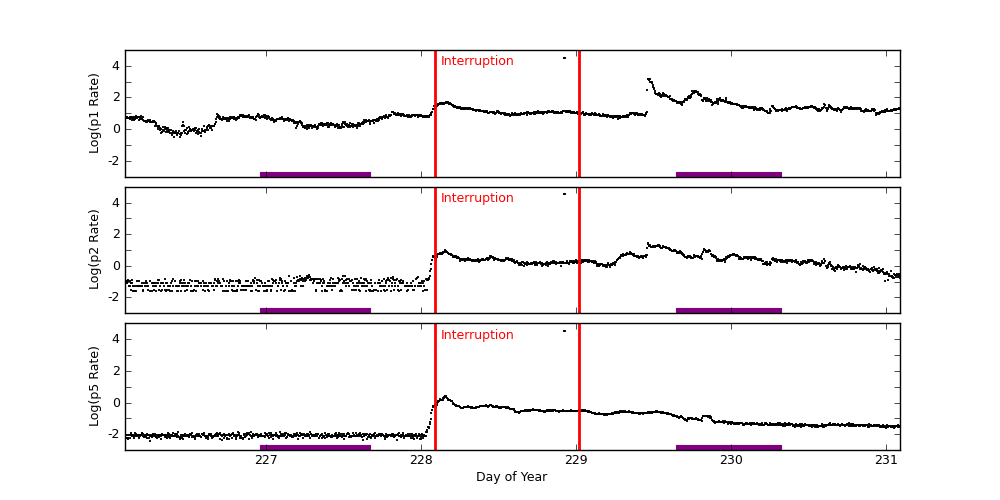
GOES-11 Plot (P1/P2/P5)
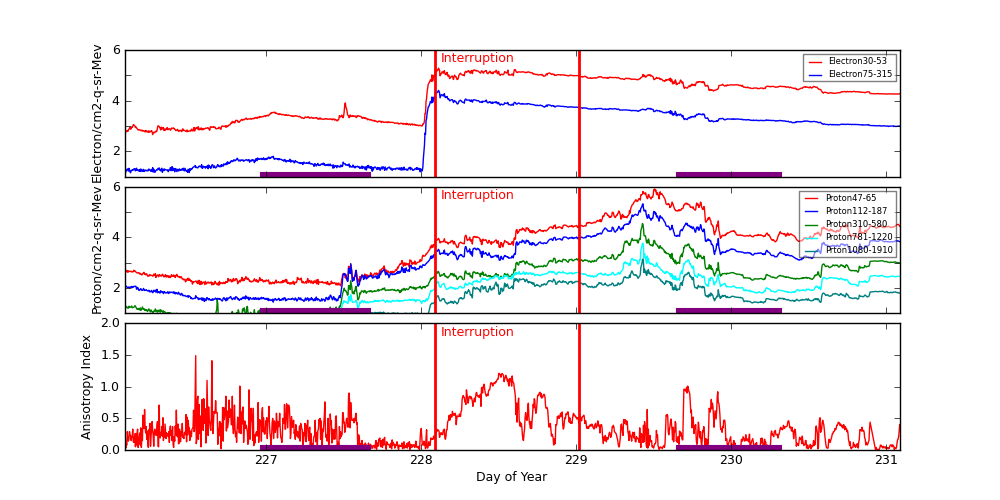
ACE radiation data are plotted around periods when science runs were interrupted. Plots start exactly 2 days before the interruption started. The top panel shows differential fluxes of electrons 38-53 and 175-315 (particles/cm2-s-ster-MeV), the middle panel shows differential fluxes of protons 47-65, 112-187, and 310-580 (particles/cm2-s-ster-MeV), and the bottom panel shows anisotropy ratio. The original data are prepared by the U.S. Dept. of Commerce, NOAA, Space Environment Center.
Data Period  (dom): 226.0889 - 231.0889
Interruption (dom): 228.0889 - 229.0208
			Avg		 Max		Time	Min		Time		Value at Interruption Started
--------------------------------------------------------------------------------------------------------------------------
e38 		4.222e+04+/-4.569e+04	1.920e+05	228.111 	4.550e+02	226.267		1.870e+04
e175		2.711e+03+/-3.579e+03	2.540e+04	228.111 	1.420e+01	226.125		9.920e+02
p47 		3.880e+04+/-9.816e+04	8.090e+05	229.507 	1.220e+02	227.479		2.740e+04
p112		7.887e+03+/-1.885e+04	2.110e+05	229.431 	2.770e+01	227.045		6.770e+03
p310		8.914e+02+/-2.248e+03	3.500e+04	229.427 	4.100e+00	226.639		9.730e+02
p761		2.059e+02+/-3.843e+02	5.800e+03	229.427 	8.640e-01	226.746		2.830e+02
p1060		7.075e+01+/-1.067e+02	1.410e+03	229.431 	2.430e-01	226.670		6.250e+01
anisotropy	3.447e-01+/-2.734e-01	1.490e+00	226.545 	1.000e-02	227.632		4.000e-01

Hardness:
e38/e175	3.242e+01+/-2.393e+01	2.544e+02	227.510 	5.809e+00	228.031		1.885e+01
p47/p1060	3.647e+02+/-4.062e+02	3.041e+03	229.507 	2.174e+01	227.510		4.384e+02
p112/p1060	7.848e+01+/-5.654e+01	3.965e+02	229.406 	5.607e+00	227.451		1.083e+02
p310/p1060	1.089e+01+/-6.068e+00	8.350e+01	226.684 	2.187e+00	228.483		1.557e+01
p761/p1060	2.938e+00+/-7.433e-01	5.826e+00	229.913 	1.396e+00	227.101		4.528e+00

Steepest Rise
------------
	Time		Slope(in log per hr)
----------------------------------------
e1  	228.0938		150838.6403
e175	228.0938		19247.8265
p47 	229.4896		499195.5002
p112	229.4132		164878.5138
p310	229.4097		32507.7070
p761	229.4132		5792.3478
p1060	229.4132		1385.9875
Two vertical red lines indicate the start and the end of the interruption. Purple hatched areas indicate that the satellite is in the radiation belt.
EPHIN Data are used to trigger science run interruptions. The trigger levels are:
| P4 | 300 | Counts/cm2 sec sr MeV |
| P41 | 10 | Counts/cm2 sec sr MeV |
| E1300 | 20 | Counts/cm2 sec sr MeV |
		Avg			Max		Time		Min		Time		Value at Interruption Started
--------------------------------------------------------------------------------------------------------------------------
p4	4.159e+03 +/- 1.687e+04		1.394e+05	230.092		2.966e-03	226.102		6.299e+00
p41	1.603e+00 +/- 2.170e+00		1.026e+01	228.472		1.000e-04	226.089		1.015e+00
e1300	4.108e+01 +/- 2.165e+02		2.350e+03	227.415		1.000e-04	226.090		1.620e+01
Two vertical red lines indicate the start and the end of the interruption. Red horizontal lines indicate SCS 107 limits. Purple hatched areas indicate that the satellite is in the radiation belt.
GOES-11 data are taken from NOAA site (http://goes.ngdc.noaa.gov).
| P1 | .8 - 4.0 | MeV protons (Counts/cm2 sec sr MeV) Uncorrected |
| P2 | 4.0 - 9.0 | MeV protons (Counts/cm2 sec sr MeV) Uncorrected |
| P5 | 40.0 - 80.0 | MeV protons (Counts/cm2 sec sr MeV) Uncorrected |
		Avg			Max		Time		Min		Time		Value at Interruption Started
--------------------------------------------------------------------------------------------------------------------------
p1	7.373e+01 +/- 1.221e+03		3.270e+04	228.924		3.330e-01	226.406		2.290e+01
p2	4.924e+01 +/- 1.241e+03		3.270e+04	228.924		2.580e-02	226.142		3.270e+00
p5	4.557e+01 +/- 1.218e+03		3.270e+04	228.924		3.780e-03	226.247		5.640e-01
Two vertical red lines indicate the start and the end of the interruption. Red horizontal lines indicate SCS 107 limits. Purple hatched areas indicate that the satellite is in the radiation belt.