In this example we use CCD6 Node 0 of Mn peak Data.
   Start Time		    CTI         OBSID        End Time         Int Time	 Temperature
			(S/I)*10**4                                     sec        C
-------------------------------------------------------------- -------------------------------
2004-10-16T15:57:07     1.621+-0.014    60002   2004-10-16T22:07:54     3056    -119.54
2004-10-18T19:22:02     1.594+-0.023    60001   2004-10-19T01:11:27     877     -119.54
2004-10-18T19:22:02     1.611+-0.017    60001   2004-10-19T01:11:27     2043    -119.22
2004-10-18T19:22:02     1.624+-0.020    60001   2004-10-19T01:11:27     1691    -119.38
2004-10-18T19:22:02     1.642+-0.015    60001   2004-10-19T01:11:27     2560    -119.06
2004-10-19T06:53:21     1.617+-0.011    59999   2004-10-19T12:39:26     7669    -119.70
2004-10-21T23:10:52     1.596+-0.027    59995   2004-10-22T05:19:38     949     -119.38
2004-10-21T23:10:52     1.600+-0.012    59995   2004-10-22T05:19:38     3306    -119.70
2004-10-21T23:10:52     1.614+-0.012    59995   2004-10-22T05:19:38     3954    -119.54
2004-10-24T03:47:48     1.566+-0.019    59994   2004-10-24T07:34:28     1986    -119.70
2004-10-24T03:47:48     1.645+-0.012    59994   2004-10-24T07:34:28     5660    -119.54
2004-10-24T13:43:16     1.626+-0.009    59992   2004-10-24T20:17:41     8259    -119.70
2004-10-26T17:44:44     1.599+-0.009    59991   2004-10-26T23:35:23     7785    -119.70
2004-10-27T05:14:39     1.609+-0.009    59989   2004-10-27T11:19:03     8257    -119.70
2004-10-29T10:45:10     1.623+-0.010    59987   2004-10-29T15:02:26     7769    -119.70
 			-------------------------------
As you can see there are multiple entries for some obsids (60001 and 59995). This is because the focal plane temperature changed during the observation, and we computed CTI for each temperature for the observations. Note that the starting time and the end time are for the full observation, and not the period of that temperature. "Int Time" indicates duration of the data at that temperature. We drop data less than 1000 sec integration time to keep the error small.
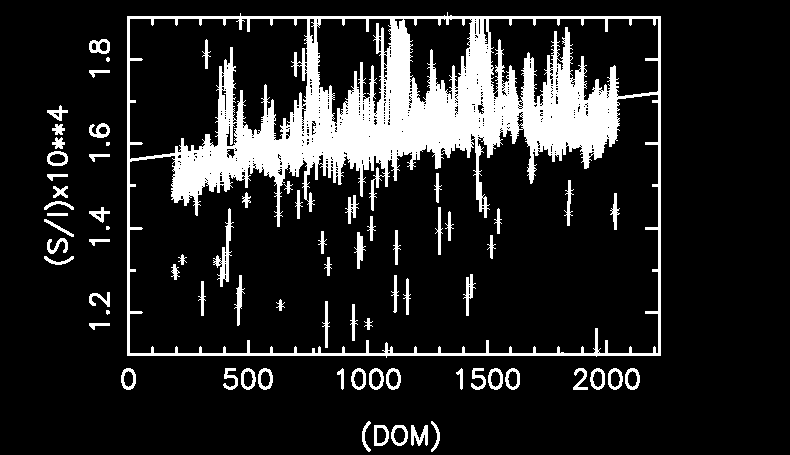
Here is the plot of the data before any temperature corrections.

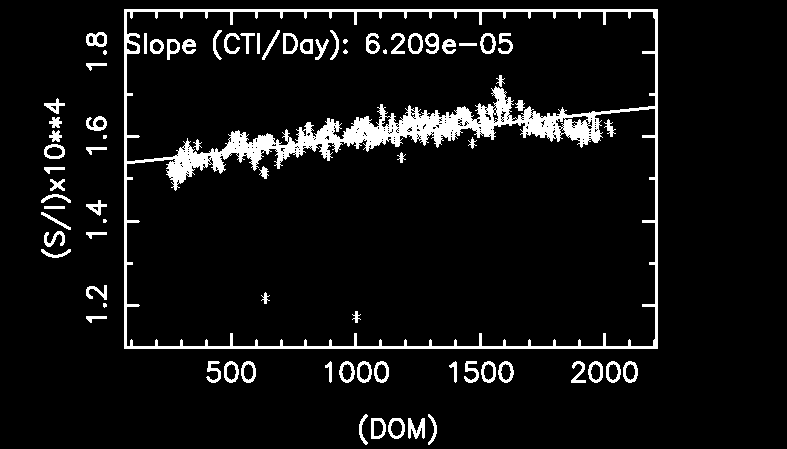
Since we are correcting the data to CTIs observed at the focal plane temperature -119.7 C, we first estimate how CTI evolves with time using CTIs at -119.7 C and the integration time longer than 7,000 sec.

We fit a linear line to estimate the time evolution.
CTI = 1.533 + 6.209 * 10 ** -5 * DOM
where DOM is day of mission.
Subtract this fit from the original data, we can remove the time dependent evolution.

Next, we plot this data against the temperature.

Again, we fit a linear line on to this data to estimate an additive correction factor of
CTI (del CTI).
del (CTI) = 0.04630 * (T + 119.7)
where T is the focal plane temperature in C. Since we assume that there is no correction at the focal plane temperature at -119.7 C, we subtract -119.7 from the focal plane temperature when fits the line.
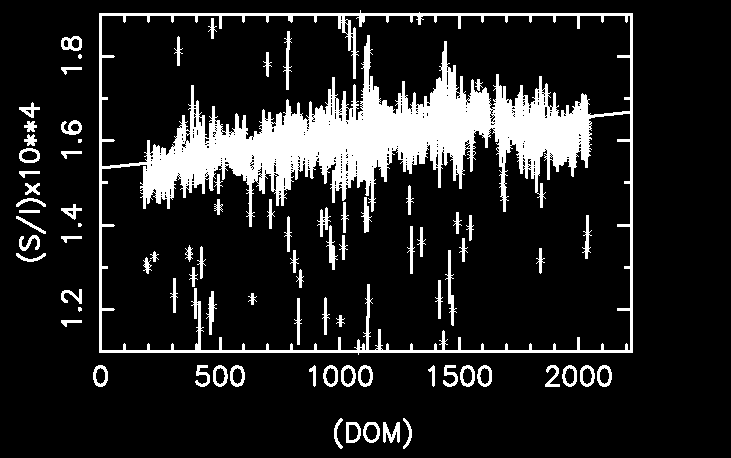
After correcting CTIs with this factor, the final plot is:
