| Science Run Stop: | 2024:06:08:02:29 |
| Science Run Start: | 2024:06:11:04:09 |
| Interruption: | 216.1ks |
| Triggered by: | auto |
Go to:
ACE Plot (E38/E175, P47/P112/P310/P761/P1060)
HRC Plot (HRC Shield Rate)
ACIS Plot (ACIS Count Rate)
GOES-R Plot (P1/P2/P5/HRC Prox)
XMM Plot (LE and HES)
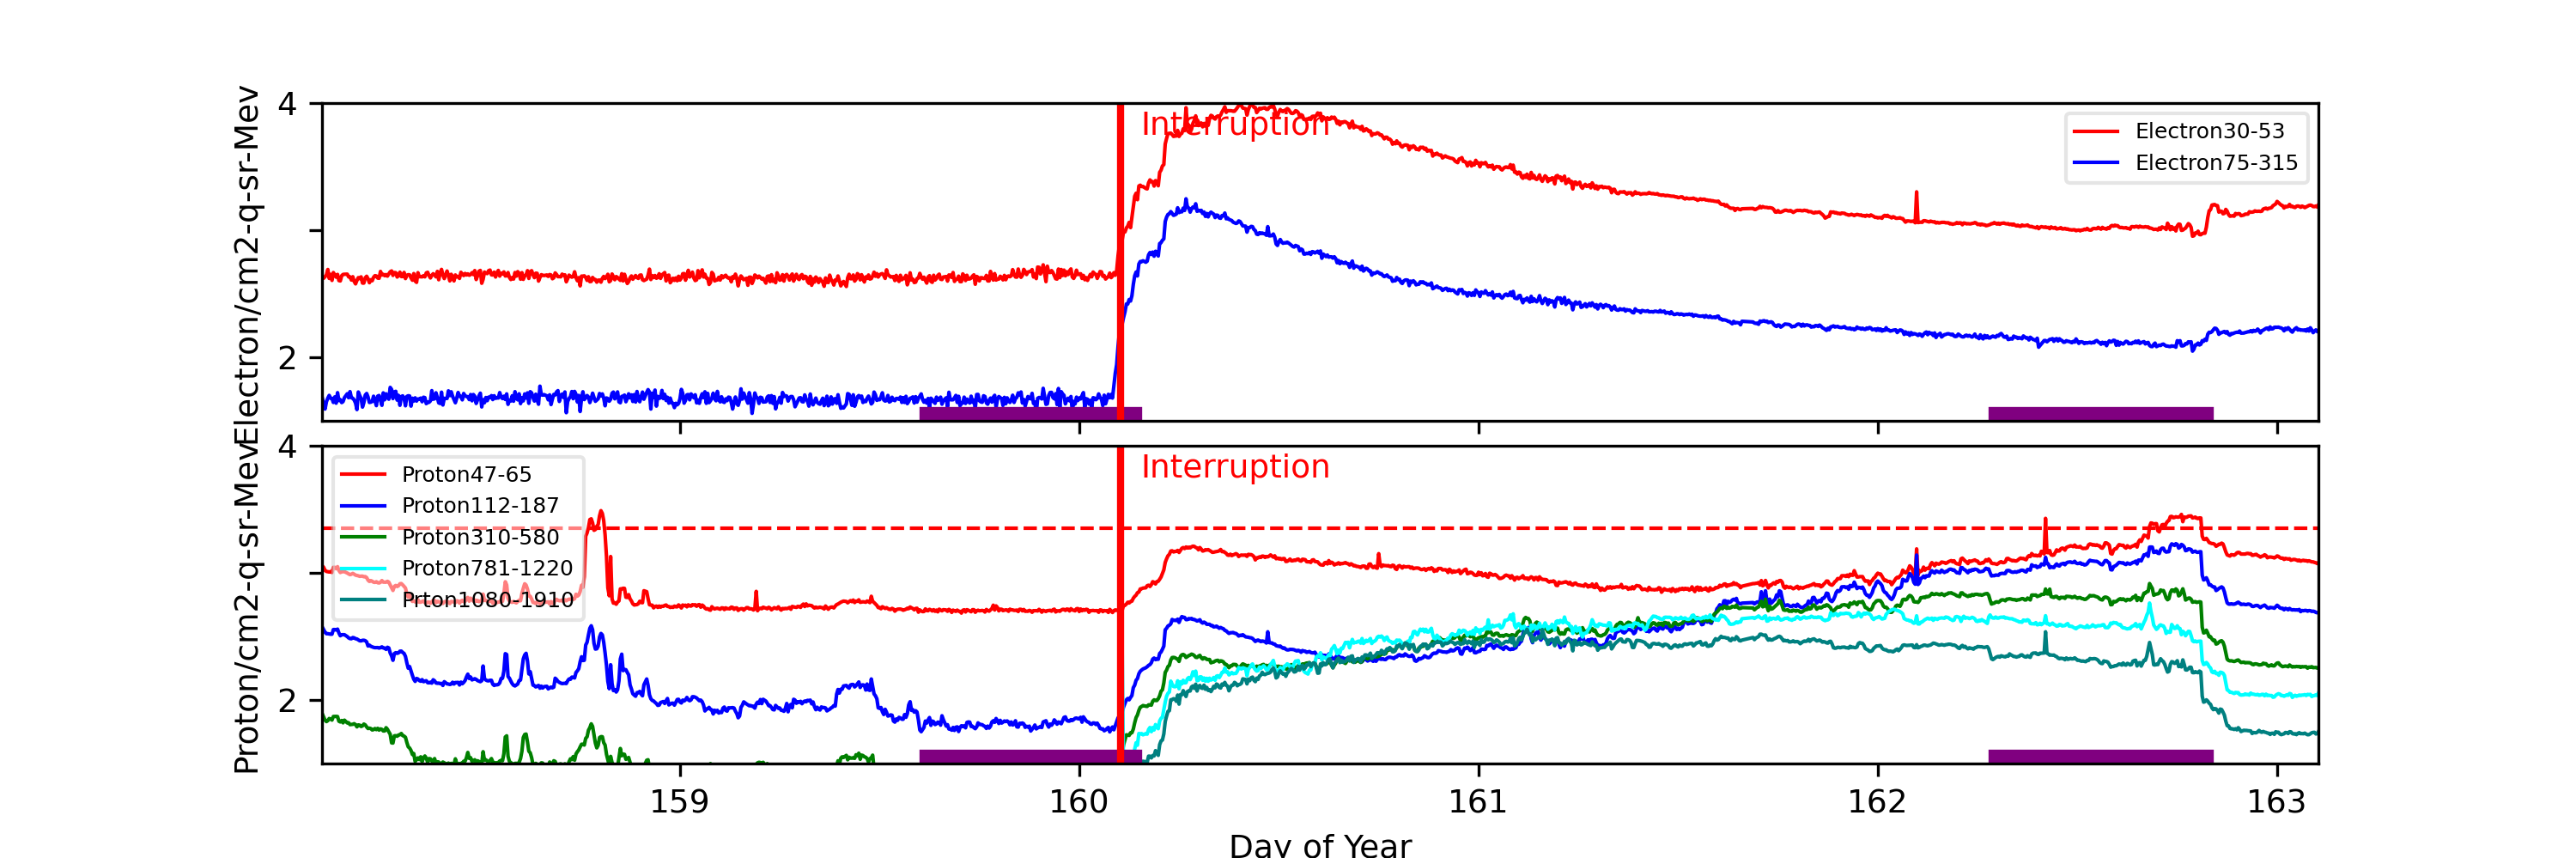
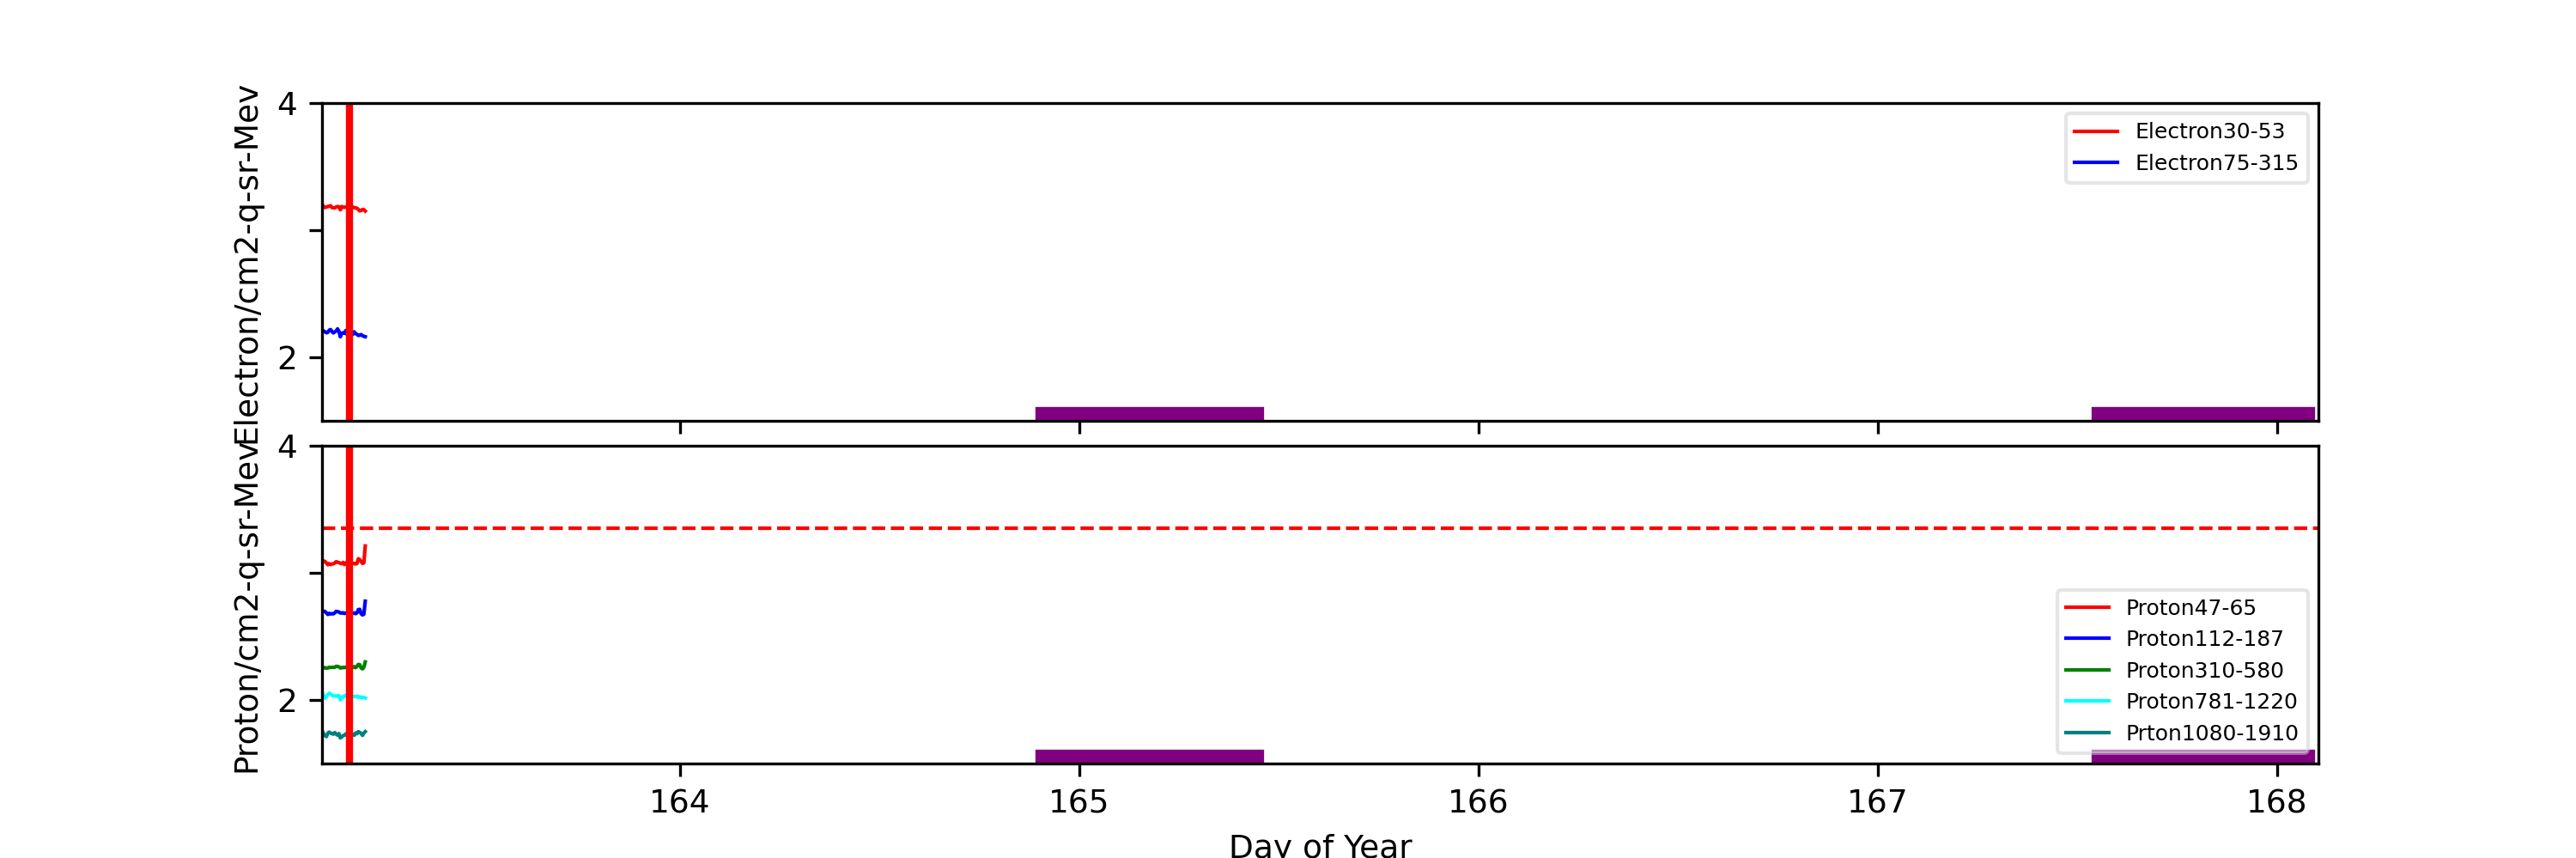
ACE radiation data are plotted around periods when science runs were interrupted. Plots start exactly 2 days before the interruption started. The top panel shows differential fluxes of electrons 38-53 and 175-315 (particles/cm2-s-ster-MeV), the middle panel shows differential fluxes of protons 47-65, 112-187, and 310-580 (particles/cm2-s-ster-MeV).
Data Period  (doy): 158.1035 - 168.1035
Interruption (doy): 160.1035 - 163.1729

			Avg			 Max		Time		Min		Time		Value at Interruption Started
-----------------------------------------------------------------------------------------------
e38	 		8.769e+04+/-1.112e+07	9.700e+05	160.431 	1.290e+03	159.417 	6.400e+03
e175	 		1.372e+03+/-2.127e+05	3.100e+04	160.267 	1.290e+01	159.892 	3.290e+02
p47	 		1.192e+04+/-9.432e+05	9.590e+04	158.802 	2.340e+03	159.705 	2.760e+03
p112	 		3.113e+03+/-3.231e+05	2.900e+04	162.746 	3.160e+01	160.076 	6.120e+01
p310	 		1.176e+03+/-1.020e+05	6.840e+03	162.681 	3.250e+00	159.608 	1.110e+01
p761	 		7.216e+02+/-5.707e+04	3.370e+03	162.681 	7.110e-01	160.028 	4.150e+00
p1060	 		3.109e+02+/-2.434e+04	1.310e+03	161.121 	1.060e-01	159.073 	8.660e-01
e38/e175 		1.793e+25+/-3.552e+28	2.511e+28	162.406 	1.000e+00	158.163 	1.945e+01
p47/p1060 		4.197e+03+/-6.498e+05	1.609e+05	158.799 	1.000e+00	158.163 	3.187e+03
p112/p1060 		1.418e+02+/-1.434e+04	2.705e+03	158.774 	6.110e-01	160.861 	7.067e+01
p310/p1060 		1.123e+01+/-7.850e+02	7.395e+01	158.774 	8.048e-01	160.684 	1.282e+01
p761/p1060 		3.590e+00+/-4.906e+02	3.173e+02	160.108 	7.179e-01	160.573 	4.792e+00

Steepest Rise
------------
	Time		Slope(in log per hr)
----------------------------------------
e38 	160.4201		2221714.3365
e175 	160.2153		31378.8520
p47 	158.7639		145556.6455
p112 	162.6701		58634.9350
p310 	162.6701		15666.5217
p761 	162.6701		7718.7395
p1060 	161.6910		2288.1367
Two vertical red lines indicate the start and the end of the interruption. Purple hatched areas indicate that the satellite is in the radiation belt. The horizontal dashed line indicates P3 trigger level. If P3 level is higher than this level more than 2 hours, SCS 107 may be manually triggered.
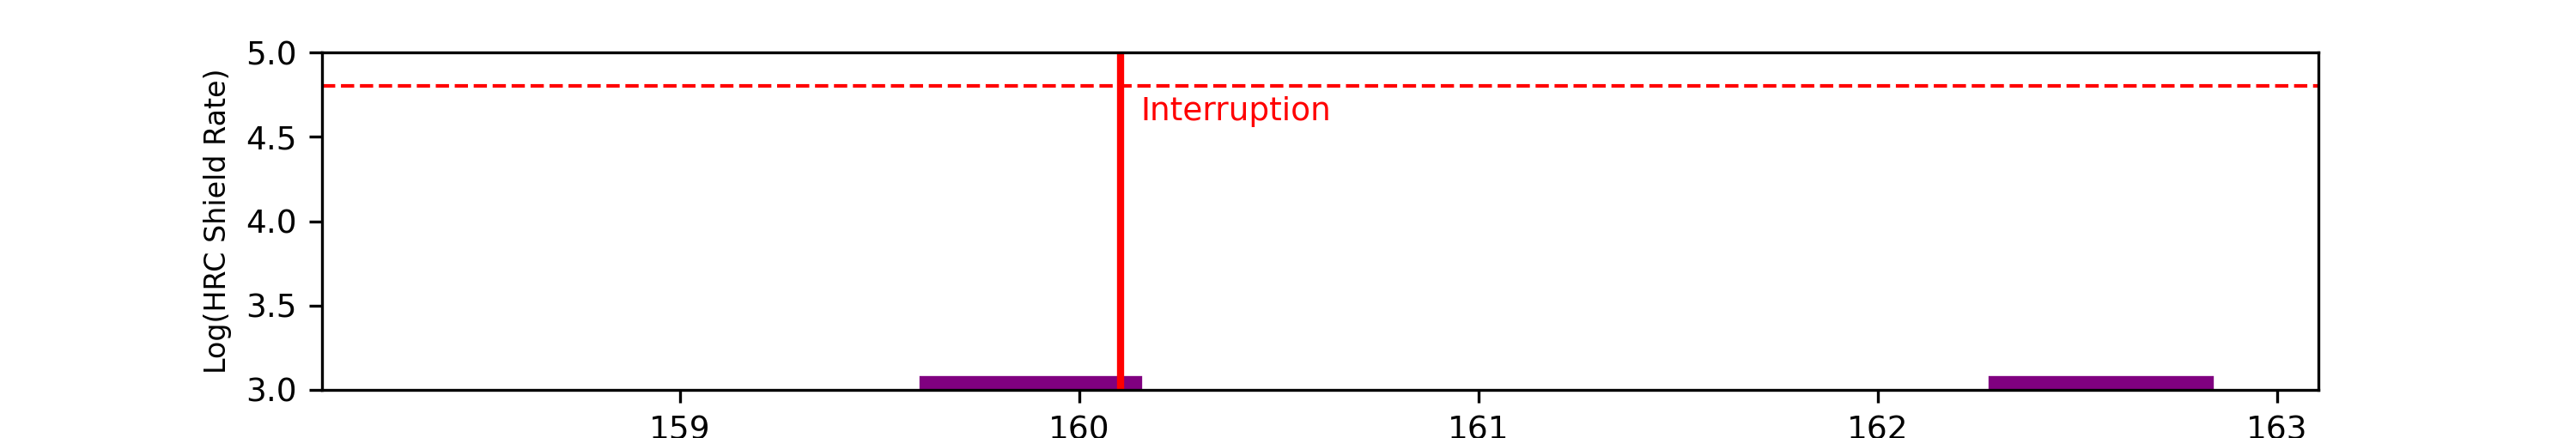
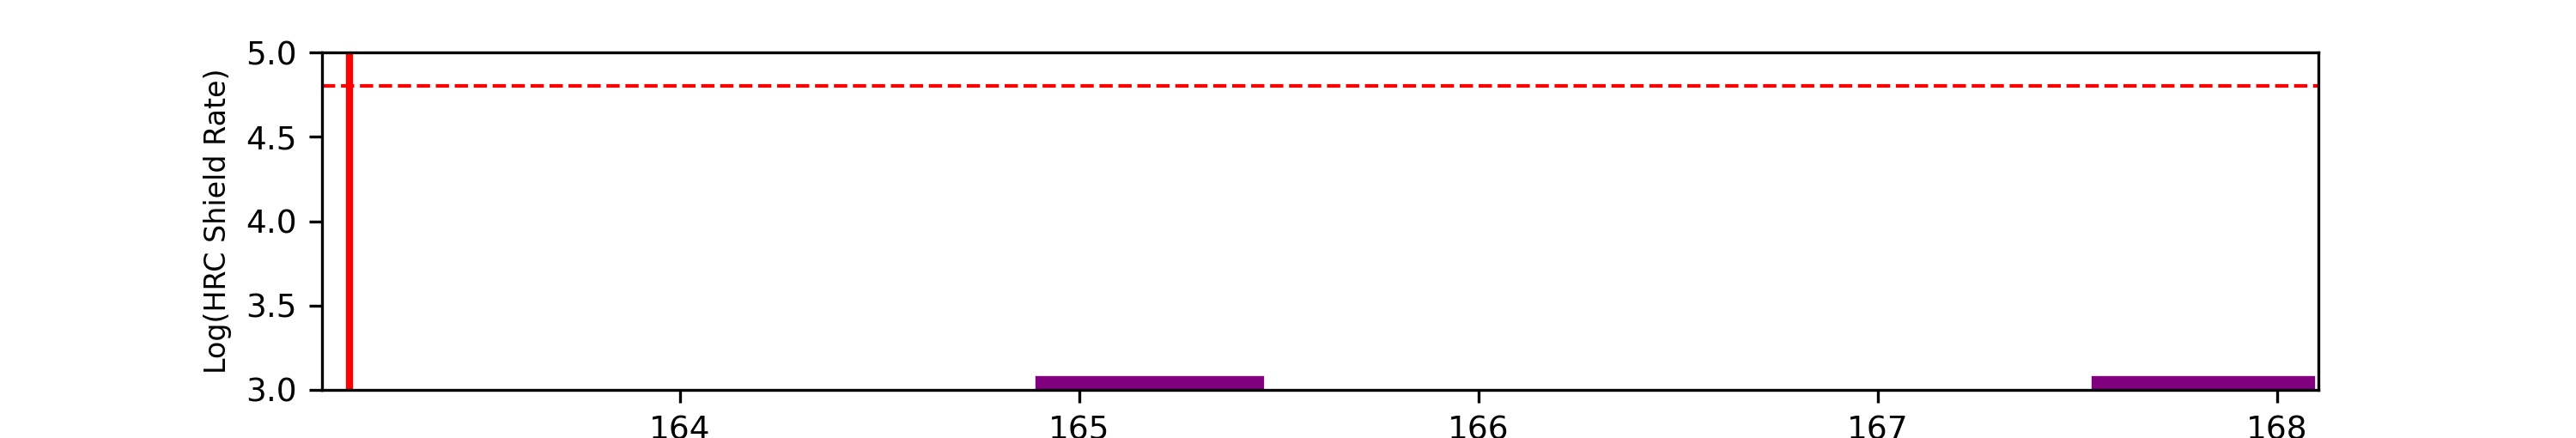
		Avg			Max		Time		Min		Time		Value at Interruption Started
-----------------------------------------------------------------------------------------------
hrc 		0.000e+00+/-0.000e+00	0.000e+00	0.000 	1.000e+10	0.000 	0.000e+00
Two vertical red lines indicate the start and the end of the interruption. Purple hatched areas indicate that the satellite is in the radiation belt. The red horizontal dashedline indicates SCS 107 limits. If the HRC shield rate/256 goes above 248, automatic SCS 107 is triggered.
The follwoing plots are copied from ACIS Threshold Corssings Page. For more details, please refer to Using ACIS to detect and report high radiation conditions
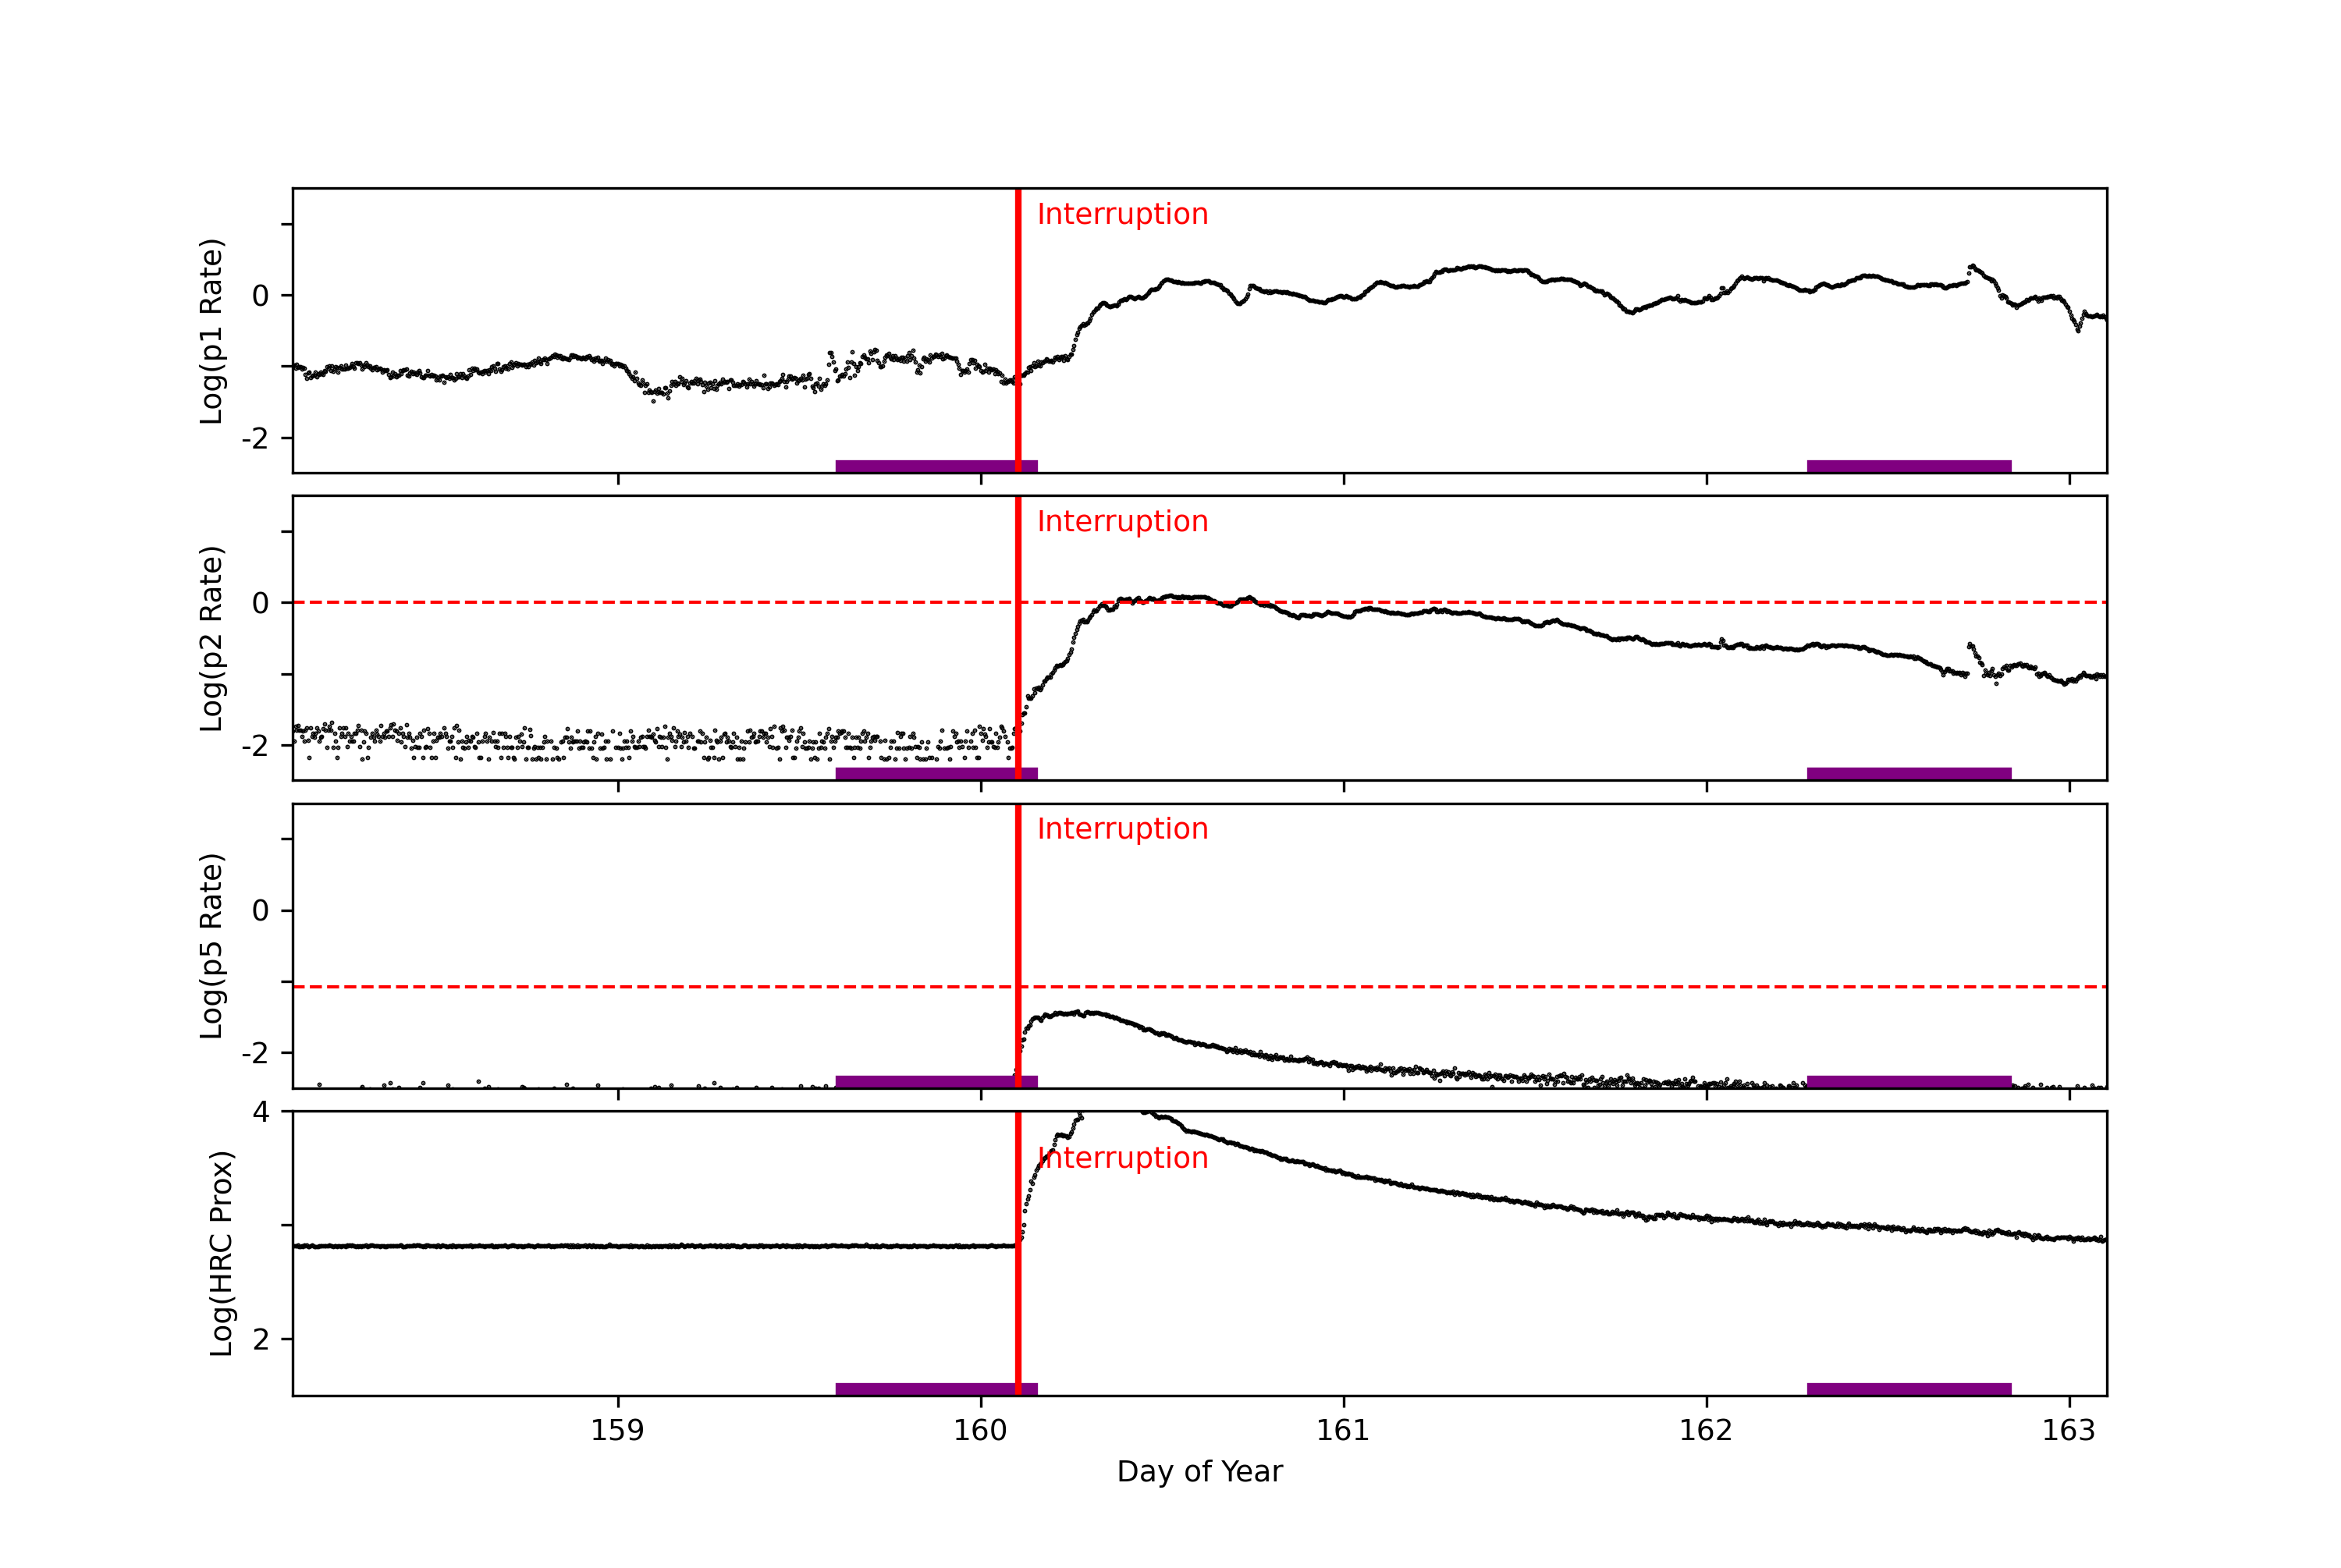
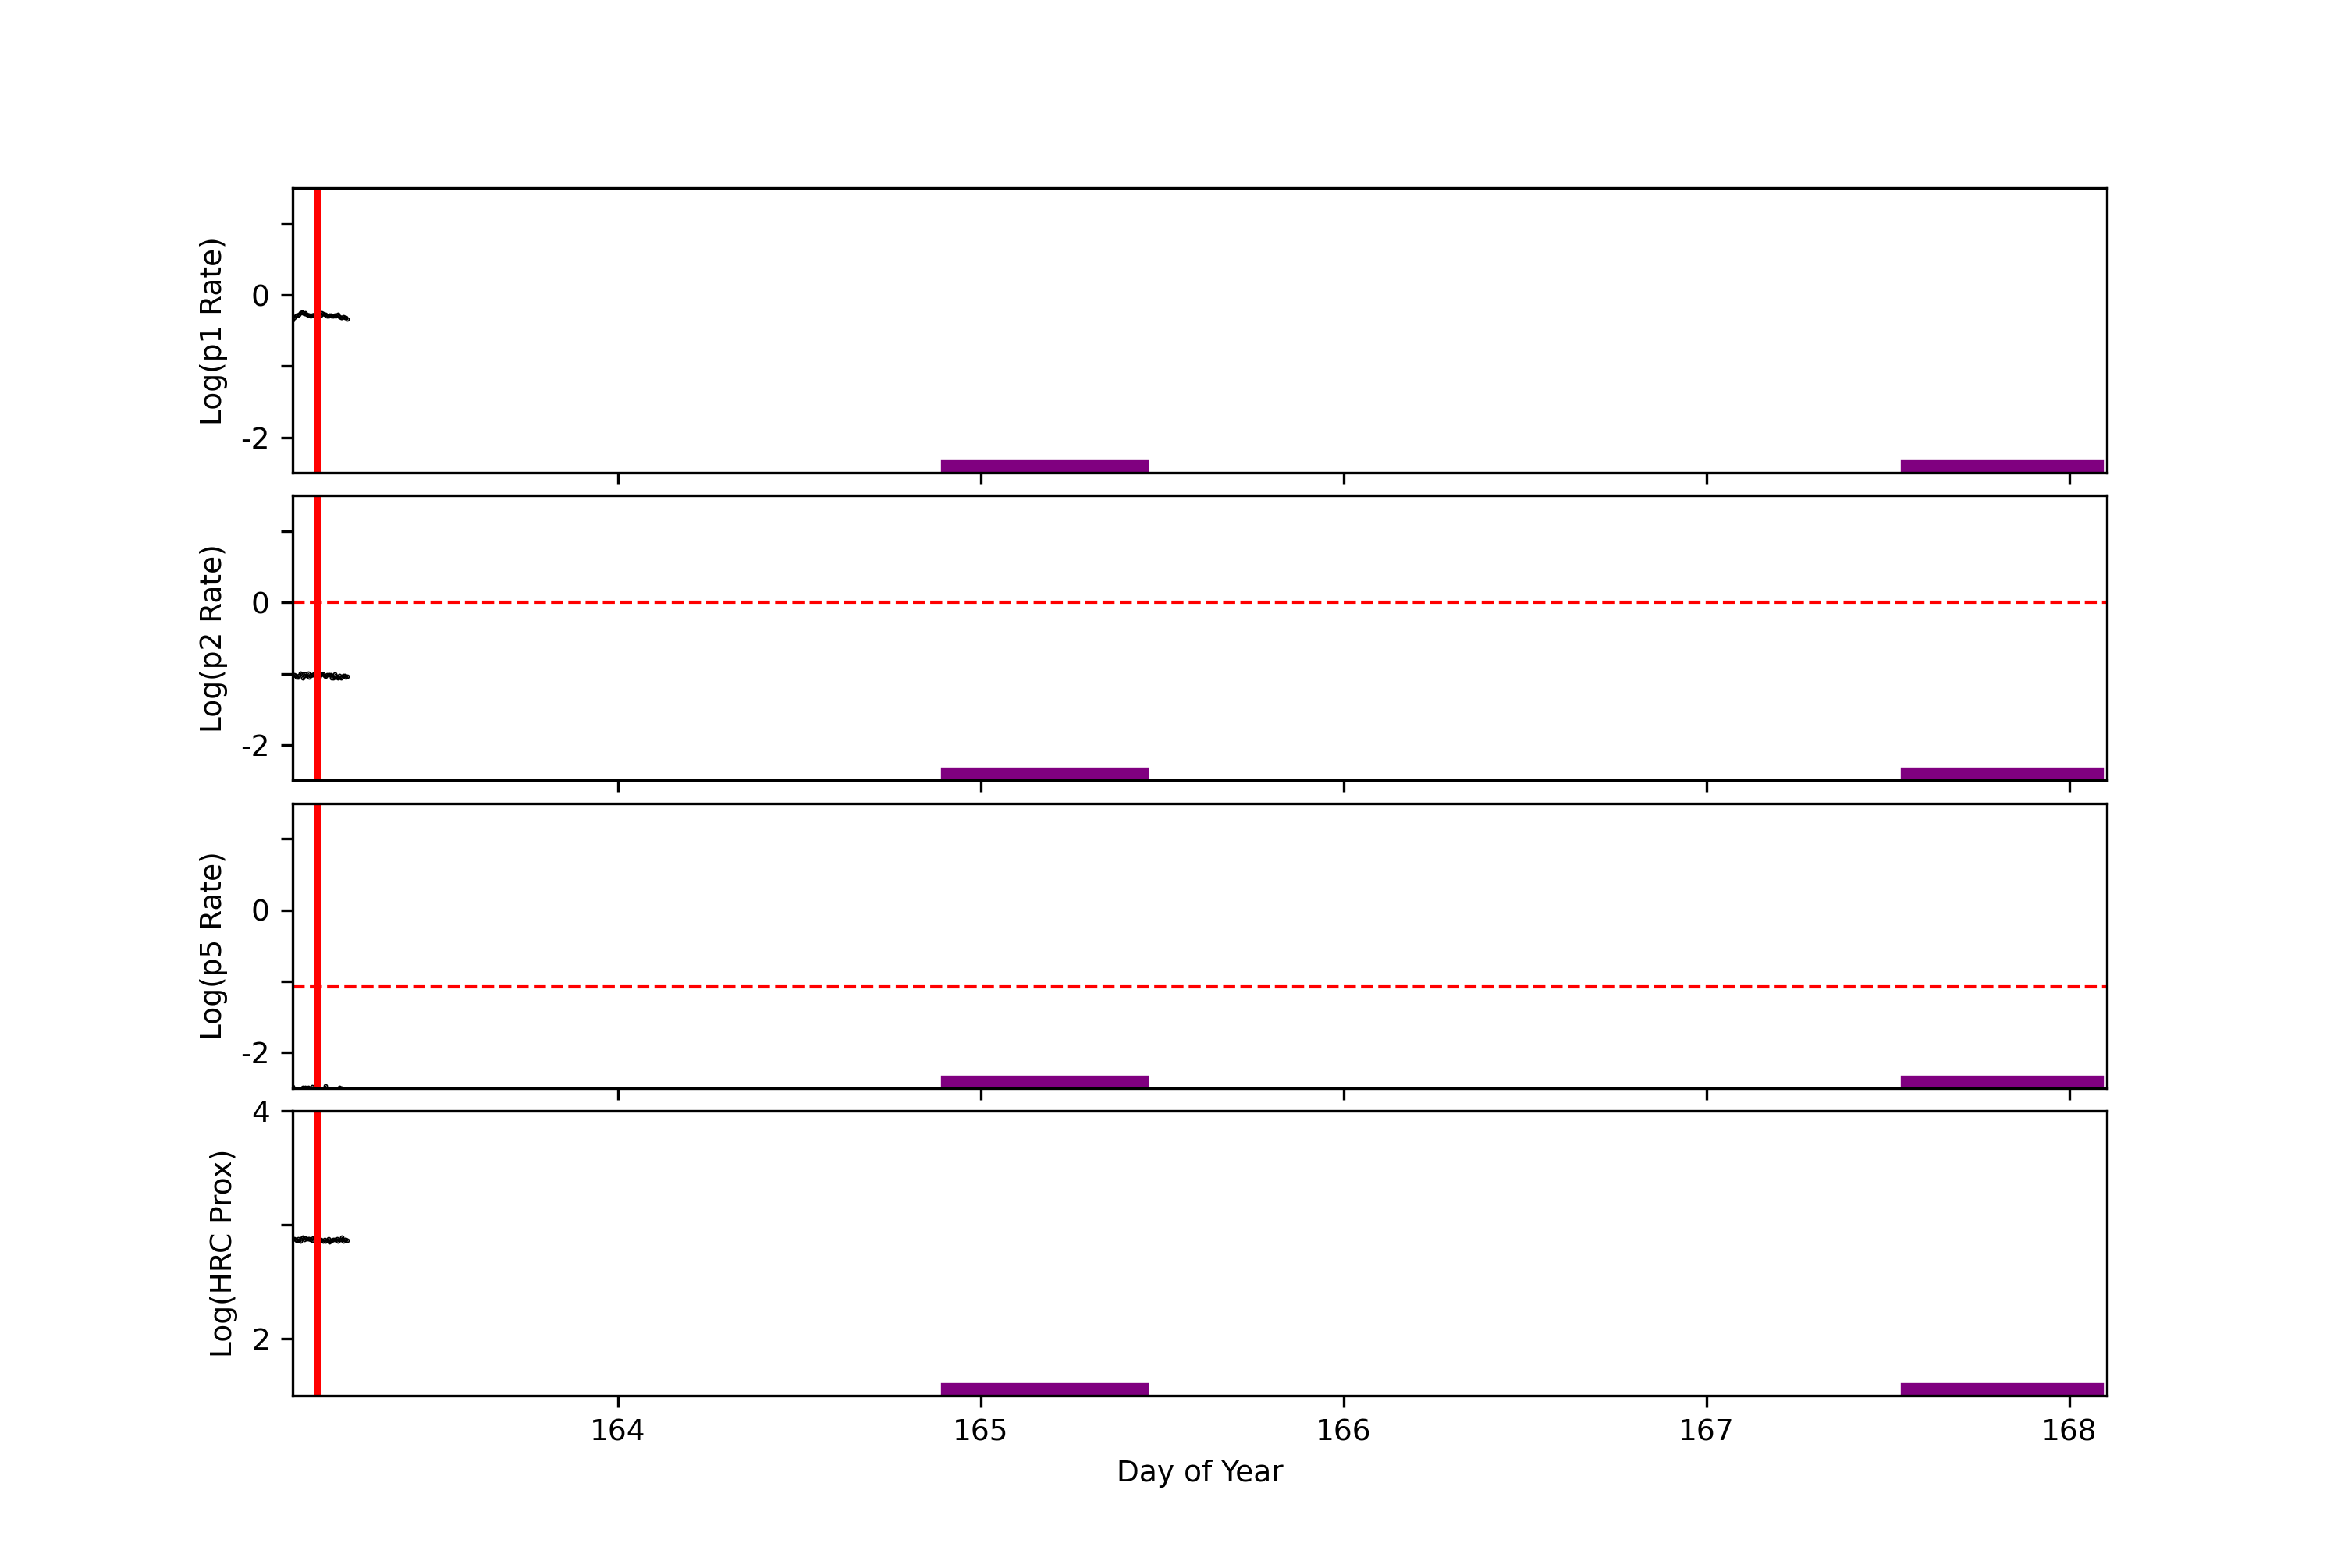
GOES-R data are taken from NOAA site (https://services.swpc.noaa.gov/json/goes/primary/integral-protons-1-day.json).
| P1 | 1.0 - 3.0 MeV protons (Counts/cm2 sec sr MeV) Uncorrected |
| P2 | 3.4 - 11.0 MeV protons (Counts/cm2 sec sr MeV) Uncorrected |
| P5 | 40.0 - 98.0 MeV protons (Counts/cm2 sec sr MeV) Uncorrected |
| HRC Prox | 6000 * (11.64-38.1MeV) + 270000 * (40.3-73.4MeV) 100000 * (83.7-242.0MeV) |
			avg			max		Time		min		Time		Value at Interruption Started
-----------------------------------------------------------------------------------------------
p1		1.066e+02 +/- 1.429e+02		6.693e+02	162.733		1.045e-01	159.097		2.598e-01
p2		2.060e+01 +/- 3.617e+01		1.597e+02	160.524		3.988e-03	159.344		3.394e-02
p5		8.991e-03 +/- 2.571e-02		1.427e-01	160.267		4.195e-05	158.184		8.848e-03
hrc prox	1.066e+02 +/- 1.429e+02		6.693e+02	162.733		1.045e-01	159.097		4.939e+03
Two vertical red lines indicate the start and the end of the interruption. Purple hatched areas indicate that the satellite is in the radiation belt. The red horizontal dashed lines indicate SCS 107 limits. If GOES P2 or P5 levels go above these levels, SCS 107 may be manually triggered.
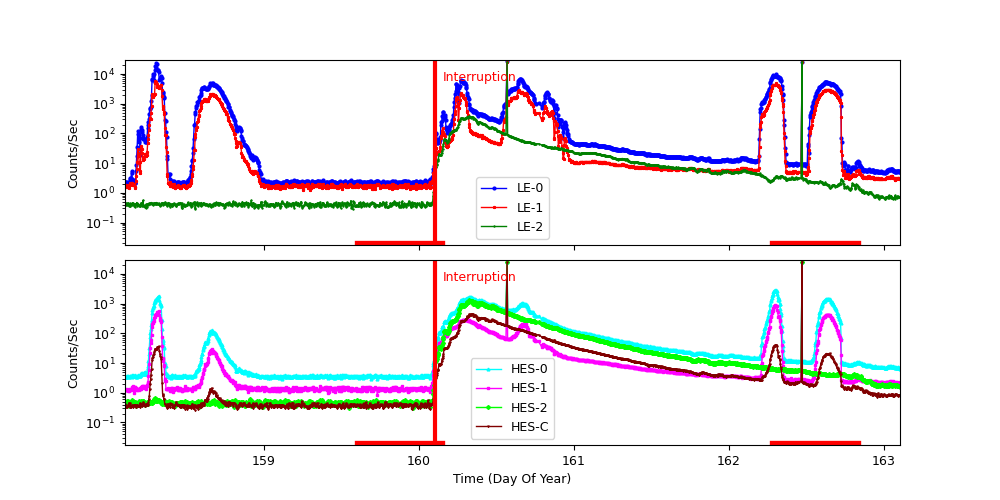
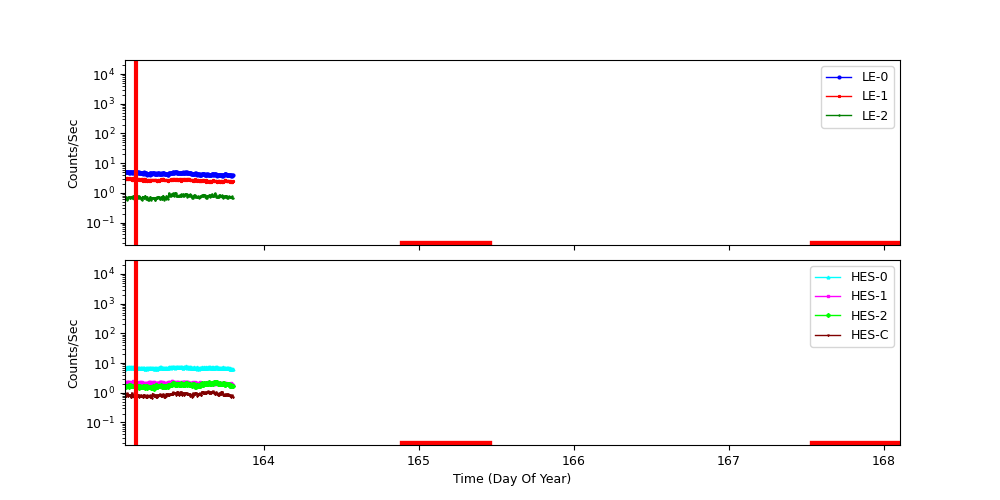
	Avg			 Max			Time		Min			Time		Value at Interruption Started
-----------------------------------------------------------------------------------------------
LE-0:  7.698e+02 +/- 2.095e+03	2.710e+04	    160.568		1.740e+00	    159.252	      3.023e+01
LE-1:  3.331e+02 +/- 1.136e+03	2.609e+04	    162.472		1.281e+00	    159.252	      1.496e+01
LE-2:  4.642e+01 +/- 8.185e+02	2.609e+04	    162.472		2.830e-01	    159.571	      4.780e+00
HES-0: 2.065e+02 +/- 9.132e+02	2.609e+04	    162.472		2.833e+00	    159.693	      2.985e+01
HES-1: 6.425e+01 +/- 8.215e+02	2.609e+04	    162.472		8.540e-01	    159.732	      1.451e+01
HES-2: 1.021e+02 +/- 8.475e+02	2.609e+04	    162.472		3.000e-01	    159.964	      6.401e+00
HES-C: 5.355e+01 +/- 8.209e+02	2.609e+04	    162.472		2.720e-01	    158.552	      1.809e+00
Two vertical red lines indicate the start and the end of the interruption. Red hatched areas indicate that the satellite is in the radiation belt.