 (PS)
(PS)
 (PS)
(PS)
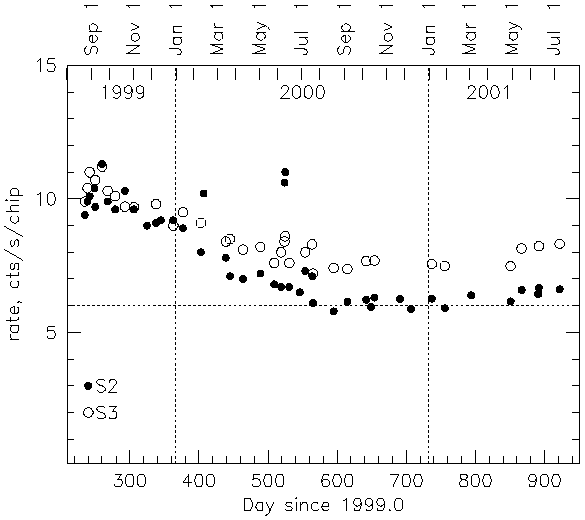
Observations with and without HETG have similar rates, so no distinction is made in the plot. The figure shows that quiescent rates in S2 and S3 have been steadily decreasing from about 10-11 cts/s/chip in August-September 1999 to about 6-8 cts/s/chip at present. The decrease seems to have bottomed out in the Fall of 2000.
Note that if one uses 6 chips and Very Faint mode, the rate 10-11 cts/s/chip is close to saturating the telemetry (leaving almost no room for the target flux or background flares), but if the rate stays where it is now, the probability of saturation in the VF mode during the quiescent times is small.
--------------------------------------------
OBSID 	date	    day	   S2	S3     HETG
			  (cts/s/chip)
--------------------------------------------
1090	1999-08-23  235	   9.4	 9.9	-
162	1999-08-27  239	   9.9	10.4	-
578	1999-08-30  242	  10.1	11.0	-
50	1999-09-06  249	  10.4	 0	-
1249	1999-09-06  250	   9.7	10.7	-
1252	1999-09-17  260	  11.3	11.2	+
1318	1999-09-25  268	   9.9  10.3	+
124	1999-10-06  279	   9.6  10.1	-
337	1999-10-20  293	  10.3	 9.7	+
1458	1999-11-02  306	   9.6	 9.6	-
966	1999-11-21  325	   9.0	 0	-
125	1999-12-04  338	   9.1	 9.8	-
550	1999-12-11  345	   9.2	 0	-
839	1999-12-29  363	   9.2	 9.0	-
605	2000-01-12  012	   8.9   9.5	+
766	2000-02-07  038	   8.0	 9.1	-
602	2000-02-11  042	  10.2	 0	-
420	2000-03-14  074	   7.8	 8.4	-
387	2000-03-20  080	   7.1	 8.5	-
610	2000-04-08  099	   7.0	 8.1	+
1708	2000-05-03  124	   7.2	 8.2	-
1719	2000-05-23  144	   6.8	 7.6	+
363	2000-06-02  154	   6.7	 8.0	-
937	2000-06-07  159	  10.6	 8.4	-
505	2000-06-08  160	  11.0	 8.6	-
670	2000-06-14  166	   6.7	 7.6	-
535	2000-06-29  181	   6.5	 0	-
399	2000-07-07  189	   7.3	 8.0	-
241	2000-07-17  199	   7.1   8.3	+
5	2000-07-18  200	   6.1	 7.2	+
943a	2000-08-17  230	   5.8	 7.4	-
431	2000-09-06  250    6.1   7.4	-
2319	2000-10-15  289	   6.3	 7.7	-
1671    2000-11-21  326	   6.3	 0	-
2252    2001-01-06  006	   6.3	 7.6	-
2266    2001-01-25  025    5.9   7.5	-
2421    2001-03-04  063    6.4   0   	-
1699    2001-04-30  120    6.4   7.5 	-
1697    2001-05-16  136    6.6   8.1	-
2237    2001-06-09  160    6.4   0   	-
2238    2001-06-09  160    6.5   0   	-
2241    2001-06-10  161    6.7   8.2 	-
1694    2001-07-10  191    6.6   8.3 	-
--------------------------------------------
Deviations from the trend: a high S2 rate in February 2000 (obsid 602) is during a flare seen in S3 but not in S2 (where the rate of the good events is unusually high by a big factor, but constant, so it doesn't look like a usual background flare). High rate points in June 2000 (obsids 937, 505) correspond to observations without any visible flares, in their usual sense, in either the FI or BI chips -- in obsid 937, the clean event rate in S2 (and other FI chips) is rather constant but too high by a factor of 2, whereas the S3 rate is normal. In obsid 505, there is a bright cluster in the FOV whose contribution is hard to separate.