
|
| Figure 1 HRC antico shield rate (top) and EPHIN Integral (middle) and P41 (bottom) channel fluxes as a function of time from 2001-Dec-24 to 2002-Jan-05. This time period covers the HRC observation before the 2001-Dec-26 RADMON shut-down and includes the HRC observations following the recovery. |
Previous work had shown a correlation between the HRC antico shield rate and the EPHIN Integral channel flux during "quiescent" periods:

|
| Figure 2 HRC antico shield rate for the same period as in figure 1. The EPHIN Integral channel flux, scaled by the "quiescent" relationship is over-plotted in red. The over-plotted blue points are the scaled EPHIN Integral channel flux plus the EPHIN P41 channel flux multiplied by 7.0E4. |
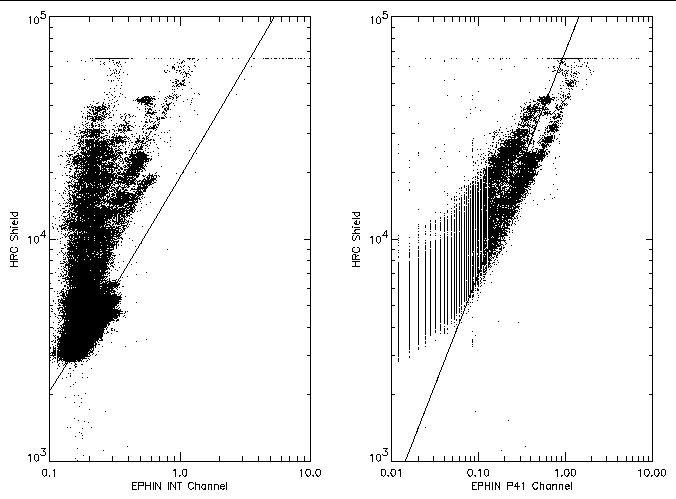
This single example is somewhat encouraging for the possibility of being able to use the HRC antico shield to substitute for EPHIN (with reduced capability) in the RADMON process. A more complete comparison of the HRC antico shield rate and EPHIN P41 channel flux is required. Figure 3 shows samples of the HRC antico shield rate that are coincident with the EPHIN flux samples from the start of the mission through the end of 2002. Only times when the HRC antico shield HV is at the operating level (i.e. not during radiation events) are plotted. Scatter plots are shown for the EPHIN Integral and P41 channels. The "quiescent" scaling relation between the HRC antico shield rate and EPHIN Integral channel flux is over-plotted on its scatter plot. The departures from the quiescent relation follow many different tracks, suggesting different particle spectra for various departures. The rough scaling used to add the EPHIN P41 channel flux on in figure 2 is over-plotted in the HRC antico shield rate to EPHIN P41 channel flux scatter plot. In this plot we also see at least two different tracks. It should be noted that our current EPHIN P41 channel flux safing threshold is at 8.47 cts s-1 cm-2 sr-1 and the tracks intersect the maximum HRC antico shield rate of 65535 cts s-1 before they reach this threshold.

|
| Figure 3 HRC antico shield rate versus EPHIN Integral (left) and P41 (right) channel fluxes. The "quiescent" relationship between the antico shield and Integral flux is plotted in the left panel. A ratio of 7×10⁴ is plotted in the right panel. |
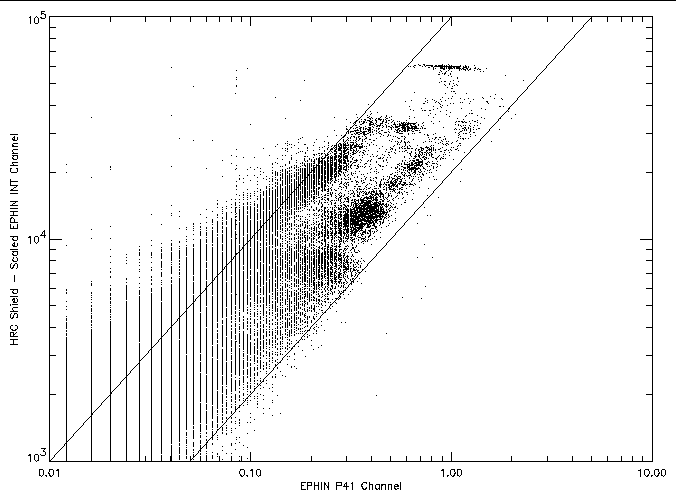
A better view of a correlation between the HRC antico shield rate and the EPHIN P41 channel flux during times of high particle activity can be obtained by subtracting the quiescently scaled EPHIN Integral channel flux from the HRC antico rate and plotting versus the EPHIN P41 channel flux; this is shown in figure 4. The various tracks appear to follow constant ratios between the "excess" shield rate and P41 flux but the range on the constant spans a factor of five.

|
| Figure 4 HRC antico shield rate minus the scaled "quiescent" EPHIN Integral channel flux versus the EPHIN P41 channel flux. Straight lines are at ratios of 2×10⁴ and 1×10⁵. |
If we were to adopt a HRC antico shield rate trigger threshold of 6×10⁴ cts s-1 there would have been seven RADMON trips since the start of the mission. The date are given in the following table along with links to plots of the HRC antico shield rate and EPHIN P4, P41, and E1300 channel fluxes versus time.
| Date | Comment | |
|---|---|---|
| 1999-10-13 | Fringe of rad zone Prior to increased rad zone padding? | plot |
| 1999-11-11 | Fringe of rad zone Prior to increased rad zone padding? | plot |
| 2000-06-10 | "Hard" event - Integral Channel response No RADMON trigger | plot |
| 2001-08-16 | RADMON trip - E1300 | plot |
| 2001-12-26 | RADMON trip - P41, E1300 | plot |
| 2002-07-15 | X3 flare spike RADMON trip day and a half later - P4 | plot |
| 2002-11-09 | RADMON trip - P4 | plot |
Last modified: Tue Jan 28 10:28:45 EST 2003
Dr. Michael Juda
Harvard-Smithsonian Center for Astrophysics
60 Garden Street, Mail Stop 70
Cambridge, MA 02138, USA
Ph.: (617) 495-7062
Fax: (617) 495-7356
E-mail: mjuda@cfa.harvard.edu