"Pile-up" Effect on the HRC PSF
Summary
There is an additional HRC-instrumental blur for high-rate
sources, a "pile-up" effect. Events that are affected can be
flagged and filtered out based on their proximity in time and
position to a previous event.
Introduction
Two HRC-I observations of AR Lac (ObsIDs 1385 and 13182) have been
used to study the system PSF. The source flux varied during both
of these observations and it was noted that the PSF was broader
during the intervals of higher flux. In addition, observations
of Capella, which produces a higher count rate than AR Lac,
exhibited a broader PSF than AR Lac.
During ground calibration at the XRCF a set of data was taken to probe
the linearity of the HRC count rate with flux. One analysis that
was performed with the data was to compare the linearity of the
core of the PSF with a surrounding annulus (see section 3.3 of
"Count Rate Linearity of the AXAF High Resolution Camera (HRC)")
and observed that the core deviated at lower rate than the annulus.
These measurements suggest that the increasing width of the PSF at
higher count rates is due to a suppression of the peak in the core
of the nominal PSF.
The cascade down the channels of the MCP from an event extracts
~107 electrons from a very localized region. The glass
in the plates has a high resistivity and the current flow
required to replenish the charge lost to the event will take a
finite time. Thus it is expected that the channels will not
produce the nominal response of a second event comes too soon
after the first. This is an effect of event pile-up.
Analysis
We can gauge the time-scale that it takes to replenish the local
charge using the AR Lac and Capella observations, looking for
changes in the size of the PSF as the time between successive
events is decreased. For each observation we select the events
from the nominal filtered event-list that lie within a 20-pixel
radius centered on the iteratively-clipped centroid of the
point-source events. Then, using all of the level-1 events in this
same region, we determine the time from the previous event
(the delta-time).
The events can be grouped based on their delta-times, setting
delta-time bin boundaries such that each of the bins contain
roughly equal events. For each of the groups the radius which
encircles ~85% of the events can be determined. The figure below
shows this radius as a function of the upper-limit on the
delta-time bin for the two AR Lac observations and a Capella
observation at the nominal HRC-I aim-point (ObsID 8360).
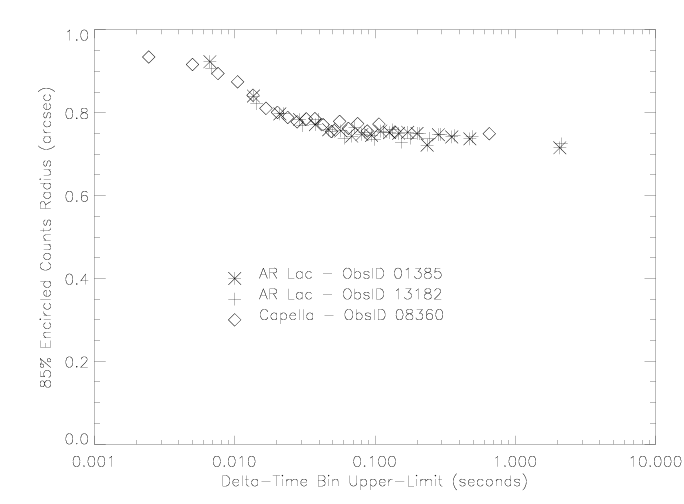
The data points in all three observations overlap and show the same
trend in increasing radius as the time between events
decreases. Roughly speaking, a second event in the local region
arriving within 0.05s of a previous event will have been
impacted by the prior event.
Flagging Impacted Events
We can use this information to flag events and reject them from
subsequent analysis if the best PSF is desired.
For each level-1 event in a time-ordered event list, check each
following event that occurs less than a delta-time limit away and
if it lies within an event-separation limit flag that following
event as "impacted" by pile-up.
I have drafted a simple python script that runs as a stand-alone tool
within a CIAO environment that performs this flagging, using one
of the "spare" bits in the
status word (bit 3).
The script (and associated parameter file) can be obtained here:
deltatime_flag.py
deltatime_flag.par
In this parameter file the upper-limit to the affected times is 0.05s
and the separation radius is 20.0. The flagged events can be
removed using a modified version of the status word bit-mask:
status=xx0xxx00xxxx0xxx00000000x0000000
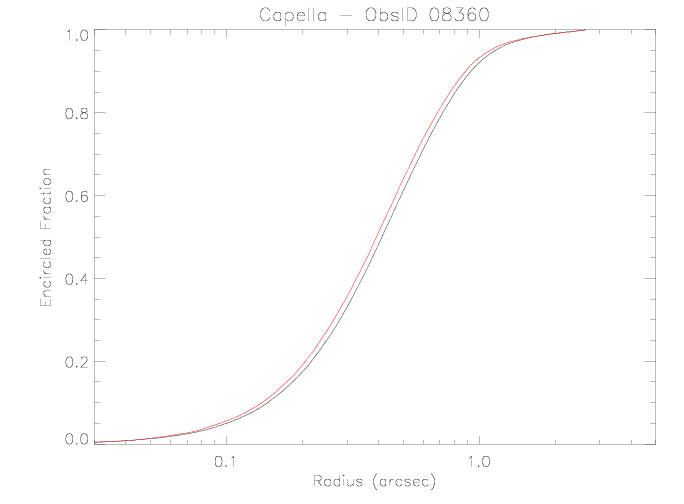
The figure below shows a comparison of the encircled count fraction
as a function of radius for the Capella observation ObsID 8360
with (red curve) and without (black curve) the added "pile-up"
filter described here.
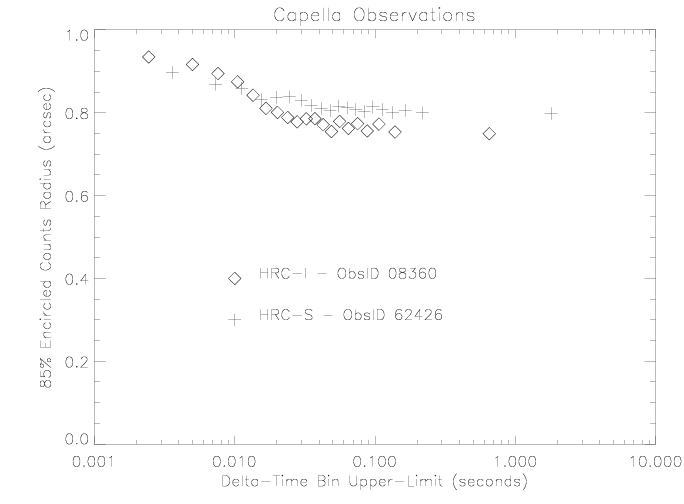
HRC-I - HRC-S Comparison
The XRCF tests showed the the HRC-S rate started its drop-off relative
to source flux at higher flux levels that the HRC-I. This could
result in the choice of different filter parameters for the
HRC-S. The figure below shows a comparison of the 85% encircled
counts radius as a function of the delta-time bins between HRC-I
and HRC-S observations of Capella. For the HRC-S the radius grows
at a slower rate with delta-time decrease than in the
HRC-I. However, the onset of the increase occurs at roughly the
same delta-time. It is reasonable to use same filter parameters
with both detectors.
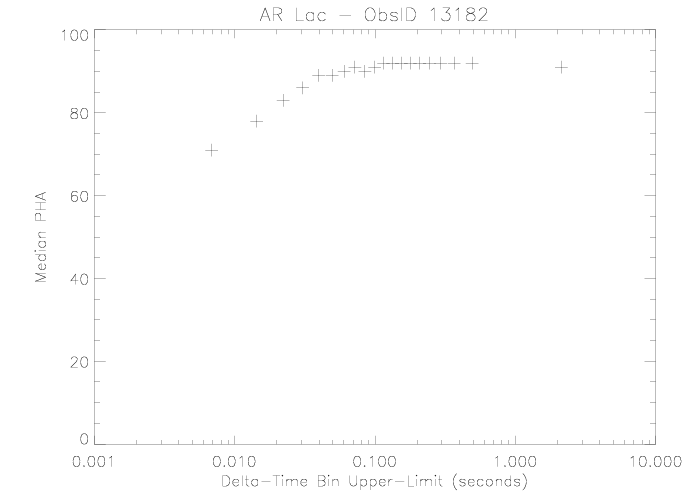
"Pile-up" effect on PHA
The lack of charge replenishment can be expected to have an impact on
the amount of charge that will be generated in an event and as a
consequence the resulting event PHA. This effect can be seen in
the plot below which shows the PHA distributions for the bins with
the longest and shorted delta-times between events.
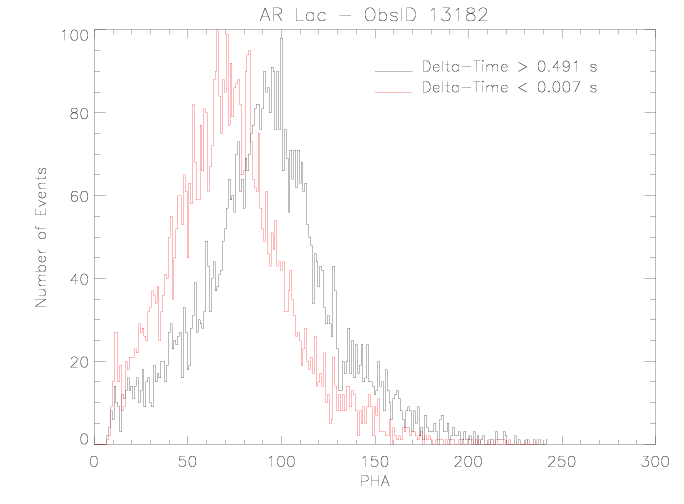
As with the radius of encircled counts, there is a trend in the PHA
distribution to lower PHA as the delta-time decreases as shown
below. The pronounced drop-off in PHA begins at delta-times
below ~0.05 seconds.
Last modified: Wed Oct 24 11:11:21 EDT 2012
Dr. Michael Juda
Harvard-Smithsonian Center for Astrophysics
60 Garden Street, Mail Stop 70
Cambridge, MA 02138, USA
Ph.: (617) 495-7062
Fax: (617) 495-7356
E-mail: mjuda@cfa.harvard.edu