Monitoring EPHIN Degradation
One of the earliest indicators of a degradation of the EPHIN detectors
is a decrease in the resolution of the detectors. To track this
requires analysis of the PHA buffer data, which stores the
pulse-height information from individual coincidence events. The
PHA buffer contains a sequence of variable length records, where
each record stores information on the coincidence type
(e.g. E150), direction of travel via which detector A and B
segments are triggered, pulse-heights of the detectors that
triggered, and high/low gain selection on the pulse-heights. These
data, when combined with supplied calibrations (Mueller-Mellin
2000), can be converted to particle energy-loss in the individual
EPHIN detectors (A through E).
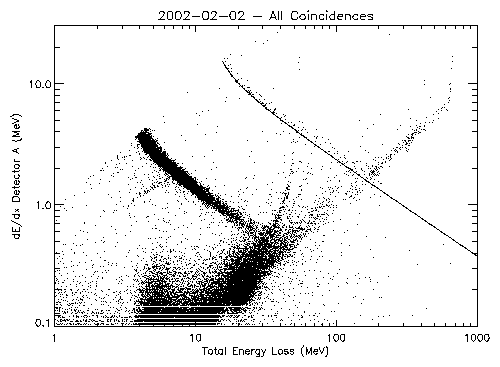
Figure 1 is a scatter plot of the energy loss in the A detector versus
the summed energy loss in detectors A through E for all
coincidences. The energy loss in detector A approximates the dE/dx
energy loss by the particle per unit length in traveling through
matter. dE/dx is proportional to (Z/v)2, where Z is the
particle charge and v is particle velocity. The total energy loss
of a particle stopped in the EPHIN is the particle kinetic energy
(1/2mv2). Thus the product (dE/dx)×E is
proportional to mZ2 so that different isotopes should
roughly follow lines with a slope of -1 in figure 1. The solid
line is a calibration curve that represents the expected location
of alpha particles (4He), after accounting for a
break-down in the assumption that the energy loss in detector A is
a good approximation for dE/dx. The dark band that parallels it at
lower total energy loss is due to protons. Much of the band of
points that crosses the proton and alpha particle bands is due to
particles that are not stopped within detectors A-E, the Integral
channel, and so the summed energy losses does not reflect the
particle kinetic energy.
|
| Figure 1: Energy loss in Detector A versus the energy
loss in detectors A through E. All coincidences are included in the
event selection. Coincidences with the lowest total and detector A
losses are not shown (off plotted scale). The alpha particle
calibration is shown as a solid line.
|
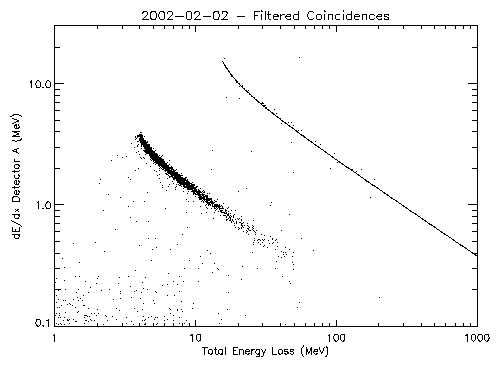
The data presented in figure 1 can be cleaned up via filtering. We can
reject coincidences that are identified as being from the Integral
channel and those whose directions are from large angles relative
to the EPHIN axis. Figure 2 is a plot similar to figure 1 where we
have made this discrimination. Note that the events that cross the
proton and alpha bands have been removed.
|
| Figure 2: Energy loss in Detector A versus the energy
loss in detectors A through E. Integral channel coincidences are not
included. The coincidences were also required to pass through the same
segments on the A and B detectors to restrict the acceptance angle.
|
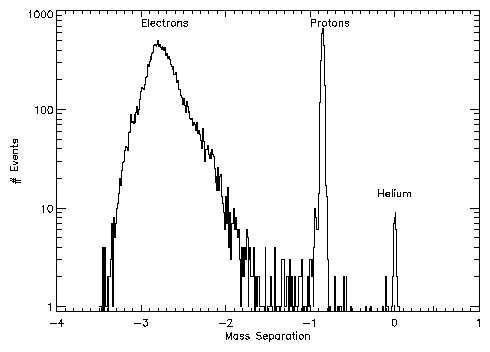
The width of the proton band depends on the detector resolution. The
events in figure 2 can be "rotated" into a space where the
distance of a point from the 4He calibration curve can
be calculated. A histogram of these distances shows peaks from the
different particles as shown in figure 3.
|
|
Figure 3: Histogram of mass separations from the Helium
calibration curve.
|
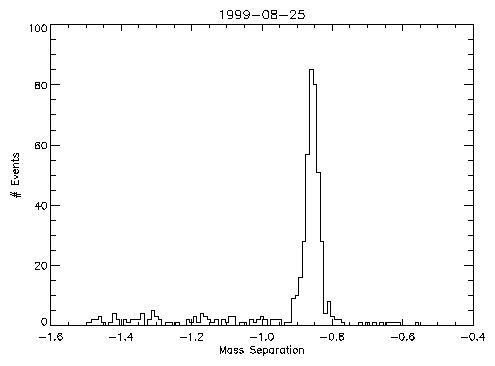
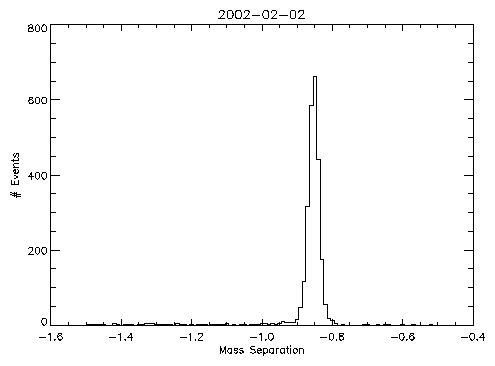
We can concentrate on just the proton peak and do a comparison of data
from early in the mission (1999-Aug-25) to more recent data
(2002-Feb-02). These data are shown in figure 4. The width of the
recent peak is not noticeably wider than the one from early in the
mission suggesting that there has not been significant degradation
in the EPHIN detectors. We should begin a long-term process of
monitoring the width of this peak as a function of time for signs
of broadening of this peak. It may be necessary to filter out
times when we are in the radiation zones or possibly times
affected by solar events.
|
|
|
Figure 4: Proton peaks from mass separation histograms. Top)
data from 1999-Aug-25 Bottom) data from 2002-Feb-02.
|
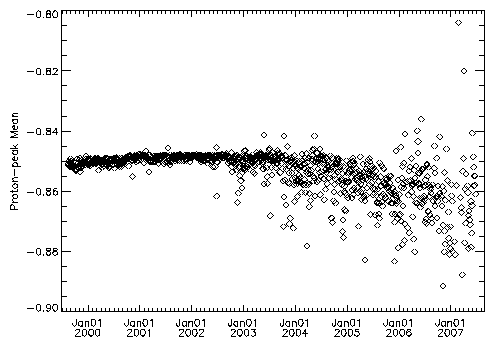
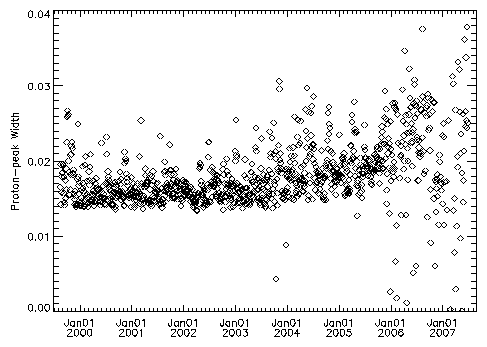
As an initial attempt at looking for any trends with time, I have
divided the EPHIN data into orbits, selecting times on each orbit
when CHANDRA was at geocentric distance greater than
80,000 km. For each orbit interval I have selected the events
with a mass separation in the range -0.9 to -0.8 (i.e. the proton
peak) and calculated the mean and RMS deviation from the mean. The
results are plotted in figure 5. Some of the large upward
fluctuations in width are due to a limited number of events in the
peak, while others are associated with times of high solar
activity (e.g. July 2000 or Nov 2000). The width seems to have a
"floor" that may have risen very slightly with time. A possibly
more interesting trend is the change in the mean with time. This
change may be due to calibration changes caused by the temperature
increase or by detector degradation.
|
|
|
Figure 5: Proton-peak Mean (top) and width (bottom) versus
time. |
Tabulation of the data for individual orbit intervals can be veiwed on
this page.
References
"Correction of CHANDRA EPHIN Counting Rate Measurements", Reinhold
Mueller-Mellin, 2000, memo.
Last modified: Mon Jun 10 16:12:58 EDT 2002
Dr. Michael Juda
Harvard-Smithsonian Center for Astrophysics
60 Garden Street, Mail Stop 70
Cambridge, MA 02138, USA
Ph.: (617) 495-7062
Fax: (617) 495-7356
E-mail: mjuda@cfa.harvard.edu


