|
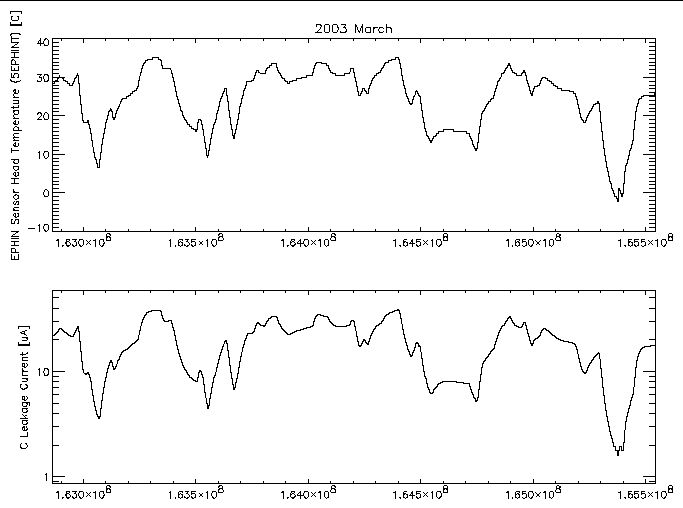
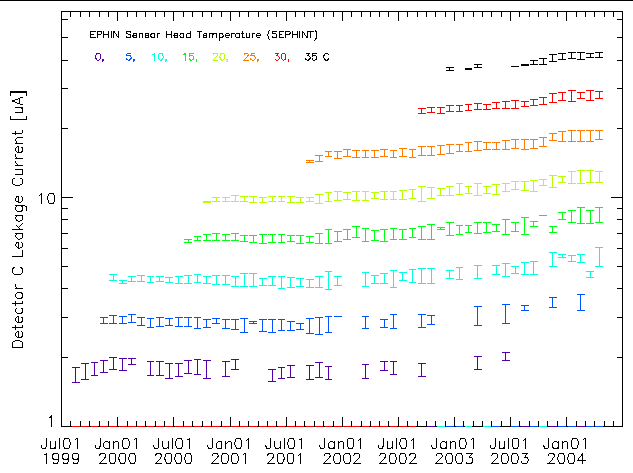
| Figure 1: EPHIN sensor head temperature (MSID 5EPHINT) and detector C leakage current versus time for 2003 March. |
In this note I present the observed behavior of the individual EPHIN detector leakage currents with temperature and time. For a given time I show how the leakage current can be modeled as an exponentially increasing function with temperature (as expected for a diode). I present trends in the fits of this functional form to monthly blocks of data and use those fits to determine a temporal trend for a temperature threshold above which current limiting of the 27V supply may occur.
|
|
| Figure 1: EPHIN sensor head temperature (MSID 5EPHINT) and detector C leakage current versus time for 2003 March. |
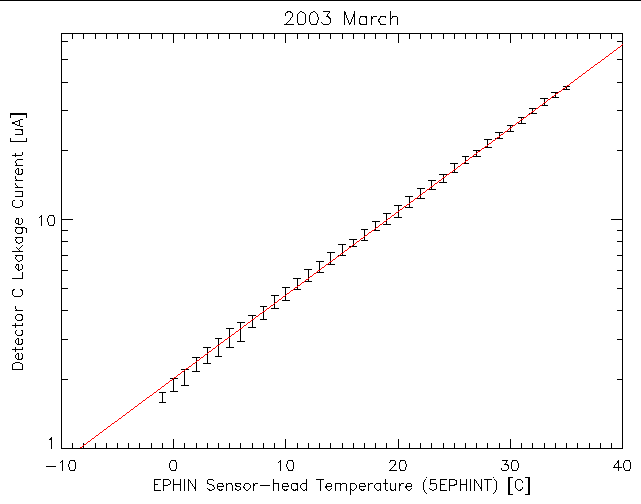
A more direct comparison of the leakage current and temperature can be made by plotting one against the other. For any given temperature there are many samples of the current with possibly several different values. A scatter plot of the individual samples can show any underlying trend but it is more useful to show the mean and standard deviation of the current samples at a given temperature. Figure 2 shows this for the data from figure 1 for samples within 1 degree C wide temperature bins.
|
| Figure 2: Mean and standard deviation of the detector C leakage current as a function of EPHIN sensor head temperature for 2003 March. The red line is the best-fit of an exponential function [2.016×e0.0841×T]. |
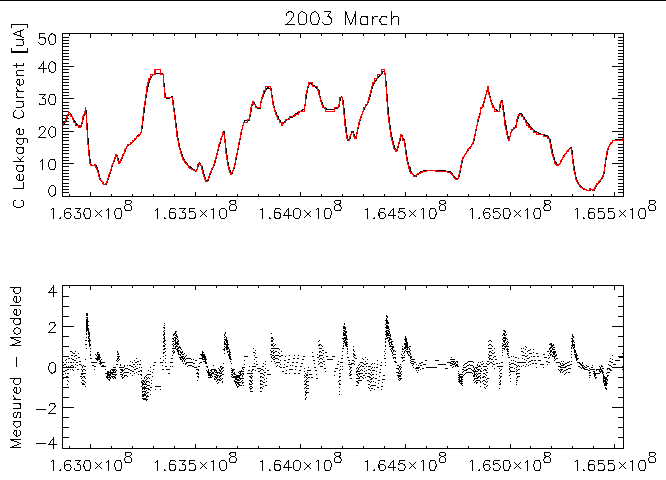
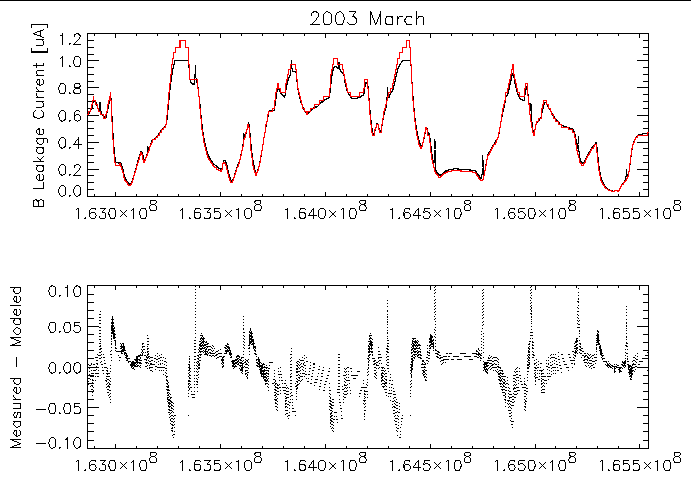
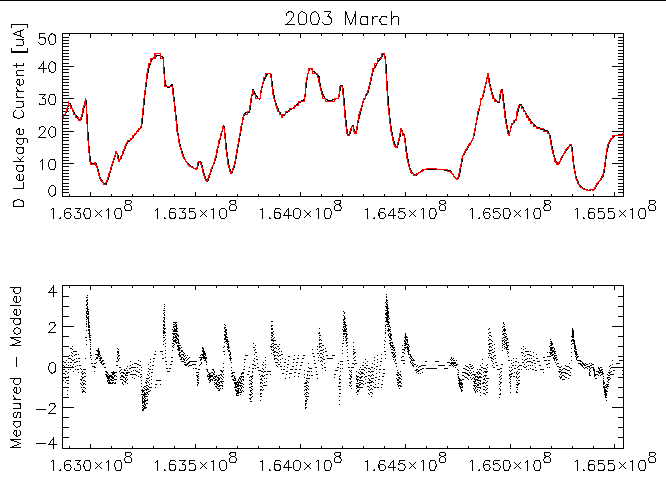
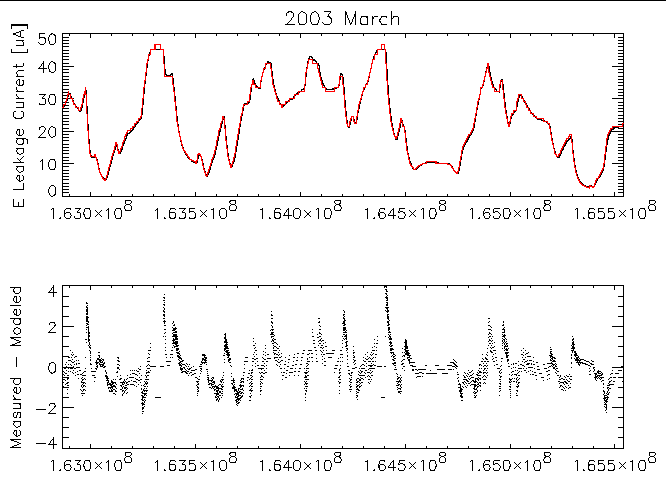
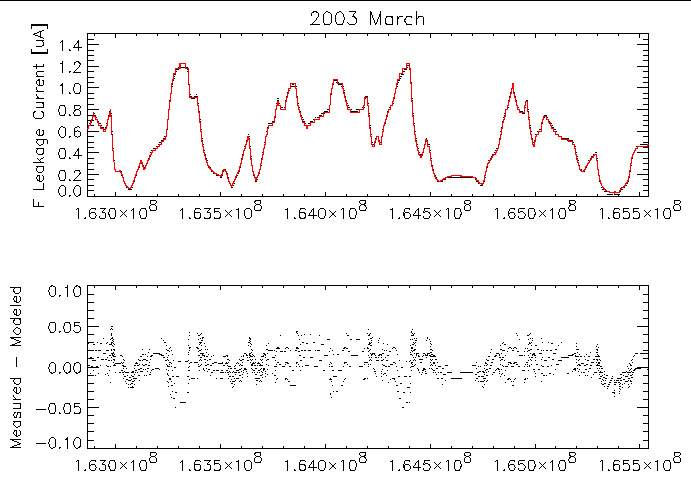
Also plotted in figure 2 is the best-fit exponential function to these data. A close comparison of the data and model reveals systematic deviations. While the thermistor on the sensor head may be expected to provide the closest measure of the detector temperature, finite thermal conductance and heat capacities can lead to lags in the relative responses of the leakage current and the thermistor readings as the temperature changes. Lags in the temperature response of one relative to the other as the temperature changes with spacecraft attitude changes can lead to such systematic distortions. Figure 3 below shows the 2003 March detector C leakage current data compared to the current modeled using the best-fit relation shown in figure 2 and the measured sensor head temperature; the deviations as shown in the lower pane of the plot swing about 0 µA and trend to 0 µA if the temperature is stable for long enough. By working with month-long blocks of data it might be hoped that distortions would be minimized by averaging lags going in both directions.
|
| Figure 3: Top: Measured EPHIN detector C leakage current (black) compared to modeled value (red) as a function of time for data from 2003 March. Modeled parameters are from the best-fit shown in figure 2. Bottom: Difference between measured and modeled currents. |
Plots similar to Figure 3 for the other detectors are available at the following links:
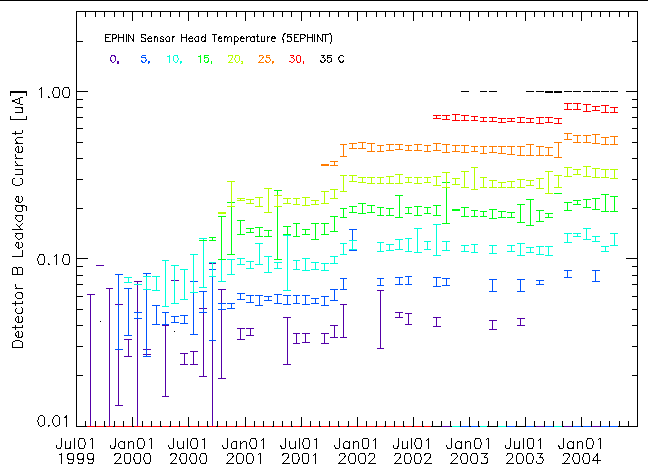
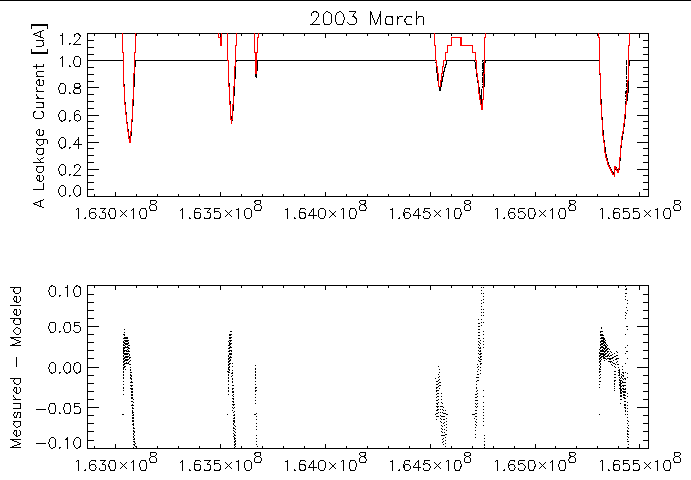
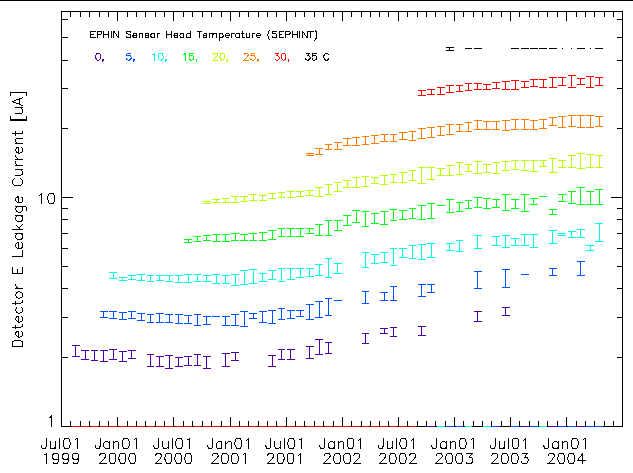
The change in detector leakage current with time can be viewed using the month-long data blocks and plotting the mean current within given temperature bins. Figures 4 and 5 show the detector B and C leakage currents as a function of time at different temperatures. Two trends with time are apparent: 1) higher temperatures are reached as time increases and 2) the current at a given temperature increases as time increases. For the detector B current much of the increase with time comes in discrete steps. The times of these steps coincide with times of major increases in the high-energy particle flux (solar storms). The 35C data points plotted for detector B are at 1.0±0.0 µA since at that temperature the leakage current exceeds the readout ceiling of 1.0 µA. The same issue occurs in detector A at an even lower temperature and in detector E, where the ceiling is ~45 µA (see figures at links below).
|
| Figure 4: Detector B leakage current for various temperatures as a function of time taken from month-long data blocks. The temperature is indicated by symbol color. |
|
| Figure 5: Detector C leakage current for various temperatures as a function of time taken from month-long data blocks. The temperature is indicated by symbol color. |
Plots similar to figures 4 and 5 are available for the other detectors at the following links:
In each of the detectors the current at a fixed temperature has increased with time. The step increases associated with solar storms argues for this increase being caused by radiation damage. Radiation damage induced defects can produce charge states that are more likely to be thermally excited into the conduction band, increasing the leakage current.
|
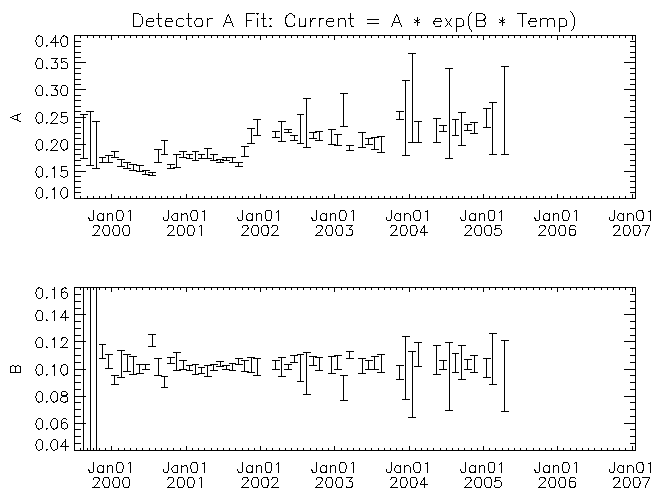
| Figure 6: Exponential fit coefficients for month-long data block of detector A leakage current vs temperature as a function of time. |
|
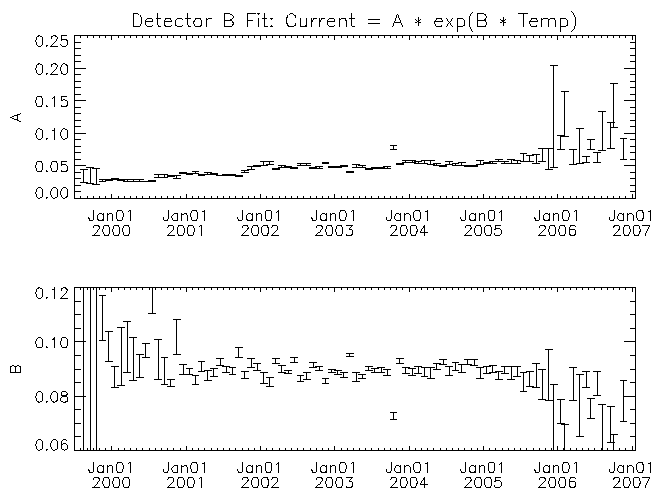
| Figure 7: Similar to figure 6 but for detector B. |
|
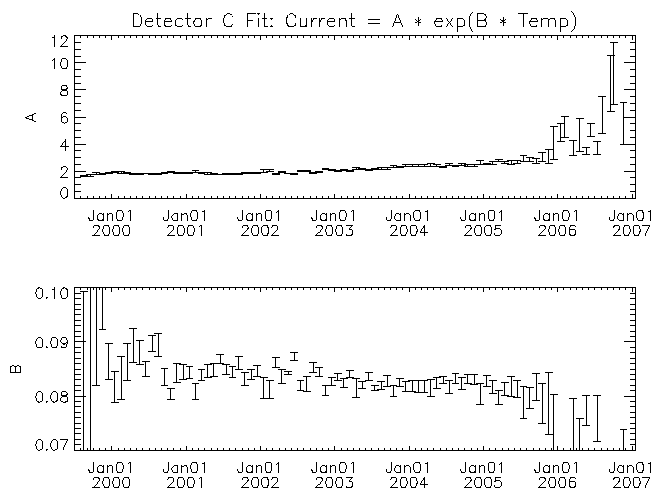
| Figure 8: Similar to figure 6 but for detector C. |
|
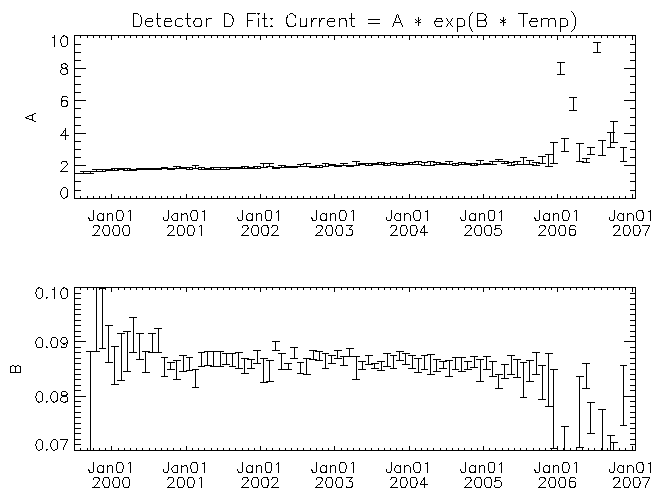
| Figure 9: Similar to figure 6 but for detector D. |
|
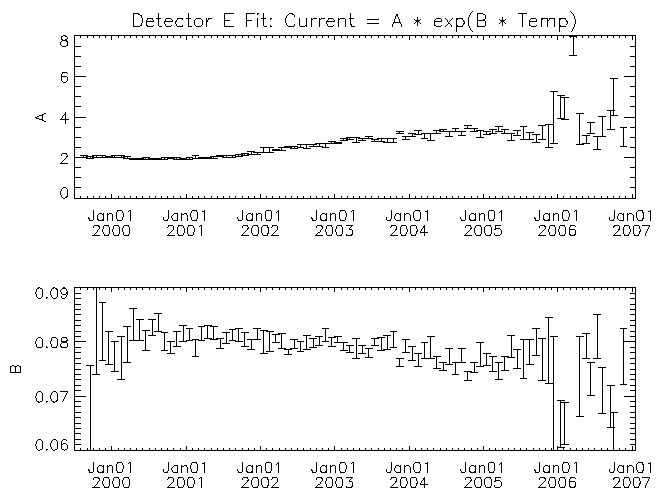
| Figure 10: Similar to figure 6 but for detector E. |
|
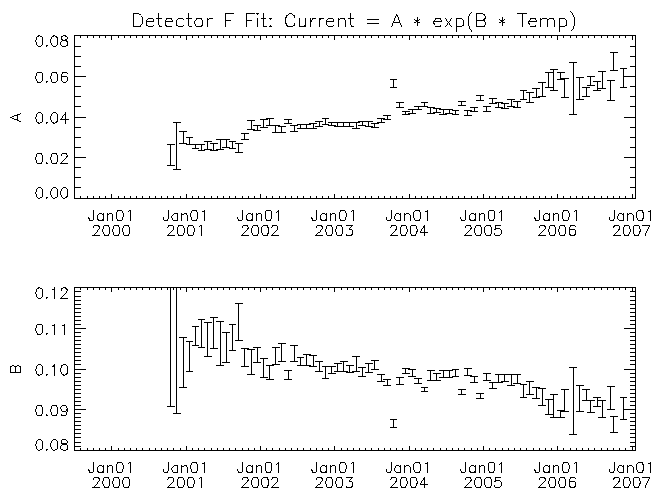
| Figure 11: Similar to figure 6 but for detector F. |
For each detector the amplitude multiplier of the exponential (A) increases with time. There may be a trend for the temperature scaling parameter (B) to decrease with time for some of the detectors (detector F in particular). While it is clear from figures 4 and 5 that there is a real trend for the current to increase with time, some of the trend in the fit parameters with time might have its origin in other causes. For example, some of the trend might be the result of the exponential function not matching the real behavior of the leakage current with temperature. As time progresses the fit is being made across an increasing temperature range with the mid-point of the range increasing as well. If the leakage current versus temperature curve is more complicated than the assumed exponential, then the fit parameters would show a systematic change with time. I note these possible deficiencies because to estimate the temperature where the leakage currents might be high enough to lead to the current-limited behavior of the 27V supply requires extrapolation beyond the fitted region. A better understanding of the systematic effects will be necessary if we were to wish to extrapolate these trends with time into the future.
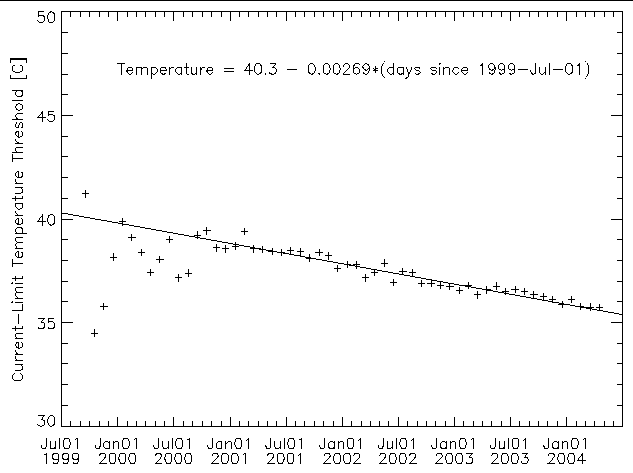
I have used the fit parameters with time to derive a value for the sum of the detector leakage currents with temperature and time. The modeled detector currents for the C, D, and E detectors were not allowed to exceed 64 µA as each of their HV cascades are current-limited to prevent detector damage caused by current-induced thermal run-away. The HV cascade that supplies the A, B, and F detectors also has a current limit but I have not limited the sum of their modeled currents (dominated by the detector A current). This will make any prediction of the temperature at which the sum of the currents reaches 156 µA a conservative estimate. Figure 12 shows a plot of the threshold temperature (temperature where the 27V supply may be expected to current limit) derived from the sums of the modeled currents. Over-plotted is a linear trend fit to the monthly points.
|
| Figure 12: Estimated temperature threshold of where we may expect the on-set of current-limited behavior of the 27V supply based on summing models for the EPHIN detector leakage currents. The solid line is a linear fit to the trend. |
The threshold temperature values in figure 12 are lower than the temperatures at which the current limiting occurred. In 2003 November the 27V supply voltage dropped upon reaching a sensor head temperature of ~38.60C while the linear trend yields 35.99C. For the 2004 March event, the drop in the 27V output came at 37.75C while the linear trend gives 35.65C. The temperature differences, 2.6C and 2.1C might be consistent with the expectation from lags in the temperature response between the EPHIN detectors and the sensor-head thermistor temperature. A preliminary check of this possibility can be made by taking the measured sum of detector leakage currents and using the modeled sum from above to derive a corresponding temperature to compare with the measured temperature. Doing this for the 2004 April data block gives deviations from -1.0C to 1.5C suggesting that temperature response lags could be a contributor to the difference.
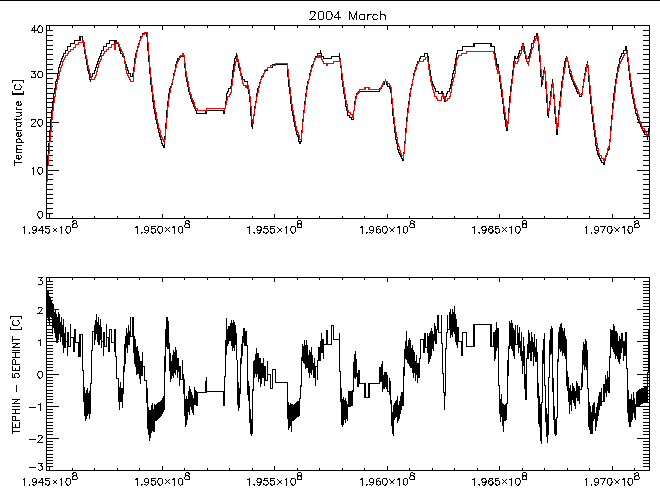
The mission planning process uses a prediction for the reading of the MSID TEPHIN to limit the maximum temperature the EPHIN will reach. The TEPHIN values have a much larger lag from the EPHIN detectors than the sensor head temperature. Figure 13 shows a comparison of the two temperature readings for the month of 2004 March. The sharp swings in the temperature differences are indicative of a difference in the thermal time-constants of the monitored points. Additionally, there appears to be evidence for the temperature difference to depend on the absolute temperature.
|
| Figure 13: The top panel shows the EPHIN sensor head temperature (red) and the TEPHIN temperature (black) as a function of time for 2004 March. The bottom panel is a plot of the temperature difference. |
Given the difference in the thermal response of TEPHIN and 5EPHINT, it would be preferable for the FOT to use a model for the 5EPHINT temperature in predicting the EPHIN temperature profile during mission planning. Until such a model is available we need to determine an appropriate threshold to use with the TEPHIN prediction. Since we would be using the threshold temperature as a planning limit, it is likely that it would be approached only after a considerable time relative to the thermal response time and the "average" temperature difference between the sensor head temperature and the TEPHIN temperature is the appropriate offset to use. At the higher temperature end the difference (TEPHIN - 5EPHINT) is ~1C. If we adopt an offset of 1C in the temperature threshold we would get a planning limit of:
I have produced a prediction for the temperature threshold at which we would be concerned about triggering another episode of reduced 27V supply output. This prediction is expected to be conservative but it is perhaps overly conservative due to the several degree F discrepancy between the predicted threshold and the actual on-set of the problem. Using the predicted TEPHIN threshold as a basis and subtracting a margin-of-error to account for limitations in the TEPHIN profile modeling would likely place a too restrictive limit on mission planning. It is possible that improved modeling of the leakage current versus temperature relation, including deviations from a simple exponential, would reduce the size of the discrepancy and provide a more useful planning limit. However, it seems reasonable to use the value for the downward trend in the threshold temperature to adjust the TEPHIN planning threshold; the adjustment amounts to -0.15F/month.
In addition searching for improvements to the fits, continued trending of the data is necessary to spot departures from the essentially linear decrease with time in the threshold temperature that has been observed to date.
Dr. Michael Juda
Harvard-Smithsonian Center for Astrophysics
60 Garden Street, Mail Stop 70
Cambridge, MA 02138, USA
Ph.: (617) 495-7062
Fax: (617) 495-7356
E-mail:
mjuda@cfa.harvard.edu