2005-11-02 Episode
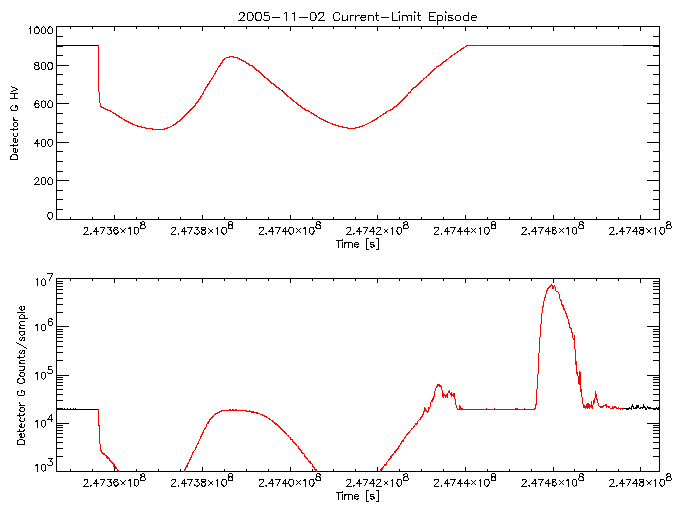
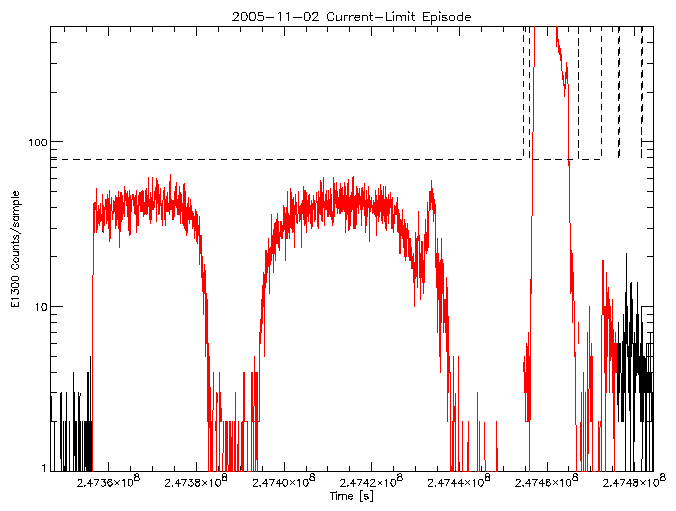
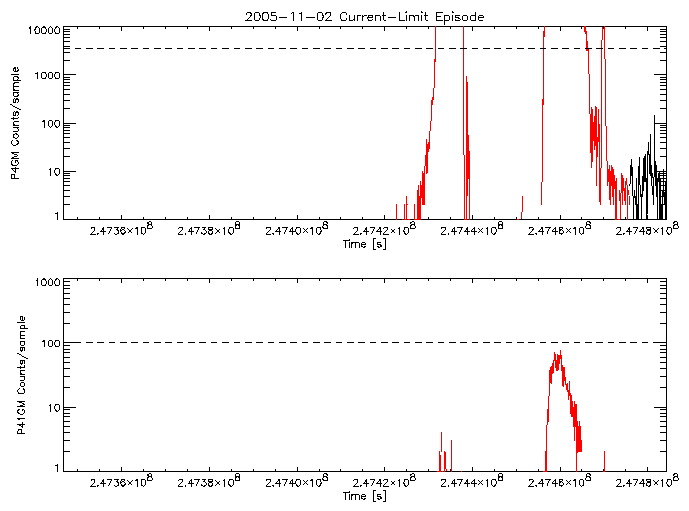
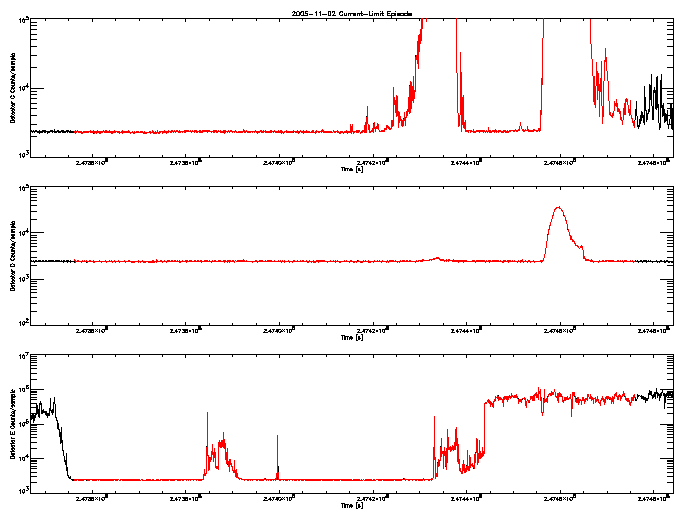
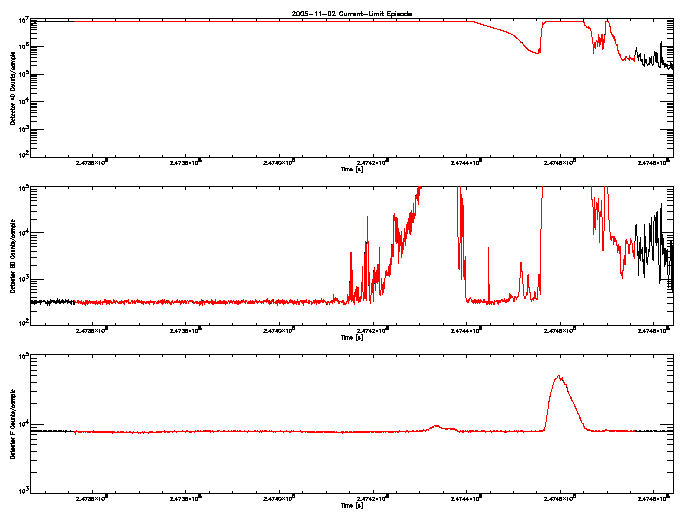
In the plots below the red portion of the
curves indicate times when the +27V supply was at a reduced output
level because of current-limited behavior.
Detector G HV and Rate
E1300 Coincidence Channel Rate
P4GM and P41GM Coincidence Channel Rate
Detector C, D, & E Rates
Detector A, B, & F Rates
Last modified: Mon Nov 7 11:38:11 EST 2005
Dr. Michael Juda
Harvard-Smithsonian Center for Astrophysics
60 Garden Street, Mail Stop 70
Cambridge, MA 02138, USA
Ph.: (617) 495-7062
Fax: (617) 495-7356
E-mail:
mjuda@cfa.harvard.edu